The median household income in Oregon, IL in 2022 was $70,849, which was 8.3% less than the median annual income of $76,708 across the entire state of Illinois. Compared to the median income of $34,842 in 2000 this represents an increase of 50.8%. The per capita income in 2022 was $33,468, which means an increase of 43.2% compared to 2000 when it was $19,019.
Whole page based on the data from 2000 / 2022 when the population of Oregon, Illinois was 4,060 / 3,908
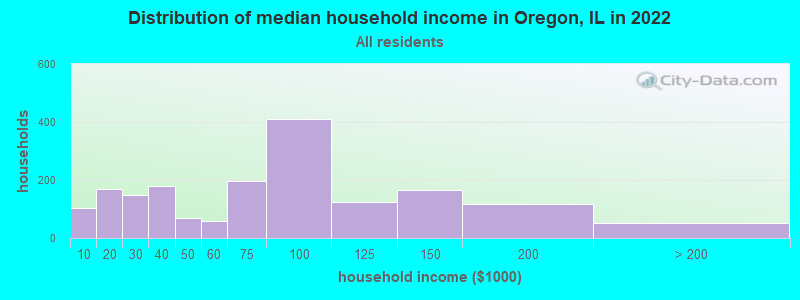
Income statistics for all residents
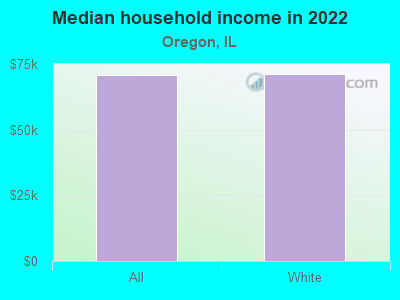
Median household income in Oregon, IL in 2022:
Oregon:
$70,850
State:
$76,708
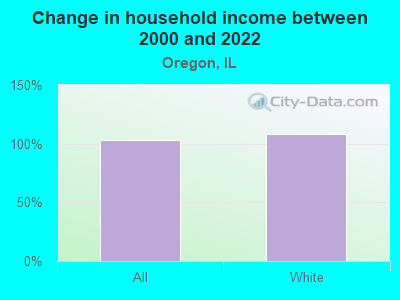
Change in median household income between 2000 and 2022:
Oregon, Illinois:
+103.3%
State:
+64.6%
Number of households with income < $10k:
Oregon:
5.7% (102)
State:
5.9% (296,090)
Number of households with income $10k - 20k:
Oregon:
9.5% (170)
State:
6.6% (333,259)
Number of households with income $20k - 30k:
Oregon:
8.3% (149)
State:
6.8% (342,921)
Number of households with income $30k - 40k:
Oregon:
10.0% (180)
State:
7.0% (355,254)
Number of households with income $40k - 50k:
Oregon:
3.8% (69)
Illinois:
6.7% (340,678)
Number of households with income $50k - 60k:
Oregon:
3.3% (60)
Illinois:
6.7% (339,405)
Number of households with income $60k - 75k:
Oregon:
11.0% (197)
State:
9.2% (465,709)
Number of households with income $75k - 100k:
Oregon:
22.8% (409)
Illinois:
12.9% (651,353)
Number of households with income $100k - 125k:
Oregon:
7.0% (125)
Illinois:
10.3% (522,359)
Number of households with income $125k - 150k:
Oregon:
9.1% (164)
Illinois:
7.3% (367,136)
Number of households with income $150k - 200k:
Oregon:
6.6% (118)
State:
9.0% (455,249)
Number of households with income > $200k:
Oregon:
2.8% (51)
Illinois:
11.6% (586,947)
Aggregate household income in Oregon in 2022: $132,081,406
Median family income in Oregon in 2022:
Oregon:
$82,503
State:
$96,948
Number of families with income < $10k:
Oregon:
1.2% (13)
Illinois:
3.4% (105,875)
Number of families with income $20k - 30k:
Oregon:
9.5% (96)
Illinois:
4.7% (146,403)
Number of families with income $30k - 40k:
Oregon:
5.7% (58)
State:
5.3% (167,069)
Number of families with income $40k - 50k:
Oregon:
4.3% (44)
Illinois:
5.8% (181,164)
Number of families with income $50k - 60k:
Oregon:
4.8% (49)
State:
6.1% (191,561)
Number of families with income $60k - 75k:
Oregon:
12.5% (127)
State:
9.0% (282,985)
Number of families with income $75k - 100k:
Oregon:
22.2% (226)
State:
13.8% (432,725)
Number of families with income $100k - 125k:
Oregon:
14.3% (146)
Illinois:
11.9% (373,296)
Number of families with income $125k - 150k:
Oregon:
12.9% (131)
State:
8.9% (279,791)
Number of families with income $150k - 200k:
Oregon:
10.7% (109)
State:
11.9% (372,004)
Number of families with income > $200k:
Oregon:
1.9% (20)
State:
15.9% (500,033)
Median non-family income in Oregon in 2022:
Oregon:
$33,800
State:
$46,533
Change in median non-family income between 2000 and 2022:
Oregon, Illinois:
+55.0%
State:
+64.0%
Median per capita income in Oregon in 2022:
Oregon:
$33,469
State:
$43,317
Change in median per capita income between 2000 and 2022:
Oregon, Illinois:
+76.0%
Illinois:
+87.5%
Income statistics for White residents
Median household income in Oregon, IL in 2022:
Oregon:
$71,321
Illinois:
$83,346
Change in median household income between 2000 and 2022:
Oregon, Illinois:
+107.8%
State:
+67.5%
Number of households with income < $10k:
Oregon:
5.8% (96)
Illinois:
4.5% (149,895)
Number of households with income $10k - 20k:
Oregon:
9.2% (152)
Illinois:
5.5% (184,529)
Number of households with income $20k - 30k:
Oregon:
8.6% (142)
State:
6.1% (205,767)
Number of households with income $30k - 40k:
Oregon:
9.3% (153)
State:
6.7% (225,572)
Number of households with income $40k - 50k:
Oregon:
3.9% (64)
State:
6.5% (216,965)
Number of households with income $50k - 60k:
Oregon:
3.5% (57)
State:
6.6% (222,841)
Number of households with income $60k - 75k:
Oregon:
11.4% (188)
Illinois:
9.3% (312,758)
Number of households with income $75k - 100k:
Oregon:
22.8% (376)
State:
12.9% (433,180)
Number of households with income $100k - 125k:
Oregon:
7.1% (117)
State:
10.7% (360,753)
Number of households with income $125k - 150k:
Oregon:
8.7% (144)
State:
7.9% (266,532)
Number of households with income $150k - 200k:
Oregon:
6.8% (113)
State:
10.0% (337,357)
Number of households with income > $200k:
Oregon:
3.0% (49)
State:
13.3% (446,069)
Aggregate household income in Oregon in 2022: $122,803,998
Median family income in Oregon in 2022:
Oregon:
$83,816
State:
$107,938
Number of families with income < $10k:
Oregon:
1.3% (12)
Illinois:
2.2% (45,983)
Number of families with income $20k - 30k:
Oregon:
9.4% (89)
State:
3.5% (70,927)
Number of families with income $30k - 40k:
Oregon:
5.7% (53)
State:
4.4% (90,563)
Number of families with income $40k - 50k:
Oregon:
4.1% (38)
State:
5.0% (102,597)
Number of families with income $50k - 60k:
Oregon:
4.9% (46)
Illinois:
5.8% (119,129)
Number of families with income $60k - 75k:
Oregon:
12.5% (118)
Illinois:
8.8% (179,665)
Number of families with income $75k - 100k:
Oregon:
21.4% (202)
State:
13.5% (276,887)
Number of families with income $100k - 125k:
Oregon:
14.5% (137)
State:
12.5% (256,099)
Number of families with income $125k - 150k:
Oregon:
13.2% (124)
State:
9.8% (199,855)
Number of families with income $150k - 200k:
Oregon:
11.0% (104)
Illinois:
13.4% (274,569)
Number of families with income > $200k:
Oregon:
2.0% (19)
State:
18.6% (381,354)
Median non-family income in Oregon in 2022:
Oregon:
$34,286
State:
$50,934
Change in median non-family income between 2000 and 2022:
Oregon, Illinois:
+60.3%
State:
+70.7%
Median per capita income in Oregon in 2022:
Oregon:
$34,763
State:
$50,738
Change in median per capita income between 2000 and 2022:
Oregon, Illinois:
+87.4%
State:
+95.5%
Income statistics for Asian residents
Number of households with income < $10k:
Oregon:
0.0% (0)
State:
5.3% (14,653)
Number of households with income $10k - 20k:
Oregon:
0.0% (0)
State:
4.5% (12,283)
Number of households with income $20k - 30k:
Oregon:
0.0% (0)
State:
4.8% (13,135)
Number of households with income $30k - 40k:
Oregon:
100.0% (16)
State:
5.0% (13,655)
Number of households with income $40k - 50k:
Oregon:
0.0% (0)
State:
4.5% (12,357)
Number of households with income $50k - 60k:
Oregon:
0.0% (0)
State:
4.9% (13,568)
Number of households with income $60k - 75k:
Oregon:
0.0% (0)
State:
7.1% (19,606)
Number of households with income $75k - 100k:
Oregon:
0.0% (0)
State:
12.1% (33,349)
Number of households with income $100k - 125k:
Oregon:
0.0% (0)
Illinois:
9.7% (26,669)
Number of households with income $125k - 150k:
Oregon:
0.0% (0)
State:
7.3% (20,172)
Number of households with income $150k - 200k:
Oregon:
0.0% (0)
Illinois:
11.5% (31,711)
Number of households with income > $200k:
Oregon:
0.0% (0)
State:
23.1% (63,411)
Aggregate household income in Oregon in 2022: $4,192,615
Median per capita income in Oregon in 2022:
Oregon:
$83,821
State:
$52,977
Change in median per capita income between 2000 and 2022:
Oregon, Illinois:
+127.2%
State:
+119.5%
Income statistics for Hispanic or Latino residents
Number of households with income < $10k:
Oregon:
0.0% (0)
Illinois:
4.9% (33,145)
Number of households with income $10k - 20k:
Oregon:
0.0% (0)
State:
5.4% (36,345)
Number of households with income $20k - 30k:
Oregon:
0.0% (0)
State:
7.5% (50,677)
Number of households with income $30k - 40k:
Oregon:
0.0% (0)
Illinois:
7.7% (52,008)
Number of households with income $40k - 50k:
Oregon:
0.0% (0)
State:
8.1% (54,702)
Number of households with income $50k - 60k:
Oregon:
0.0% (0)
Illinois:
7.5% (51,062)
Number of households with income $60k - 75k:
Oregon:
0.0% (0)
State:
11.3% (76,576)
Number of households with income $75k - 100k:
Oregon:
0.0% (0)
State:
15.5% (105,152)
Number of households with income $100k - 125k:
Oregon:
76.1% (51)
Illinois:
11.5% (77,760)
Number of households with income $125k - 150k:
Oregon:
23.9% (16)
Illinois:
7.3% (49,310)
Number of households with income $150k - 200k:
Oregon:
0.0% (0)
Illinois:
7.6% (51,233)
Number of households with income > $200k:
Oregon:
0.0% (0)
Illinois:
5.9% (40,028)
Aggregate household income in Oregon in 2022: $2,755,012
Median per capita income in Oregon in 2022:
Oregon:
$30,146
State:
$26,551
Change in median per capita income between 2000 and 2022:
Oregon, Illinois:
+65.6%
State:
+111.0%
Income statistics for Multirace residents
Number of households with income < $10k:
Oregon:
0.0% (0)
Illinois:
5.3% (21,595)
Number of households with income $10k - 20k:
Oregon:
30.2% (13)
State:
6.5% (26,720)
Number of households with income $20k - 30k:
Oregon:
0.0% (0)
State:
8.0% (32,573)
Number of households with income $30k - 40k:
Oregon:
0.0% (0)
State:
8.4% (34,383)
Number of households with income $40k - 50k:
Oregon:
0.0% (0)
State:
7.4% (30,234)
Number of households with income $50k - 60k:
Oregon:
0.0% (0)
Illinois:
6.9% (28,432)
Number of households with income $60k - 75k:
Oregon:
0.0% (0)
State:
10.2% (41,780)
Number of households with income $75k - 100k:
Oregon:
14.0% (6)
State:
13.0% (53,426)
Number of households with income $100k - 125k:
Oregon:
0.0% (0)
State:
10.5% (43,126)
Number of households with income $125k - 150k:
Oregon:
55.8% (24)
Illinois:
7.6% (31,153)
Number of households with income $150k - 200k:
Oregon:
0.0% (0)
State:
7.6% (30,946)
Number of households with income > $200k:
Oregon:
0.0% (0)
Illinois:
8.6% (35,208)
Aggregate household income in Oregon in 2022: $3,936,646
Median per capita income in Oregon in 2022:
Oregon:
$28,257
State:
$29,285
Change in median per capita income between 2000 and 2022:: -20.2%
Oregon, Illinois:
-20.2%
State:
+112.9%
Discuss Oregon, Illinois (IL) on our hugely popular Illinois forum.