Jump to a detailed profile or search site with Google Custom Search

Northwest Rockwall, TX (Texas) Houses and Residents

Estimated median house or condo value in 2022: $433,219 (it was $145,500 in 2000)
Northwest Rockwall:

$433,219
Texas:

$275,400
Lower value quartile - upper value quartile: $338,901 - $583,437

Total population: 36,894 (Urban population: 20,595, Rural population: 1,298 (65 farm, 1,233 nonfarm))

Houses: 7,801 (7,440 occupied: 6,068 owner occupied, 1,372 renter occupied)

% of renters here:

18%
State:

38%

Housing density: 379 houses/condos per square mile

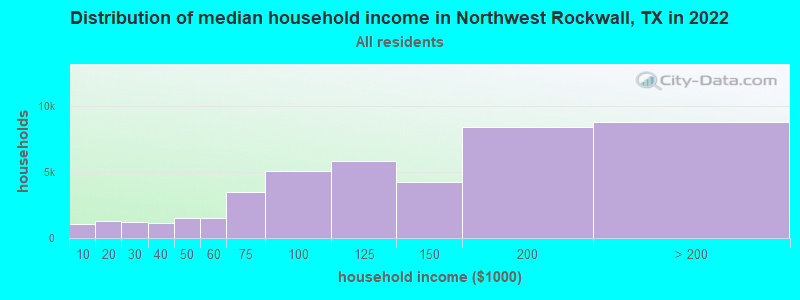
Median price asked for vacant for-sale houses and condos in 2022 in this county: $348,800.

Median contract rent in 2022: $1,983 (lower quartile is $1,575, upper quartile is over $2,000)


Median rent asked for vacant for-rent units in 2022: $2,531


Median gross rent in Northwest Rockwall, TX in 2022: $1,954

Housing units in Northwest Rockwall with a mortgage: 4,512 (272 second mortgage, 222 home equity loan, 14 both second mortgage and home equity loan)
Houses without a mortgage: 1,216

Compare current foreclosures near Northwest Rockwall, TX:

Check out more offers near Northwest Rockwall, TX.
Powered by Foreclosure.com


Northwest Rockwall, Texas Age and Sex of Residents

Household type by relationship:

Households: 77,678
  • In family households: 71,461 (16,531 male householders, 4,806 female householders)
    17,816 spouses, 26,890 children (24,591 natural, 717 adopted, 1,582 stepchildren), 1,402 grandchildren, 531 brothers or sisters, 729 parents, foster children, 902 other relatives, 1,235 non-relatives
  • In nonfamily households: 6,217 (2,335 male householders (1,825 living alone)), 2,776 female householders (2,415 living alone)), 1,106 nonrelatives
  • In group quarters: 659 (all institutionalized)

10,457 married couples with children.
1,638 single-parent households (450 men, 1,188 women).

91.5% of residents of Northwest Rockwall speak English at home.
5.6% of residents speak Spanish at home (65% speak English very well, 19% speak English well, 14% speak English not well, 3% don't speak English at all).
1.9% of residents speak other Indo-European language at home (84% speak English very well, 10% speak English well, 4% speak English not well, 3% don't speak English at all).
0.9% of residents speak Asian or Pacific Island language at home (69% speak English very well, 21% speak English well, 10% speak English not well).
0.1% of residents speak other language at home (100% speak English very well).

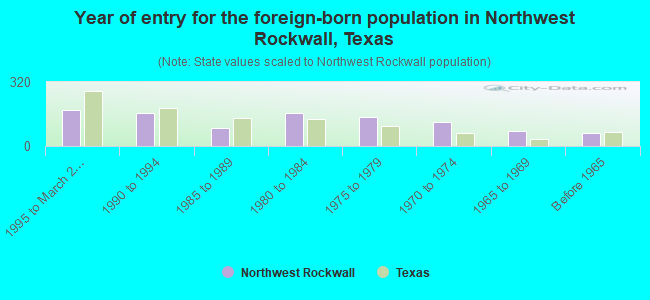
Foreign born population: 3,103 (5.0%)
(91.4% of them are naturalized citizens)

Median number of rooms in houses and condos:
Here:

8.8
State:

6.3

Median number of rooms in apartments
Here:

4.9
State:

4.0

Owner-occupied Renter-occupied
Bedrooms in owner-occupied houses and condos in Northwest Rockwall, Texas
  • Bedrooms in owner-occupied houses and condos in Northwest Rockwall, Texas
  • 9no bedroom
  • 771 bedroom
  • 2742 bedrooms
  • 3,2203 bedrooms
  • 2,2974 bedrooms
  • 1915+ bedrooms
Bedrooms in renter-occupied apartments in Northwest Rockwall, Texas
  • Bedrooms in renter-occupied apartments in Northwest Rockwall, Texas
  • 42no bedroom
  • 4301 bedroom
  • 4452 bedrooms
  • 3693 bedrooms
  • 794 bedrooms
  • 75+ bedrooms
Owner-occupied Renter-occupied
Cars and other vehicles available in Northwest Rockwall in owner-occupied houses/condos
  • Cars and other vehicles available in Northwest Rockwall in owner-occupied houses/condos
  • 94no vehicle
  • 1,0331 vehicle
  • 3,3162 vehicles
  • 1,3363 vehicles
  • 2254 vehicles
  • 645+ vehicles
Cars and other vehicles available in Northwest Rockwall in renter-occupied apartments
  • Cars and other vehicles available in Northwest Rockwall in renter-occupied apartments
  • 53no vehicle
  • 6841 vehicle
  • 5502 vehicles
  • 763 vehicles
  • 94 vehicles
  • 05+ vehicles
Owner-occupied Renter-occupied
Rooms in owner-occupied houses in Northwest Rockwall, Texas
  • Rooms in owner-occupied houses in Northwest Rockwall, Texas
  • 01 room
  • 72 rooms
  • 843 rooms
  • 604 rooms
  • 8085 rooms
  • 1,1836 rooms
  • 1,6397 rooms
  • 1,2368 rooms
  • 1,0519+ rooms
Rooms in renter-occupied apartments in Northwest Rockwall, Texas
  • Rooms in renter-occupied apartments in Northwest Rockwall, Texas
  • 301 room
  • 662 rooms
  • 2563 rooms
  • 3974 rooms
  • 2695 rooms
  • 1756 rooms
  • 997 rooms
  • 438 rooms
  • 379+ rooms
Year house built
Breakdown of mean house values by ages of householders
  • Northwest Rockwall, TX household income distribution

  • Distribution of median household income in Northwest Rockwall, TX in 2022
  • 1,073Less than $10,000
  • 1,314$10,000 to $19,999
  • 1,208$20,000 to $29,999
  • 1,158$30,000 to $39,999
  • 1,533$40,000 to $49,999
  • 1,542$50,000 to $59,999
  • 3,446$60,000 to $74,999
  • 5,074$75,000 to $99,999
  • 5,823$100,000 to $124,999
  • 4,228$125,000 to $149,999
  • 8,409$150,000 to $199,999
  • 8,768$200,000 or more

Percentage of workers working in this county: 46.3%
Number of people working at home: 2,603 (14.9% of all workers)

Travel time to work (commute)

  • Less than 5 minutes: 301
  • 5 to 9 minutes: 1,088
  • 10 to 14 minutes: 1,139
  • 15 to 19 minutes: 704
  • 20 to 24 minutes: 919
  • 25 to 29 minutes: 715
  • 30 to 34 minutes: 1,619
  • 35 to 39 minutes: 427
  • 40 to 44 minutes: 642
  • 45 to 59 minutes: 1,838
  • 60 to 89 minutes: 759
  • 90 or more minutes: 222

Means of transportation to work:

  • Drove a car alone: 9,300 (85.4%)
  • Carpooled: 784 (7.2%)
  • Bus or trolley bus: 157 (1.4%)
  • Motorcycle: 8 (0.1%)
  • Walked: 99 (0.9%)
  • Other means: 25 (0.2%)
  • Worked at home: 516 (4.7%)
Class of Workers in 2000
Year of entry for the foreign-born population in Northwest Rockwall, Texas
  • Year of entry for the foreign-born population in Northwest Rockwall, Texas
  • 1801995 to March 2000
  • 1651990 to 1994
  • 881985 to 1989
  • 1651980 to 1984
  • 1431975 to 1979
  • 1221970 to 1974
  • 771965 to 1969
  • 66Before 1965

Most common places of birth for foreign-born residents (%):

Mexico
Northwest Rockwall:

32.3% (325)
Texas:

64.8% (1,879,369)

India
Northwest Rockwall:

14.7% (148)
Texas:

2.7% (78,388)

Philippines
Northwest Rockwall:

5.7% (57)
Texas:

1.6% (45,907)

Cambodia
Northwest Rockwall:

4.8% (48)
Texas:

0.2% (6,793)

Canada
Northwest Rockwall:

3.6% (36)
Texas:

1.3% (36,802)

United Kingdom
Northwest Rockwall:

3.4% (34)
Texas:

1.2% (36,176)

Vietnam
Northwest Rockwall:

3.4% (34)
Texas:

3.7% (107,027)

Germany
Northwest Rockwall:

3.2% (32)
Texas:

1.4% (39,249)

Argentina
Northwest Rockwall:

2.9% (29)
Texas:

0.2% (6,024)

Indonesia
Northwest Rockwall:

2.8% (28)
Texas:

0.1% (3,855)

Other Eastern Africa
Northwest Rockwall:

2.4% (24)
Texas:

0.4% (10,639)

Korea
Northwest Rockwall:

2.1% (21)
Texas:

1.2% (35,986)

Australia
Northwest Rockwall:

2.1% (21)
Texas:

0.1% (3,869)

Turkey
Northwest Rockwall:

1.8% (18)
Texas:

0.1% (2,943)

France
Northwest Rockwall:

1.7% (17)
Texas:

0.3% (7,663)

Panama
Northwest Rockwall:

1.7% (17)
Texas:

0.3% (7,514)

Other Eastern Europe
Northwest Rockwall:

1.6% (16)
Texas:

0.2% (5,112)

Place of birth for U.S.-born residents:

  • This state: 13,457
  • Other state: 7,287
  • Northeast: 1,041
  • Midwest: 2,485
  • South: 2,755
  • West: 1,006

49% of Northwest Rockwall residents lived in the same house 5 years ago.
   Out of people who lived in different houses, 24% lived in this county.
   Out of people who lived in different counties, 76% lived in Texas.

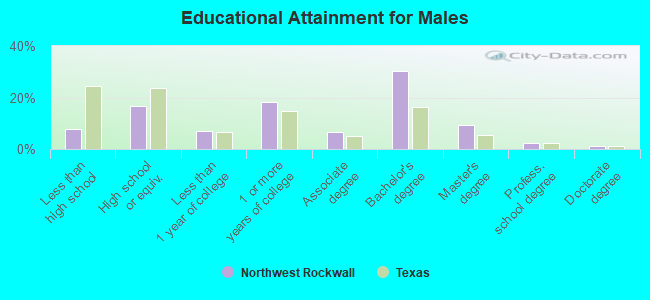
Education attainment for males 25 years and older:

  • No schooling: 45
  • Nursery to 4th grade: 0
  • 5th and 6th grade: 84
  • 7th and 8th grade: 37
  • 9th grade: 64
  • 10th grade: 68
  • 11th grade: 82
  • 12th grade, no diploma: 129
  • High school graduate (or equivalency): 1,125
  • Less than 1 year of college: 472
  • Some college more than 1 year, no degree: 1,223
  • Associate degree: 445
  • Bachelor's degree: 2,032
  • Master's degree: 615
  • Professional school degree: 162
  • Doctorate degree: 84
Educational Attainment for Males

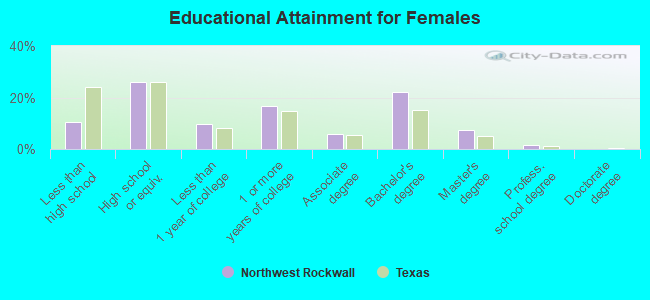
Education attainment for females 25 years and older:

  • No schooling: 9
  • Nursery to 4th grade: 3
  • 5th and 6th grade: 86
  • 7th and 8th grade: 117
  • 9th grade: 135
  • 10th grade: 107
  • 11th grade: 85
  • 12th grade, no diploma: 245
  • High school graduate (or equivalency): 1,910
  • Less than 1 year of college: 713
  • Some college more than 1 year, no degree: 1,242
  • Associate degree: 430
  • Bachelor's degree: 1,621
  • Master's degree: 547
  • Professional school degree: 121
  • Doctorate degree: 5
Educational Attainment for Females
Northwest Rockwall marital status for males
Northwest Rockwall marital status for females

Housing units in structures:

  • One, detached: 6,544
  • One, attached: 261
  • Two: 56
  • 3 or 4: 74
  • 5 to 9: 311
  • 10 to 19: 182
  • 20 to 49: 61
  • 50 or more: 136
  • Mobile homes: 176

Median worth of mobile homes: $113,844

Housing units lacking complete plumbing facilities: 0.5%

Housing units lacking complete kitchen facilities: 0.2%
Year householders moved into residence in Northwest Rockwall
Houses and condos Apartments
Most commonly used house heating fuel in houses and condos in Northwest Rockwall, TX
  • 59.5%Utility gas
  • 39.4%Electricity
  • 1.1%Bottled, tank, or LP gas
Most commonly used house heating fuel in apartments in Northwest Rockwall, TX
  • 73.9%Electricity
  • 22.6%Utility gas
  • 2.8%Bottled, tank, or LP gas
  • 0.7%Wood

Private vs. public school enrollment:

Students in private schools in grades 1 to 8 (elementary and middle school): 262
Here:

8.3%
Texas:

6.8%

Students in private schools in grades 9 to 12 (high school): 74
Here:

5.4%
Texas:

6.2%

Students in private undergraduate colleges: 175
Here:

20.0%
Texas:

15.4%
School Enrollment by Level of School for Male Students
School Enrollment by Level of School for Female Students
Age and Sex of Sensory-Disabled Noninstitutionalized Residents
Age and Sex of Physically-Disabled Noninstitutionalized Residents
Age and Sex of Mentally-Disabled Noninstitutionalized Residents
Age and Sex of Self-Care Disabled Noninstitutionalized Residents
Age and Sex of Go-Outside-Home Disabled Noninstitutionalized Residents
Age and Sex of Noninstitutionalized Residents with Employment Disability