Northwest Rockwall, Texas (TX) income map, earnings map, and wages data
The median household income in Northwest Rockwall, TX in 2022 was $128,549, which was 43.8% greater than the median annual income of $72,284 across the entire state of Texas. Compared to the median income of $67,682 in 2000 this represents an increase of 47.3%. The per capita income in 2022 was $49,621, which means an increase of 44.1% compared to 2000 when it was $27,763.
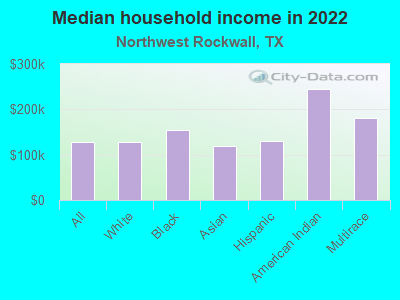
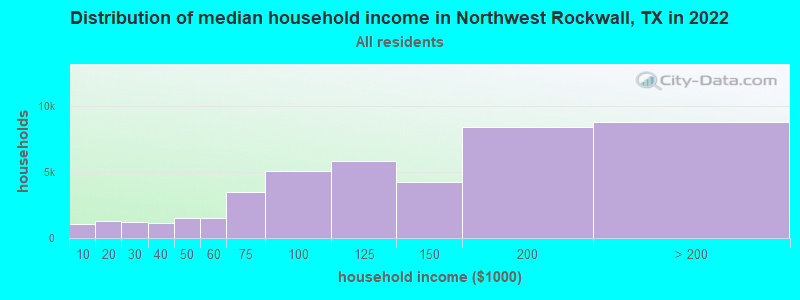
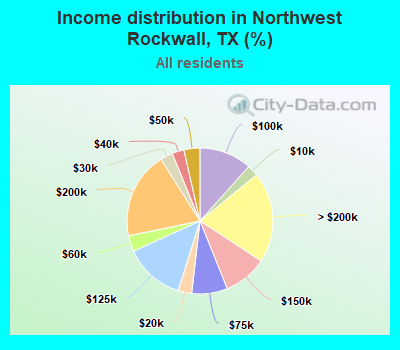
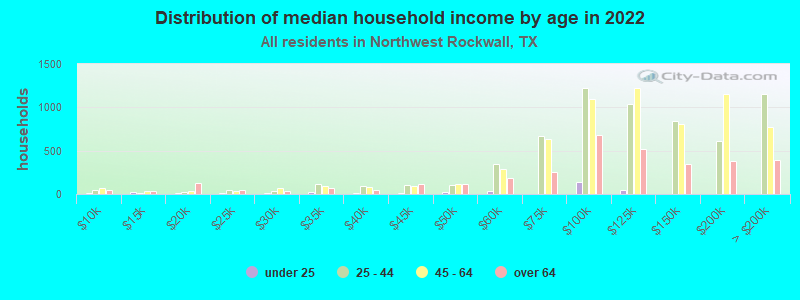
Income statistics for all residents
Median household income in Northwest Rockwall, TX in 2022:| Northwest Rockwall: | $128,549 |
| State: | $72,284 |
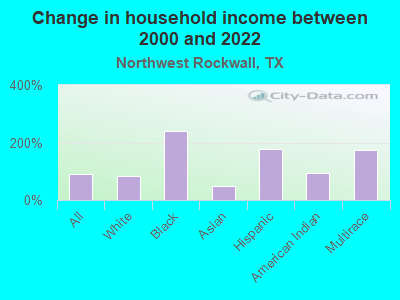
Change in median household income between 2000 and 2022:| Northwest Rockwall, Texas: | +89.9% |
| Texas: | +81.0% |
Number of households with income < $10k:| Northwest Rockwall: | 2.5% (1,073) |
| State: | 5.5% (611,011) |
Number of households with income $10k - 20k:| Northwest Rockwall: | 3.0% (1,314) |
| State: | 6.7% (743,157) |
Number of households with income $20k - 30k:| Northwest Rockwall: | 2.8% (1,208) |
| State: | 7.2% (803,381) |
Number of households with income $30k - 40k:| Northwest Rockwall: | 2.7% (1,158) |
| State: | 7.8% (866,080) |
Number of households with income $40k - 50k:| Northwest Rockwall: | 3.5% (1,533) |
| Texas: | 7.3% (810,440) |
Number of households with income $50k - 60k:| Northwest Rockwall: | 3.5% (1,542) |
| State: | 7.2% (799,783) |
Number of households with income $60k - 75k:| Northwest Rockwall: | 7.9% (3,446) |
| Texas: | 9.9% (1,095,384) |
Number of households with income $75k - 100k:| Northwest Rockwall: | 11.6% (5,074) |
| State: | 12.8% (1,419,057) |
Number of households with income $100k - 125k:| Northwest Rockwall: | 13.4% (5,823) |
| State: | 9.5% (1,054,577) |
Number of households with income $125k - 150k:| Northwest Rockwall: | 9.7% (4,228) |
| State: | 6.7% (741,518) |
Number of households with income $150k - 200k:| Northwest Rockwall: | 19.3% (8,409) |
| State: | 8.7% (961,776) |
Number of households with income > $200k:| Northwest Rockwall: | 20.1% (8,768) |
| Texas: | 10.7% (1,181,544) |
Aggregate household income in Northwest Rockwall in 2022: $3,043,507,614
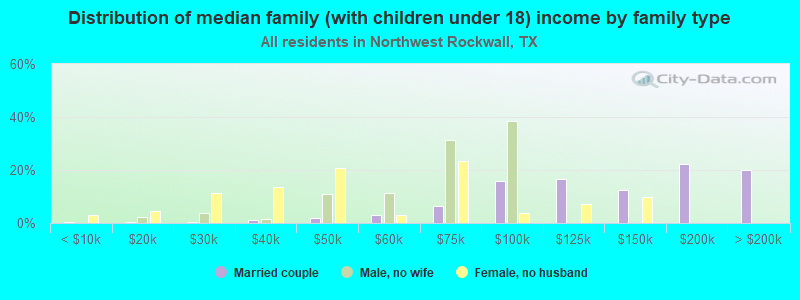
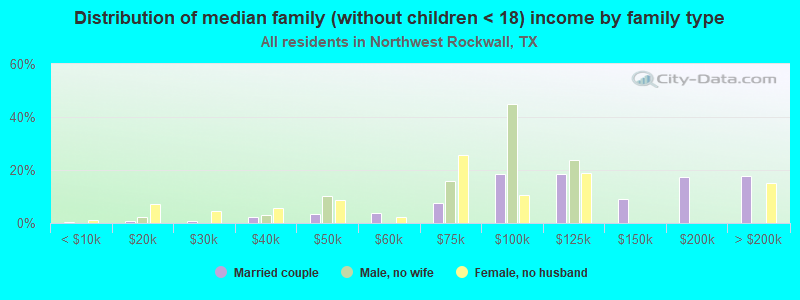
Median family income in Northwest Rockwall in 2022:| Northwest Rockwall: | $142,497 |
| State: | $86,267 |
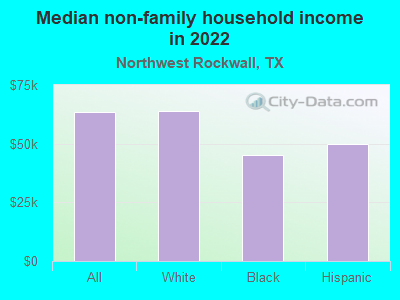
Median non-family income in Northwest Rockwall in 2022:| Northwest Rockwall: | $63,486 |
| State: | $45,999 |
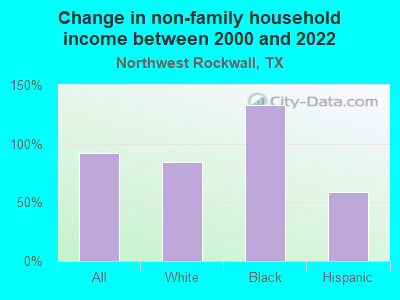
Change in median non-family income between 2000 and 2022:| Northwest Rockwall, Texas: | +92.4% |
| Texas: | +79.5% |
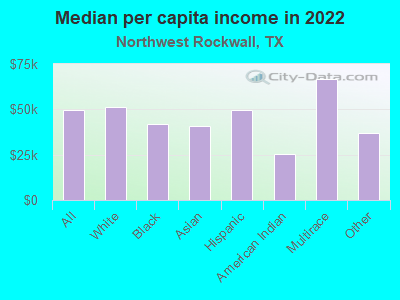
Median per capita income in Northwest Rockwall in 2022:| Northwest Rockwall: | $49,621 |
| State: | $38,123 |
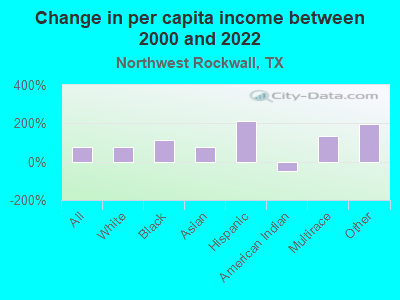
Change in median per capita income between 2000 and 2022:| Northwest Rockwall, Texas: | +78.7% |
| Texas: | +94.3% |
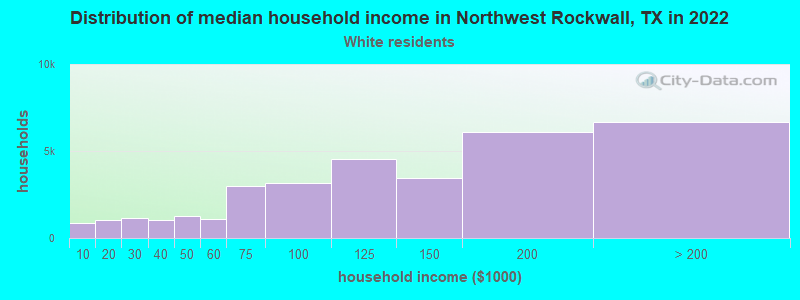
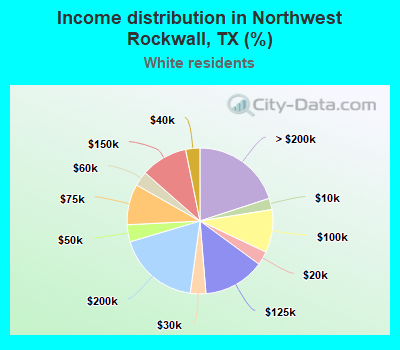
Income statistics for White residents
Median household income in Northwest Rockwall, TX in 2022:| Northwest Rockwall: | $127,569 |
| Texas: | $82,032 |
Change in median household income between 2000 and 2022:| Northwest Rockwall, Texas: | +84.2% |
| Texas: | +91.0% |
Number of households with income < $10k:| Northwest Rockwall: | 2.5% (839) |
| State: | 4.7% (273,716) |
Number of households with income $10k - 20k:| Northwest Rockwall: | 3.0% (1,013) |
| Texas: | 5.5% (322,702) |
Number of households with income $20k - 30k:| Northwest Rockwall: | 3.4% (1,151) |
| Texas: | 6.2% (363,947) |
Number of households with income $30k - 40k:| Northwest Rockwall: | 3.2% (1,053) |
| State: | 6.8% (399,275) |
Number of households with income $40k - 50k:| Northwest Rockwall: | 3.8% (1,262) |
| State: | 6.5% (383,417) |
Number of households with income $50k - 60k:| Northwest Rockwall: | 3.3% (1,091) |
| Texas: | 6.6% (388,535) |
Number of households with income $60k - 75k:| Northwest Rockwall: | 9.0% (3,019) |
| State: | 9.7% (566,295) |
Number of households with income $75k - 100k:| Northwest Rockwall: | 9.5% (3,182) |
| Texas: | 13.0% (760,276) |
Number of households with income $100k - 125k:| Northwest Rockwall: | 13.6% (4,552) |
| Texas: | 10.2% (597,596) |
Number of households with income $125k - 150k:| Northwest Rockwall: | 10.4% (3,457) |
| Texas: | 7.4% (436,830) |
Number of households with income $150k - 200k:| Northwest Rockwall: | 18.3% (6,093) |
| Texas: | 9.9% (583,067) |
Number of households with income > $200k:| Northwest Rockwall: | 20.0% (6,674) |
| State: | 13.5% (792,647) |
Aggregate household income in Northwest Rockwall in 2022: $2,307,995,665
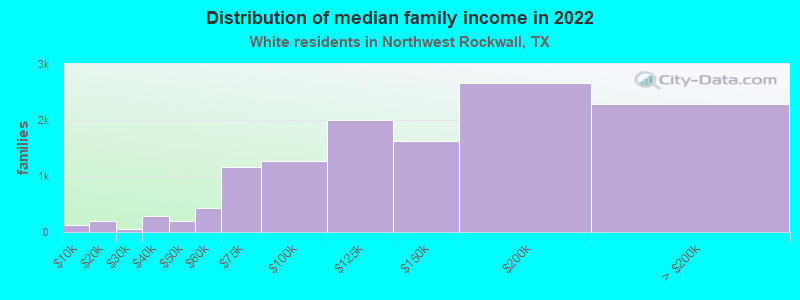
Median family income in Northwest Rockwall in 2022:| Northwest Rockwall: | $145,023 |
| State: | $101,788 |
Number of families with income < $10k:| Northwest Rockwall: | 1.0% (121) |
| State: | 2.8% (108,142) |
Number of families with income $10k - 20k:| Northwest Rockwall: | 1.6% (193) |
| State: | 2.9% (113,421) |
Number of families with income $20k - 30k:| Northwest Rockwall: | 0.5% (60) |
| State: | 4.1% (157,688) |
Number of families with income $30k - 40k:| Northwest Rockwall: | 2.3% (281) |
| State: | 5.2% (198,847) |
Number of families with income $40k - 50k:| Northwest Rockwall: | 1.7% (204) |
| State: | 5.6% (216,490) |
Number of families with income $50k - 60k:| Northwest Rockwall: | 3.5% (433) |
| State: | 5.7% (220,689) |
Number of families with income $60k - 75k:| Northwest Rockwall: | 9.4% (1,153) |
| Texas: | 9.0% (346,106) |
Number of families with income $75k - 100k:| Northwest Rockwall: | 10.3% (1,272) |
| State: | 13.7% (527,363) |
Number of families with income $100k - 125k:| Northwest Rockwall: | 16.3% (2,001) |
| State: | 11.6% (448,411) |
Number of families with income $125k - 150k:| Northwest Rockwall: | 13.2% (1,628) |
| State: | 9.2% (355,798) |
Number of families with income $150k - 200k:| Northwest Rockwall: | 21.7% (2,666) |
| State: | 12.5% (480,185) |
Number of families with income > $200k:| Northwest Rockwall: | 18.6% (2,282) |
| Texas: | 17.6% (677,490) |
Median non-family income in Northwest Rockwall in 2022:| Northwest Rockwall: | $63,779 |
| State: | $50,587 |
Change in median non-family income between 2000 and 2022:| Northwest Rockwall, Texas: | +83.6% |
| State: | +87.7% |
Median per capita income in Northwest Rockwall in 2022:| Northwest Rockwall: | $51,145 |
| State: | $47,740 |
Change in median per capita income between 2000 and 2022:| Northwest Rockwall, Texas: | +79.1% |
| State: | +114.3% |
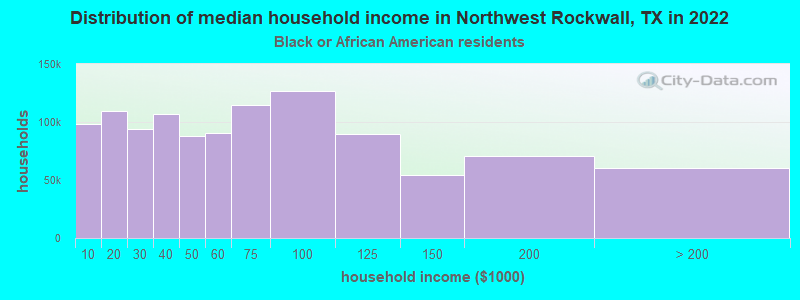
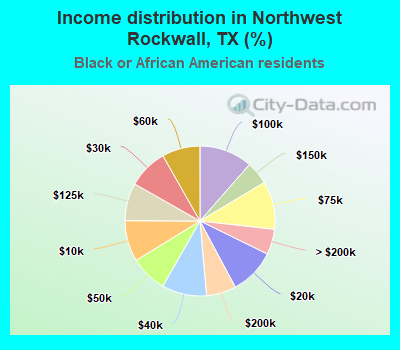
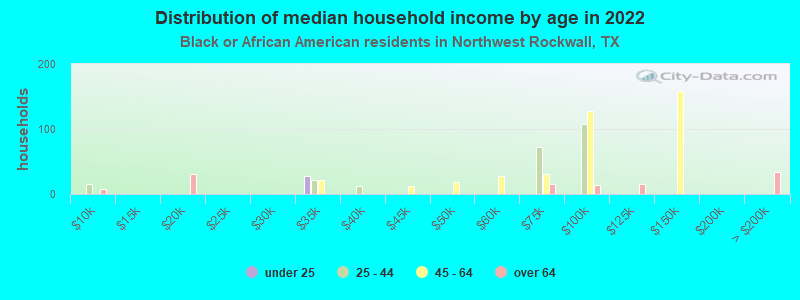
Income statistics for Black or African American residents
Median household income in Northwest Rockwall, TX in 2022:| Northwest Rockwall: | $155,006 |
| State: | $55,759 |
Number of households with income < $10k:| Northwest Rockwall: | 8.9% (98,019) |
| Texas: | 8.9% (126,378) |
Number of households with income $10k - 20k:| Northwest Rockwall: | 9.9% (109,584) |
| State: | 9.9% (140,369) |
Number of households with income $20k - 30k:| Northwest Rockwall: | 8.5% (94,280) |
| State: | 8.5% (120,639) |
Number of households with income $30k - 40k:| Northwest Rockwall: | 9.7% (106,594) |
| State: | 9.7% (137,517) |
Number of households with income $40k - 50k:| Northwest Rockwall: | 7.9% (87,570) |
| State: | 8.0% (112,973) |
Number of households with income $50k - 60k:| Northwest Rockwall: | 8.2% (90,738) |
| State: | 8.3% (117,156) |
Number of households with income $60k - 75k:| Northwest Rockwall: | 10.4% (114,543) |
| State: | 10.4% (147,462) |
Number of households with income $75k - 100k:| Northwest Rockwall: | 11.5% (126,475) |
| State: | 11.5% (162,718) |
Number of households with income $100k - 125k:| Northwest Rockwall: | 8.1% (89,798) |
| Texas: | 8.2% (115,829) |
Number of households with income $125k - 150k:| Northwest Rockwall: | 4.9% (54,416) |
| Texas: | 4.9% (69,556) |
Number of households with income $150k - 200k:| Northwest Rockwall: | 6.4% (70,478) |
| Texas: | 6.4% (90,701) |
Number of households with income > $200k:| Northwest Rockwall: | 5.5% (60,549) |
| State: | 5.5% (77,988) |
Aggregate household income in Northwest Rockwall in 2022: $278,321,762
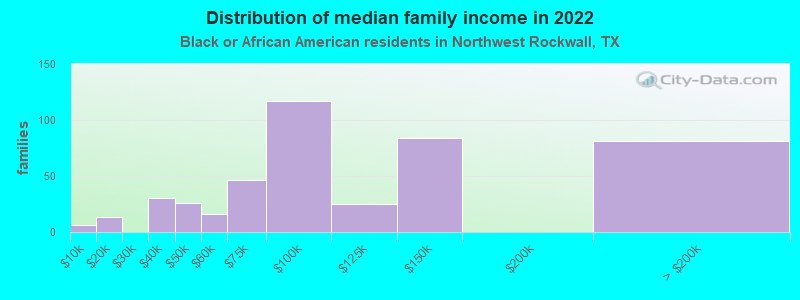
Median family income in Northwest Rockwall in 2022:| Northwest Rockwall: | $144,720 |
| Texas: | $69,134 |
Number of families with income < $10k:| Northwest Rockwall: | 1.3% (6) |
| State: | 6.8% (55,625) |
Number of families with income $10k - 20k:| Northwest Rockwall: | 2.9% (13) |
| State: | 6.8% (55,300) |
Number of families with income $30k - 40k:| Northwest Rockwall: | 6.8% (30) |
| Texas: | 8.5% (68,776) |
Number of families with income $40k - 50k:| Northwest Rockwall: | 5.8% (26) |
| State: | 7.1% (57,907) |
Number of families with income $50k - 60k:| Northwest Rockwall: | 3.5% (16) |
| State: | 7.3% (59,511) |
Number of families with income $60k - 75k:| Northwest Rockwall: | 10.4% (46) |
| Texas: | 10.1% (81,994) |
Number of families with income $75k - 100k:| Northwest Rockwall: | 26.4% (117) |
| State: | 12.7% (103,723) |
Number of families with income $100k - 125k:| Northwest Rockwall: | 5.6% (25) |
| State: | 9.4% (76,609) |
Number of families with income $125k - 150k:| Northwest Rockwall: | 19.0% (84) |
| Texas: | 6.8% (55,615) |
Number of families with income > $200k:| Northwest Rockwall: | 18.2% (81) |
| State: | 7.9% (64,439) |
Median non-family income in Northwest Rockwall in 2022:| Northwest Rockwall: | $45,150 |
| Texas: | $40,133 |
Change in median non-family income between 2000 and 2022:| Northwest Rockwall, Texas: | +133.0% |
| State: | +102.2% |
Median per capita income in Northwest Rockwall in 2022:| Northwest Rockwall: | $41,680 |
| State: | $30,490 |
Change in median per capita income between 2000 and 2022:| Northwest Rockwall, Texas: | +115.3% |
| State: | +113.9% |
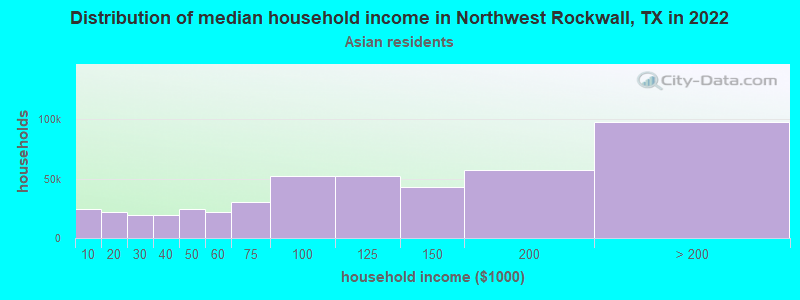
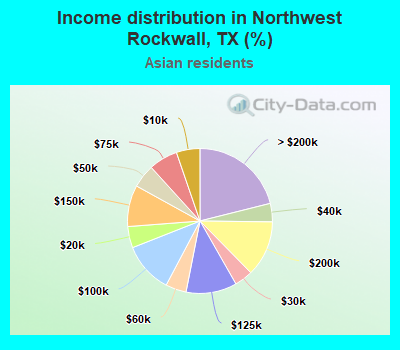
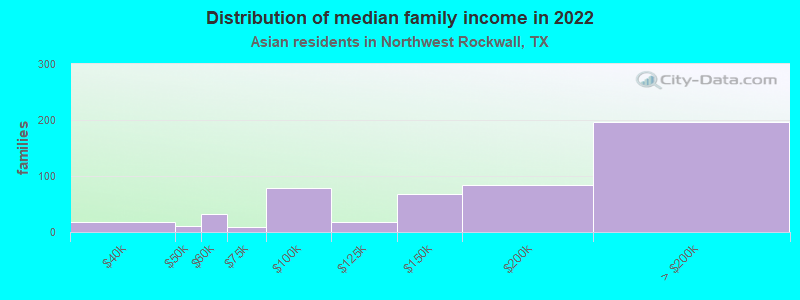
Income statistics for Asian residents
Median household income in Northwest Rockwall, TX in 2022:| Northwest Rockwall: | $118,984 |
| State: | $107,673 |
Change in median household income between 2000 and 2022:| Northwest Rockwall, Texas: | +46.6% |
| State: | +115.1% |
Number of households with income < $10k:| Northwest Rockwall: | 5.3% (24,258) |
| State: | 5.2% (29,885) |
Number of households with income $10k - 20k:| Northwest Rockwall: | 4.8% (21,950) |
| Texas: | 4.7% (27,044) |
Number of households with income $20k - 30k:| Northwest Rockwall: | 4.1% (18,917) |
| State: | 4.1% (23,363) |
Number of households with income $30k - 40k:| Northwest Rockwall: | 4.1% (18,912) |
| Texas: | 4.1% (23,309) |
Number of households with income $40k - 50k:| Northwest Rockwall: | 5.2% (24,177) |
| State: | 5.2% (29,826) |
Number of households with income $50k - 60k:| Northwest Rockwall: | 4.6% (21,445) |
| State: | 4.7% (26,512) |
Number of households with income $60k - 75k:| Northwest Rockwall: | 6.5% (29,952) |
| Texas: | 6.5% (36,905) |
Number of households with income $75k - 100k:| Northwest Rockwall: | 11.3% (52,083) |
| State: | 11.3% (64,350) |
Number of households with income $100k - 125k:| Northwest Rockwall: | 11.3% (52,416) |
| Texas: | 11.4% (64,714) |
Number of households with income $125k - 150k:| Northwest Rockwall: | 9.3% (42,731) |
| State: | 9.3% (52,719) |
Number of households with income $150k - 200k:| Northwest Rockwall: | 12.5% (57,521) |
| State: | 12.5% (70,953) |
Number of households with income > $200k:| Northwest Rockwall: | 21.1% (97,487) |
| State: | 21.1% (120,260) |
Aggregate household income in Northwest Rockwall in 2022: $101,311,935
Median family income in Northwest Rockwall in 2022:| Northwest Rockwall: | $94,460 |
| State: | $123,328 |
Number of families with income $30k - 40k:| Northwest Rockwall: | 3.4% (17) |
| Texas: | 3.4% (15,033) |
Number of families with income $40k - 50k:| Northwest Rockwall: | 2.0% (10) |
| State: | 4.9% (21,622) |
Number of families with income $50k - 60k:| Northwest Rockwall: | 6.2% (32) |
| State: | 4.7% (20,568) |
Number of families with income $60k - 75k:| Northwest Rockwall: | 1.8% (9) |
| State: | 6.1% (26,637) |
Number of families with income $75k - 100k:| Northwest Rockwall: | 15.3% (79) |
| State: | 10.7% (46,626) |
Number of families with income $100k - 125k:| Northwest Rockwall: | 3.5% (18) |
| State: | 11.3% (49,585) |
Number of families with income $125k - 150k:| Northwest Rockwall: | 13.1% (67) |
| State: | 9.8% (43,043) |
Number of families with income $150k - 200k:| Northwest Rockwall: | 16.4% (84) |
| Texas: | 14.7% (64,203) |
Number of families with income > $200k:| Northwest Rockwall: | 38.3% (197) |
| State: | 24.8% (108,511) |
Median per capita income in Northwest Rockwall in 2022:| Northwest Rockwall: | $40,960 |
| Texas: | $48,626 |
Change in median per capita income between 2000 and 2022:| Northwest Rockwall, Texas: | +75.5% |
| State: | +132.0% |
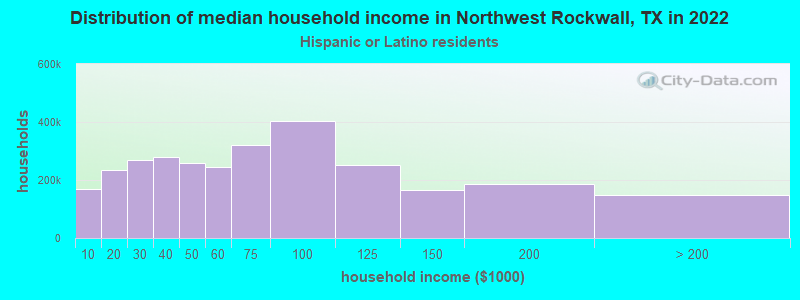
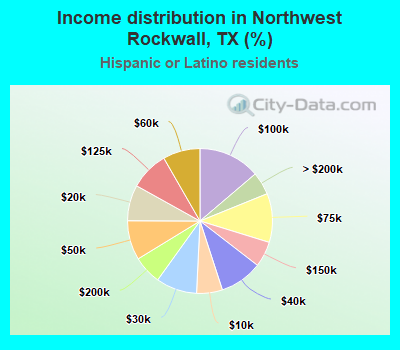
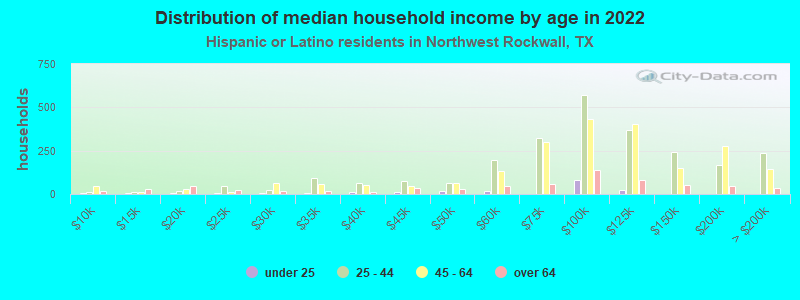
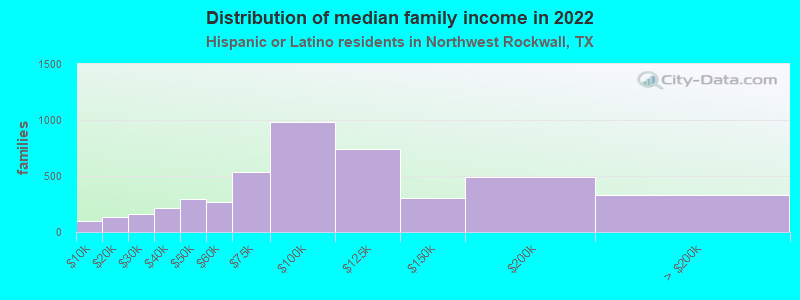
Income statistics for Hispanic or Latino residents
Median household income in Northwest Rockwall, TX in 2022:| Northwest Rockwall: | $131,236 |
| Texas: | $60,504 |
Number of households with income < $10k:| Northwest Rockwall: | 5.8% (168,657) |
| State: | 5.8% (213,953) |
Number of households with income $10k - 20k:| Northwest Rockwall: | 8.0% (234,562) |
| Texas: | 8.0% (297,456) |
Number of households with income $20k - 30k:| Northwest Rockwall: | 9.2% (268,003) |
| Texas: | 9.2% (340,166) |
Number of households with income $30k - 40k:| Northwest Rockwall: | 9.5% (279,420) |
| State: | 9.5% (354,336) |
Number of households with income $40k - 50k:| Northwest Rockwall: | 8.8% (257,698) |
| Texas: | 8.8% (327,013) |
Number of households with income $50k - 60k:| Northwest Rockwall: | 8.3% (243,218) |
| Texas: | 8.3% (308,818) |
Number of households with income $60k - 75k:| Northwest Rockwall: | 10.9% (319,335) |
| Texas: | 10.9% (405,109) |
Number of households with income $75k - 100k:| Northwest Rockwall: | 13.8% (403,488) |
| State: | 13.8% (511,639) |
Number of households with income $100k - 125k:| Northwest Rockwall: | 8.6% (252,161) |
| State: | 8.6% (319,728) |
Number of households with income $125k - 150k:| Northwest Rockwall: | 5.7% (166,500) |
| State: | 5.7% (210,932) |
Number of households with income $150k - 200k:| Northwest Rockwall: | 6.4% (185,949) |
| Texas: | 6.4% (236,055) |
Number of households with income > $200k:| Northwest Rockwall: | 5.1% (149,291) |
| State: | 5.1% (189,259) |
Aggregate household income in Northwest Rockwall in 2022: $310,279,322
Median family income in Northwest Rockwall in 2022:| Northwest Rockwall: | $138,101 |
| Texas: | $65,080 |
Number of families with income < $10k:| Northwest Rockwall: | 2.2% (99) |
| Texas: | 5.3% (147,493) |
Number of families with income $10k - 20k:| Northwest Rockwall: | 3.0% (136) |
| Texas: | 6.3% (174,531) |
Number of families with income $20k - 30k:| Northwest Rockwall: | 3.6% (165) |
| Texas: | 8.6% (238,528) |
Number of families with income $30k - 40k:| Northwest Rockwall: | 4.7% (213) |
| State: | 9.1% (251,999) |
Number of families with income $40k - 50k:| Northwest Rockwall: | 6.5% (298) |
| State: | 8.6% (240,188) |
Number of families with income $50k - 60k:| Northwest Rockwall: | 5.9% (269) |
| State: | 8.0% (223,566) |
Number of families with income $60k - 75k:| Northwest Rockwall: | 11.8% (540) |
| State: | 10.9% (302,688) |
Number of families with income $75k - 100k:| Northwest Rockwall: | 21.5% (982) |
| State: | 14.3% (398,554) |
Number of families with income $100k - 125k:| Northwest Rockwall: | 16.2% (740) |
| Texas: | 9.5% (264,007) |
Number of families with income $125k - 150k:| Northwest Rockwall: | 6.6% (300) |
| State: | 6.2% (171,274) |
Number of families with income $150k - 200k:| Northwest Rockwall: | 10.8% (492) |
| State: | 7.3% (202,259) |
Number of families with income > $200k:| Northwest Rockwall: | 7.3% (332) |
| State: | 5.9% (165,129) |
Median non-family income in Northwest Rockwall in 2022:| Northwest Rockwall: | $50,010 |
| State: | $39,934 |
Change in median non-family income between 2000 and 2022:| Northwest Rockwall, Texas: | +58.8% |
| State: | +109.1% |
Median per capita income in Northwest Rockwall in 2022:| Northwest Rockwall: | $49,835 |
| State: | $24,862 |
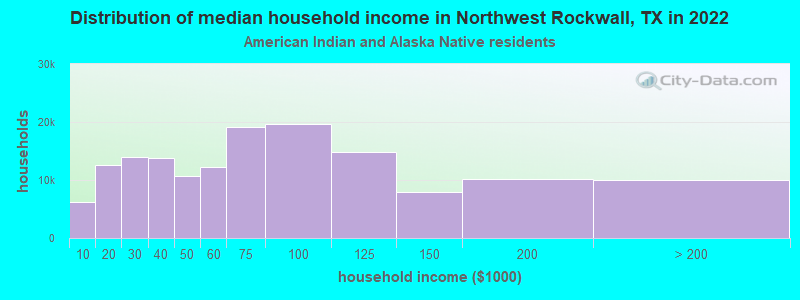
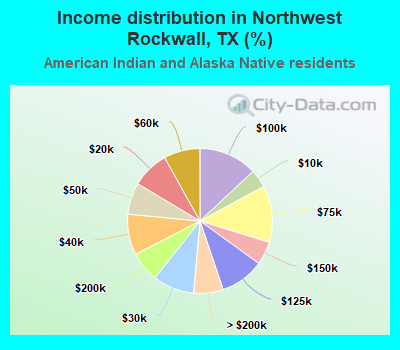
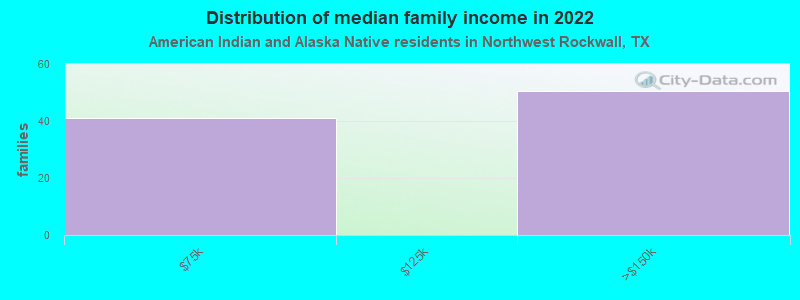
Income statistics for American Indian and Alaska Native residents
Median household income in Northwest Rockwall, TX in 2022:| Northwest Rockwall: | $243,806 |
| State: | $65,765 |
Change in median household income between 2000 and 2022:| Northwest Rockwall, Texas: | +93.7% |
| State: | +88.3% |
Number of households with income < $10k:| Northwest Rockwall: | 4.1% (6,133) |
| State: | 4.1% (3,398) |
Number of households with income $10k - 20k:| Northwest Rockwall: | 8.3% (12,540) |
| State: | 8.3% (6,949) |
Number of households with income $20k - 30k:| Northwest Rockwall: | 9.3% (13,974) |
| State: | 9.3% (7,742) |
Number of households with income $30k - 40k:| Northwest Rockwall: | 9.1% (13,750) |
| State: | 9.1% (7,627) |
Number of households with income $40k - 50k:| Northwest Rockwall: | 7.1% (10,698) |
| Texas: | 7.1% (5,922) |
Number of households with income $50k - 60k:| Northwest Rockwall: | 8.1% (12,206) |
| State: | 8.1% (6,761) |
Number of households with income $60k - 75k:| Northwest Rockwall: | 12.7% (19,102) |
| State: | 12.7% (10,588) |
Number of households with income $75k - 100k:| Northwest Rockwall: | 13.0% (19,683) |
| State: | 13.0% (10,903) |
Number of households with income $100k - 125k:| Northwest Rockwall: | 9.9% (14,903) |
| Texas: | 9.9% (8,256) |
Number of households with income $125k - 150k:| Northwest Rockwall: | 5.2% (7,855) |
| State: | 5.2% (4,355) |
Number of households with income $150k - 200k:| Northwest Rockwall: | 6.7% (10,138) |
| State: | 6.7% (5,623) |
Number of households with income > $200k:| Northwest Rockwall: | 6.6% (9,953) |
| State: | 6.6% (5,522) |
Aggregate household income in Northwest Rockwall in 2022: $8,863,588
Median family income in Northwest Rockwall in 2022:| Northwest Rockwall: | $135,272 |
| State: | $72,369 |
Number of families with income $60k - 75k:| Northwest Rockwall: | 44.9% (41) |
| State: | 12.1% (7,429) |
Number of families with income $125k - 150k:| Northwest Rockwall: | 55.1% (51) |
| State: | 7.5% (4,609) |
Median per capita income in Northwest Rockwall in 2022:| Northwest Rockwall: | $25,629 |
| State: | $28,166 |
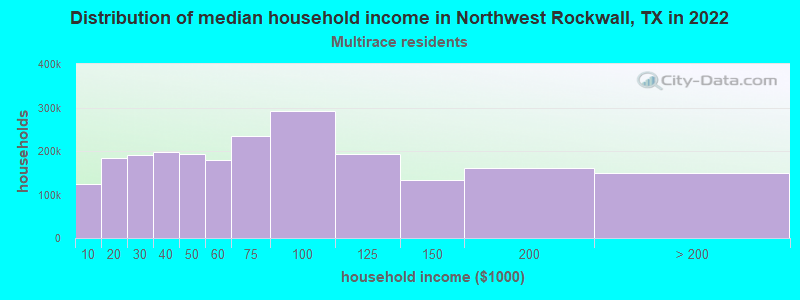
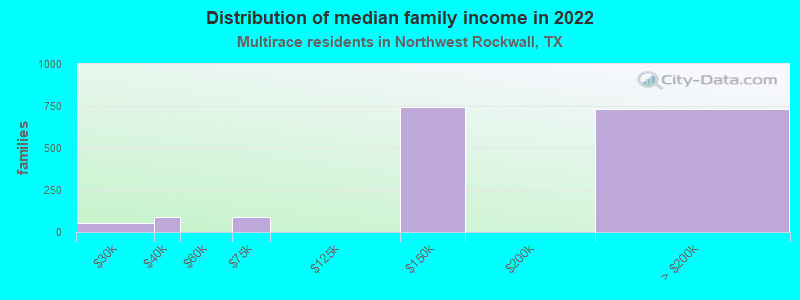
Income statistics for Multirace residents
Median household income in Northwest Rockwall, TX in 2022:| Northwest Rockwall: | $180,082 |
| Texas: | $62,748 |
Number of households with income < $10k:| Northwest Rockwall: | 5.5% (123,119) |
| Texas: | 5.5% (122,324) |
Number of households with income $10k - 20k:| Northwest Rockwall: | 8.2% (183,419) |
| State: | 8.2% (182,232) |
Number of households with income $20k - 30k:| Northwest Rockwall: | 8.5% (190,492) |
| Texas: | 8.5% (189,456) |
Number of households with income $30k - 40k:| Northwest Rockwall: | 8.9% (198,732) |
| State: | 8.9% (197,499) |
Number of households with income $40k - 50k:| Northwest Rockwall: | 8.7% (193,034) |
| State: | 8.7% (191,735) |
Number of households with income $50k - 60k:| Northwest Rockwall: | 8.0% (178,540) |
| State: | 8.0% (177,535) |
Number of households with income $60k - 75k:| Northwest Rockwall: | 10.5% (234,014) |
| State: | 10.5% (232,479) |
Number of households with income $75k - 100k:| Northwest Rockwall: | 13.1% (292,269) |
| Texas: | 13.1% (290,448) |
Number of households with income $100k - 125k:| Northwest Rockwall: | 8.7% (192,882) |
| State: | 8.6% (191,595) |
Number of households with income $125k - 150k:| Northwest Rockwall: | 6.0% (134,348) |
| State: | 6.0% (133,361) |
Number of households with income $150k - 200k:| Northwest Rockwall: | 7.2% (160,015) |
| State: | 7.2% (159,195) |
Number of households with income > $200k:| Northwest Rockwall: | 6.7% (148,984) |
| State: | 6.7% (148,064) |
Aggregate household income in Northwest Rockwall in 2022: $359,186,261
Median family income in Northwest Rockwall in 2022:| Northwest Rockwall: | $295,638 |
| Texas: | $69,780 |
Number of families with income $20k - 30k:| Northwest Rockwall: | 3.0% (51) |
| State: | 7.8% (126,627) |
Number of families with income $30k - 40k:| Northwest Rockwall: | 5.4% (92) |
| State: | 8.5% (137,626) |
Number of families with income $60k - 75k:| Northwest Rockwall: | 5.1% (87) |
| Texas: | 10.5% (169,549) |
Number of families with income $125k - 150k:| Northwest Rockwall: | 43.5% (742) |
| State: | 6.7% (107,900) |
Number of families with income > $200k:| Northwest Rockwall: | 43.0% (734) |
| Texas: | 7.9% (127,299) |
Median per capita income in Northwest Rockwall in 2022:| Northwest Rockwall: | $66,662 |
| State: | $26,785 |
Change in median per capita income between 2000 and 2022:| Northwest Rockwall, Texas: | +135.7% |
| State: | +110.9% |
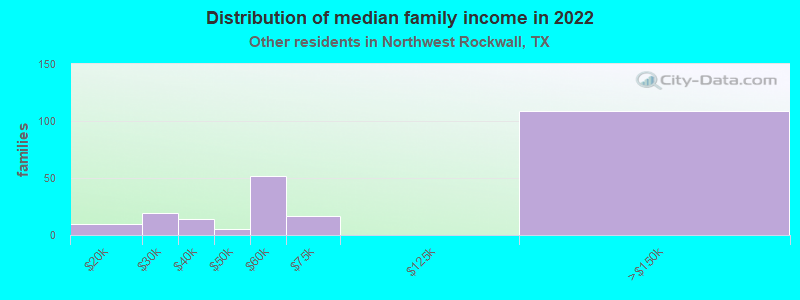
Income statistics for other residents
Number of households with income < $10k:| Northwest Rockwall: | 5.9% (73) |
| Texas: | 5.9% (54,162) |
Number of households with income $10k - 20k:| Northwest Rockwall: | 6.8% (84) |
| State: | 6.8% (62,891) |
Number of households with income $20k - 30k:| Northwest Rockwall: | 10.6% (130) |
| Texas: | 10.6% (97,294) |
Number of households with income $30k - 40k:| Northwest Rockwall: | 10.8% (133) |
| State: | 10.8% (99,670) |
Number of households with income $40k - 50k:| Northwest Rockwall: | 9.3% (115) |
| State: | 9.3% (85,548) |
Number of households with income $50k - 60k:| Northwest Rockwall: | 9.0% (111) |
| State: | 9.0% (82,757) |
Number of households with income $60k - 75k:| Northwest Rockwall: | 11.0% (135) |
| State: | 10.9% (100,326) |
Number of households with income $75k - 100k:| Northwest Rockwall: | 14.0% (173) |
| State: | 14.0% (128,767) |
Number of households with income $100k - 125k:| Northwest Rockwall: | 8.2% (101) |
| State: | 8.2% (75,218) |
Number of households with income $125k - 150k:| Northwest Rockwall: | 4.8% (59) |
| Texas: | 4.8% (44,223) |
Number of households with income $150k - 200k:| Northwest Rockwall: | 5.6% (69) |
| Texas: | 5.6% (51,376) |
Number of households with income > $200k:| Northwest Rockwall: | 4.0% (49) |
| State: | 4.0% (36,393) |
Aggregate household income in Northwest Rockwall in 2022: $40,882,309
Median family income in Northwest Rockwall in 2022:| Northwest Rockwall: | $110,033 |
| State: | $60,064 |
Number of families with income $10k - 20k:| Northwest Rockwall: | 4.6% (10) |
| Texas: | 6.0% (41,763) |
Number of families with income $20k - 30k:| Northwest Rockwall: | 8.4% (19) |
| Texas: | 9.9% (68,761) |
Number of families with income $30k - 40k:| Northwest Rockwall: | 6.3% (14) |
| Texas: | 9.7% (67,685) |
Number of families with income $40k - 50k:| Northwest Rockwall: | 2.4% (5) |
| State: | 9.0% (62,441) |
Number of families with income $50k - 60k:| Northwest Rockwall: | 22.7% (52) |
| Texas: | 8.5% (59,321) |
Number of families with income $60k - 75k:| Northwest Rockwall: | 7.5% (17) |
| Texas: | 11.2% (77,588) |
Number of families with income $125k - 150k:| Northwest Rockwall: | 48.1% (109) |
| State: | 5.1% (35,727) |
Median per capita income in Northwest Rockwall in 2022:| Northwest Rockwall: | $37,071 |
| State: | $23,899 |