Newark, DE (Delaware) Houses and Residents
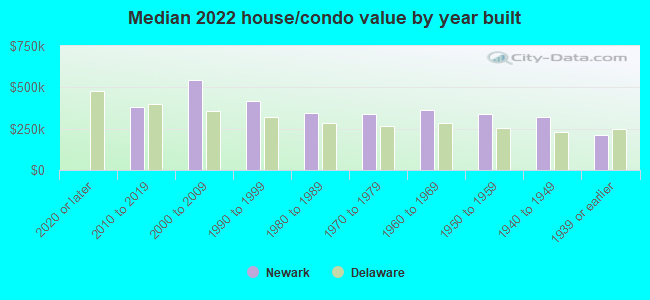
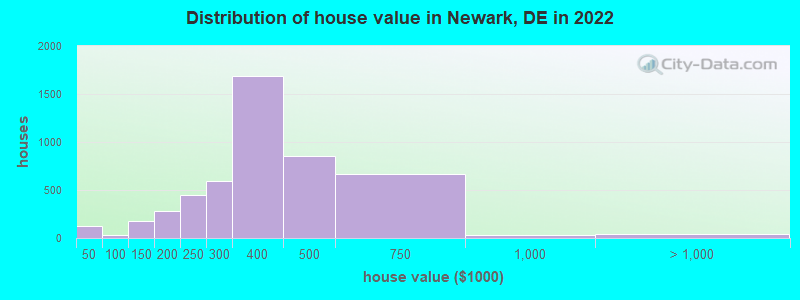
Estimated median house or condo value in 2022: $354,657 (it was $151,800 in 2000 )
Newark:
$354,657Delaware:
$337,200
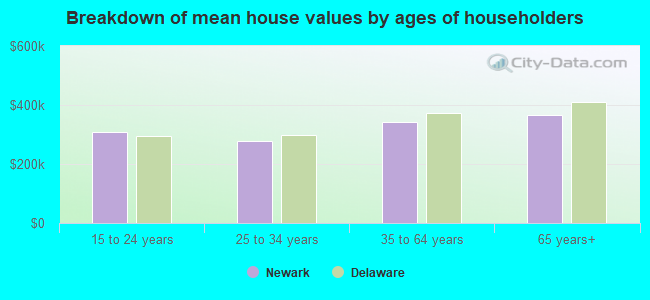
Lower value quartile - upper value quartile: $258,357 - $443,891Mean price in 2022: Detached houses: $457,325 Here:
$457,325State:
$419,599
Townhouses or other attached units: $325,383 Here:
$325,383State:
$291,415
In 5-or-more-unit structures: $244,838 Here:
$244,838State:
$212,751
Total population: 33,008 (Urban population: 28,570, Rural population: 0)
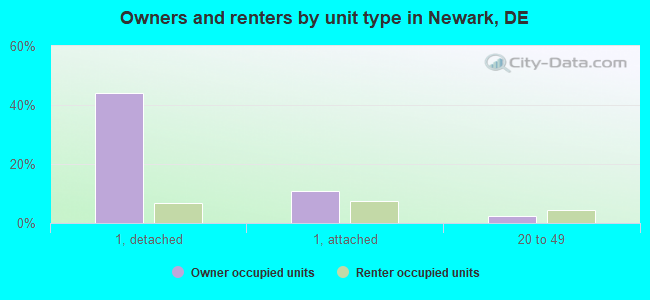
Houses: 10,690 (9,304 occupied: 4,866 owner occupied, 4,472 renter occupied )
% of renters here:
48%State:
26%
Housing density: 1,198 houses/condos per square mile
Median price asked for vacant for-sale houses and condos in 2022: $175,808.
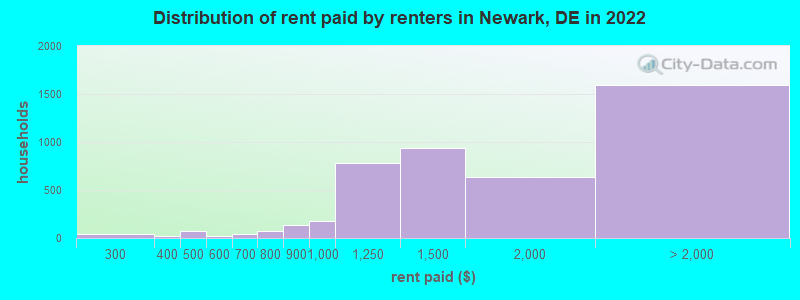
Median contract rent in 2022: $1,386 (lower quartile is $1,117, upper quartile is $1,954)
Median rent asked for vacant for-rent units in 2022: $1,283
Median gross rent in Newark, DE in 2022: $1,469
Housing units in Newark with a mortgage: 3,031 (498 second mortgage, 12 home equity loan, 419 both second mortgage and home equity loan )Houses without a mortgage: 138
Median household income for houses/condos with a mortgage: $115,906
Median household income for apartments without a mortgage: $82,761
Median monthly housing costs: $1,377
Data:
Median house or condo value ($)
Median house or condo value ($ change since 2000)
Median house or condo value ($) - White
Median house or condo value ($) - Black or African American
Median house or condo value ($) - Asian
Median house or condo value ($) - Hispanic or Latino
Median house or condo value ($) - American Indian and Alaska Native
Median house or condo value ($) - Multirace
Median house or condo value ($) - Other Race
Median price asked for mobile homes ($)
Household density (households per square mile)
Mean house or condo value by units in structure - 1, detached ($)
Mean house or condo value by units in structure - 1, attached ($)
Mean house or condo value by units in structure - 2 ($)
Mean house or condo value by units in structure by units in structure - 3 or 4 ($)
Mean house or condo value by units in structure - 5 or more ($)
Mean house or condo value by units in structure - Boat, RV, van, etc. ($)
Mean house or condo value by units in structure - Mobile home ($)
Median contract rent ($)
Median contract rent - Lower quartile ($)
Median contract rent - Upper quartile ($)
Median gross rent ($)
Urban houses (%)
Rural houses (%)
Houses occupied (%)
Houses occupied (% change since 2000)
Houses owner occupied (%)
Houses owner occupied (% change since 2000)
Houses renter occupied (%)
Houses renter occupied (% change since 2000)
Vacant housing units - For rent (%)
Vacant housing units - For rent (% change since 2000)
Vacant housing units - For sale only (%)
Vacant housing units - For sale only (% change since 2000)
Vacant housing units - Rented or sold, not occupied (%)
Vacant housing units - Rented or sold, not occupied (% change since 2000)
Vacant housing units - For seasonal, recreational, or occasional use (%)
Vacant housing units - For seasonal, recreational, or occasional use (% change since 2000)
Vacant housing units - For migrant workers (%)
Vacant housing units - For migrant workers (% change since 2000)
Vacant housing units - Other vacant (%)
Vacant housing units - Other vacant (% change since 2000)
Median monthly housing costs ($)
Median household income for houses/condos with a mortgage ($)
Median household income for houses/condos without a mortgage ($)
Median household income ($)
Median household income ($) - White
Median household income ($) - Black or African American
Median household income ($) - Asian
Median household income ($) - Hispanic or Latino
Median household income ($) - American Indian and Alaska Native
Median household income ($) - Multirace
Median household income ($) - Other Race
Mortgage status - with mortgage (%)
Mortgage status - with second mortgage (%)
Mortgage status - with home equity loan (%)
Mortgage status - with both second mortgage and home equity loan (%)
Mortgage status - without a mortgage (%)
Median year house/condo built
Median year apartment built
Household type by relationship - Male householder living alone (%)
Household type by relationship - Male householder not living alone (%)
Household type by relationship - Female householder living alone (%)
Household type by relationship - Female householder not living alone (%)
Household type by relationship - Opposite-Sex spouse (%)
Household type by relationship - Same-Sex spouse (%)
Household type by relationship - Opposite-Sex unmarried partner (%)
Household type by relationship - Same-Sex unmarried partner (%)
Household type by relationship - In group quarters (%)
Size of family households - 2-person household (%)
Size of family households - 3-person household (%)
Size of family households - 4-person household (%)
Size of family households - 5-person household (%)
Size of family households - 6-person household (%)
Size of family households - 7-or-more-person household (%)
Size of nonfamily households - 1-person household (%)
Size of nonfamily households - 2-person household (%)
Size of nonfamily households - 3-person household (%)
Size of nonfamily households - 4-person household (%)
Size of nonfamily households - 5-person household (%)
Size of nonfamily households - 6-person household (%)
Size of nonfamily households - 7-or-moreperson household (%)
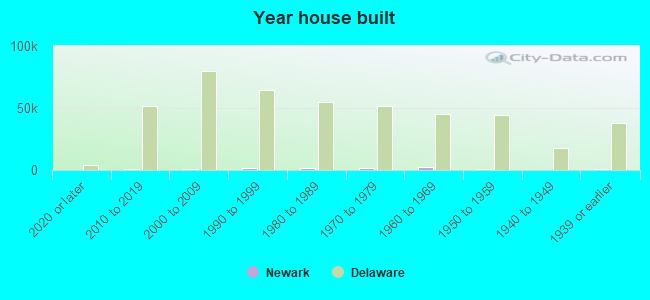
Year house built - Built 2010 or later (%)
Year house built - Built 2000 to 2009 (%)
Year house built - Built 1990 to 1999 (%)
Year house built - Built 1980 to 1989 (%)
Year house built - Built 1970 to 1979 (%)
Year house built - Built 1960 to 1969 (%)
Year house built - Built 1950 to 1959 (%)
Year house built - Built 1940 to 1949 (%)
Year house built - Built 1939 or earlier (%)
Median number of rooms in houses and condos
Median number of rooms in apartments
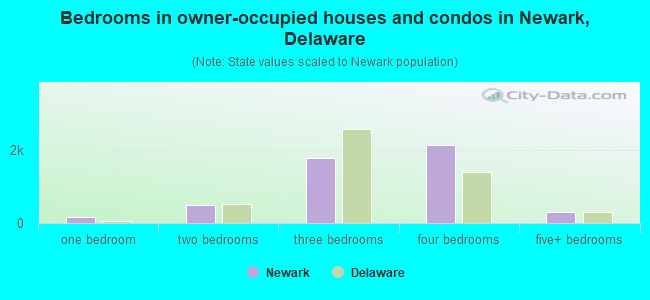
Median number of bedrooms in owner occupied houses
Mean number of bedrooms in owner occupied houses
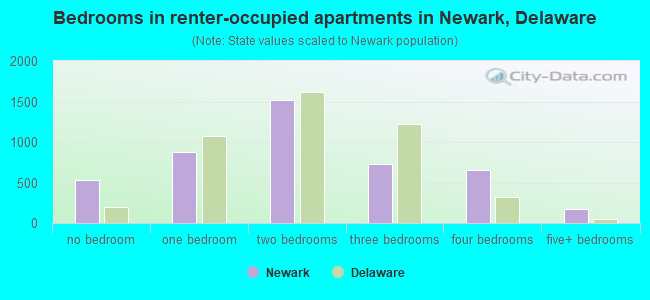
Median number of bedrooms in renter occupied houses
Mean number of bedrooms in renter occupied houses
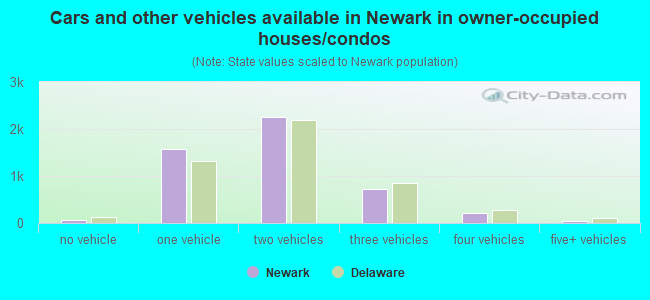
Median number of vehichles in owner occupied houses
Mean number of vehichles in owner occupied houses
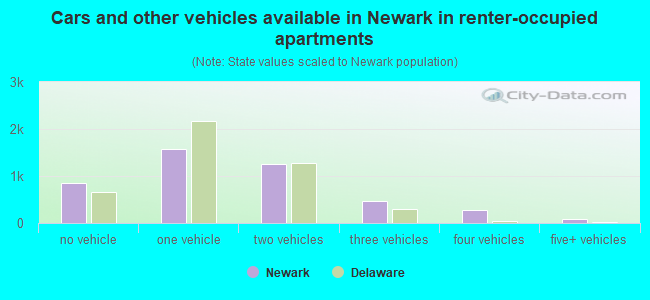
Median number of vehichles in renter occupied houses
Mean number of vehichles in renter occupied houses
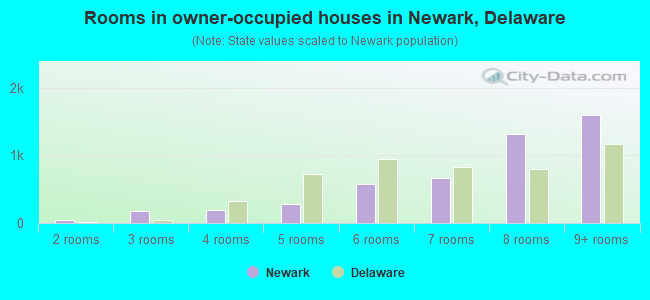
Rooms in owner-occupied houses - 1 room (%)
Rooms in owner-occupied houses - 2 rooms (%)
Rooms in owner-occupied houses - 3 rooms (%)
Rooms in owner-occupied houses - 4 rooms (%)
Rooms in owner-occupied houses - 5 rooms (%)
Rooms in owner-occupied houses - 6 rooms (%)
Rooms in owner-occupied houses - 7 rooms (%)
Rooms in owner-occupied houses - 8 rooms (%)
Rooms in owner-occupied houses - 9+ rooms (%)
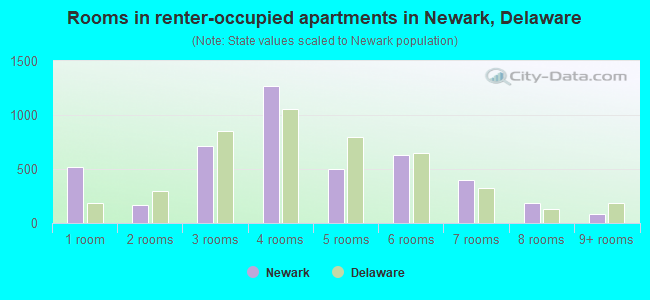
Rooms in renter-occupied houses - 1 room (%)
Rooms in renter-occupied houses - 2 rooms (%)
Rooms in renter-occupied houses - 3 rooms (%)
Rooms in renter-occupied houses - 4 rooms (%)
Rooms in renter-occupied houses - 5 rooms (%)
Rooms in renter-occupied houses - 6 rooms (%)
Rooms in renter-occupied houses - 7 rooms (%)
Rooms in renter-occupied houses - 8 rooms (%)
Rooms in renter-occupied houses - 9+ rooms (%)
Bedrooms in owner-occupied houses - no bedrooms (%)
Bedrooms in owner-occupied houses - 1 bedroom (%)
Bedrooms in owner-occupied houses - 2 bedrooms (%)
Bedrooms in owner-occupied houses - 3 bedrooms (%)
Bedrooms in owner-occupied houses - 4 bedrooms (%)
Bedrooms in owner-occupied houses - 5+ bedrooms (%)
Bedrooms in renter-occupied houses - no bedrooms (%)
Bedrooms in renter-occupied houses - 1 bedroom (%)
Bedrooms in renter-occupied houses - 2 bedrooms (%)
Bedrooms in renter-occupied houses - 3 bedrooms (%)
Bedrooms in renter-occupied houses - 4 bedrooms (%)
Bedrooms in renter-occupied houses - 5+ bedrooms (%)
Vehicles available in owner-occupied houses - no vehicle available (%)
Vehicles available in owner-occupied houses - 1 vehicle available(%)
Vehicles available in owner-occupied houses - 2 Vehicles available (%)
Vehicles available in owner-occupied houses - 3 Vehicles available (%)
Vehicles available in owner-occupied houses - 4 Vehicles available (%)
Vehicles available in owner-occupied houses - 5+ Vehicles available (%)
Vehicles available in renter-occupied houses - no vehicle available (%)
Vehicles available in renter-occupied houses - 1 vehicle available (%)
Vehicles available in renter-occupied houses - 2 Vehicles available (%)
Vehicles available in renter-occupied houses - 3 Vehicles available (%)
Vehicles available in renter-occupied houses - 4 Vehicles available (%)
Vehicles available in renter-occupied houses - 5+ Vehicles available (%)
Housing units in structures - 1, detached (%)
Housing units in structures - 1, attached (%)
Housing units in structures - 2 (%)
Housing units in structures - 3 or 4 (%)
Housing units in structures - 5 to 9 (%)
Housing units in structures - 10 to 19 (%)
Housing units in structures - 20 to 49 (%)
Housing units in structures - 50 or more (%)
Housing units in structures - Mobile home (%)
Housing units in structures - Boat, RV, van, etc. (%)
Housing units in structures - Owners - 1, detached (%)
Housing units in structures - Owners - 1, attached (%)
Housing units in structures - Owners - 2 (%)
Housing units in structures - Owners - 3 or 4 (%)
Housing units in structures - Owners - 5 to 9 (%)
Housing units in structures - Owners - 10 to 19 (%)
Housing units in structures - Owners - 20 to 49 (%)
Housing units in structures - Owners - 50 or more (%)
Housing units in structures - Owners - Mobile home (%)
Housing units in structures - Owners - Boat, RV, van, etc. (%)
Housing units in structures - Renters - 1, detached (%)
Housing units in structures - Renters - 1, attached (%)
Housing units in structures - Renters - 2 (%)
Housing units in structures - Renters - 3 or 4 (%)
Housing units in structures - Renters - 5 to 9 (%)
Housing units in structures - Renters - 10 to 19 (%)
Housing units in structures - Renters - 20 to 49 (%)
Housing units in structures - Renters - 50 or more (%)
Housing units in structures - Renters - Mobile home (%)
Housing units in structures - Renters - Boat, RV, van, etc. (%)
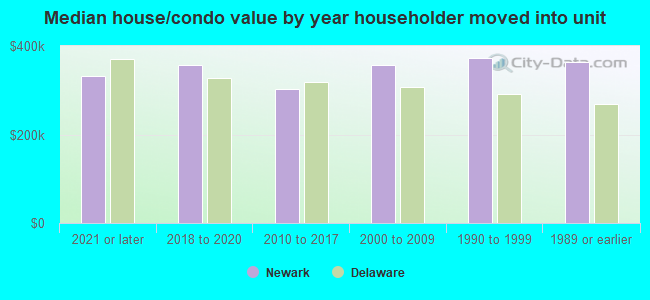
House/condo owner moved in on average (years ago)
Renter moved in on average (years ago)
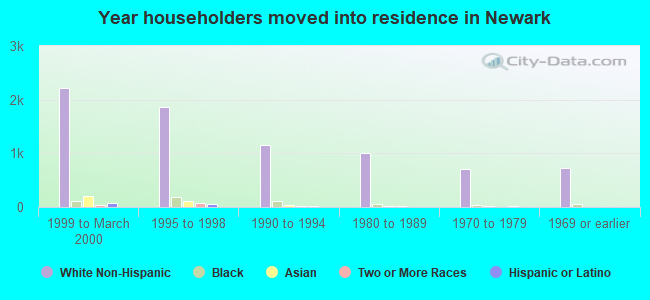
Year householder moved into unit - Moved in 1999 to March 2000 (%)
Year householder moved into unit - Moved in 1999 to March 2000 (%) - White
Year householder moved into unit - Moved in 1999 to March 2000 (%) - Black or African American
Year householder moved into unit - Moved in 1999 to March 2000 (%) - Asian
Year householder moved into unit - Moved in 1999 to March 2000 (%) - Hispanic or Latino
Year householder moved into unit - Moved in 1999 to March 2000 (%) - American Indian and Alaska Native
Year householder moved into unit - Moved in 1999 to March 2000 (%) - Multirace
Year householder moved into unit - Moved in 1999 to March 2000 (%) - Other Race
Year householder moved into unit - Moved in 1995 to 1998 (%)
Year householder moved into unit - Moved in 1995 to 1998 (%) - White
Year householder moved into unit - Moved in 1995 to 1998 (%) - Black or African American
Year householder moved into unit - Moved in 1995 to 1998 (%) - Asian
Year householder moved into unit - Moved in 1995 to 1998 (%) - Hispanic or Latino
Year householder moved into unit - Moved in 1995 to 1998 (%) - American Indian and Alaska Native
Year householder moved into unit - Moved in 1995 to 1998 (%) - Multirace
Year householder moved into unit - Moved in 1995 to 1998 (%) - Other Race
Year householder moved into unit - Moved in 1990 to 1994 (%)
Year householder moved into unit - Moved in 1990 to 1994 (%) - White
Year householder moved into unit - Moved in 1990 to 1994 (%) - Black or African American
Year householder moved into unit - Moved in 1990 to 1994 (%) - Asian
Year householder moved into unit - Moved in 1990 to 1994 (%) - Hispanic or Latino
Year householder moved into unit - Moved in 1990 to 1994 (%) - American Indian and Alaska Native
Year householder moved into unit - Moved in 1990 to 1994 (%) - Multirace
Year householder moved into unit - Moved in 1990 to 1994 (%) - Other Race
Year householder moved into unit - Moved in 1980 to 1989 (%)
Year householder moved into unit - Moved in 1980 to 1989 (%) - White
Year householder moved into unit - Moved in 1980 to 1989 (%) - Black or African American
Year householder moved into unit - Moved in 1980 to 1989 (%) - Asian
Year householder moved into unit - Moved in 1980 to 1989 (%) - Hispanic or Latino
Year householder moved into unit - Moved in 1980 to 1989 (%) - American Indian and Alaska Native
Year householder moved into unit - Moved in 1980 to 1989 (%) - Multirace
Year householder moved into unit - Moved in 1980 to 1989 (%) - Other Race
Year householder moved into unit - Moved in 1970 to 1979 (%)
Year householder moved into unit - Moved in 1970 to 1979 (%) - White
Year householder moved into unit - Moved in 1970 to 1979 (%) - Black or African American
Year householder moved into unit - Moved in 1970 to 1979 (%) - Asian
Year householder moved into unit - Moved in 1970 to 1979 (%) - Hispanic or Latino
Year householder moved into unit - Moved in 1970 to 1979 (%) - American Indian and Alaska Native
Year householder moved into unit - Moved in 1970 to 1979 (%) - Multirace
Year householder moved into unit - Moved in 1970 to 1979 (%) - Other Race
Year householder moved into unit - Moved in 1969 or earlier (%)
Year householder moved into unit - Moved in 1969 or earlier (%) - White
Year householder moved into unit - Moved in 1969 or earlier (%) - Black or African American
Year householder moved into unit - Moved in 1969 or earlier (%) - Asian
Year householder moved into unit - Moved in 1969 or earlier (%) - Hispanic or Latino
Year householder moved into unit - Moved in 1969 or earlier (%) - American Indian and Alaska Native
Year householder moved into unit - Moved in 1969 or earlier (%) - Multirace
Year householder moved into unit - Moved in 1969 or earlier (%) - Other Race
Housing units lacking complete plumbing facilities (%)
Housing units lacking complete kitchen facilities (%)
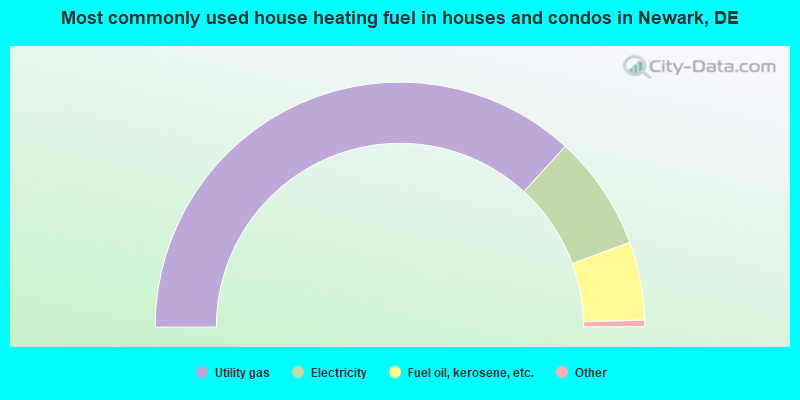
House heating fuel used in houses and condos - Utility gas (%)
House heating fuel used in houses and condos - Bottled, tank, or LP gas (%)
House heating fuel used in houses and condos - Electricity (%)
House heating fuel used in houses and condos - Fuel oil, kerosene, etc. (%)
House heating fuel used in houses and condos - Coal or coke (%)
House heating fuel used in houses and condos - Wood (%)
House heating fuel used in houses and condos - Solar energy (%)
House heating fuel used in houses and condos - Other fuel (%)
House heating fuel used in houses and condos - No fuel used (%)
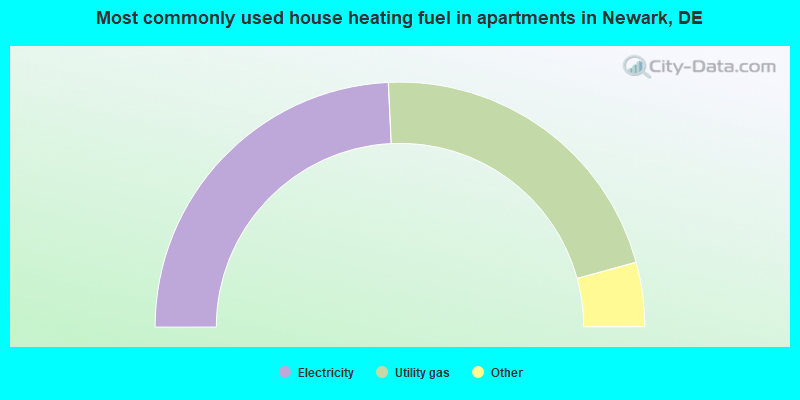
House heating fuel used in apartments - Utility gas (%)
House heating fuel used in apartments - Bottled, tank, or LP gas (%)
House heating fuel used in apartments - Electricity (%)
House heating fuel used in apartments - Fuel oil, kerosene, etc. (%)
House heating fuel used in apartments - Coal or coke (%)
House heating fuel used in apartments - Wood (%)
House heating fuel used in apartments - Solar energy (%)
House heating fuel used in apartments - Other fuel (%)
House heating fuel used in apartments - No fuel used (%)
Latest news about housing in Newark, DE collected exclusively by city-data.com from local newspapers, TV, and radio stations
Median year house/condo built: 1970Median year apartment built: 1988Household type by relationship:
Households: 30,919
Male householders: 4,752 (1,150 living alone ), Female householders: 4,517 (1,765 living alone )3,864 spouses (3,836 opposite-sex spouses ), 517 unmarried partners , (490 opposite-sex unmarried partners ), 4,528 children (4,358 natural , 15 adopted , 155 stepchildren ), 275 grandchildren , 159 brothers or sisters , 236 parents , 0 foster children , 89 other relatives , 4,415 non-relatives In group quarters: 7,562
Size of family households: 2,100 2-persons , 901 3-persons , 880 4-persons , 318 5-persons , 91 6-persons , 18 7-or-more-persons .
Size of nonfamily households: 2,985 1-person , 993 2-persons , 285 3-persons , 436 4-persons , 95 5-persons , 25 6-persons , 16 7-or-more-persons .
2,465 married couples with children. single-parent households (159 men , 497 women ).
81.7% of residents of Newark speak English at home. of residents speak Spanish at home (89% speak English very well , 9% speak English well , 2% speak English not well , 1% don't speak English at all ).of residents speak other Indo-European language at home (83% speak English very well , 15% speak English well , 3% speak English not well ).of residents speak Asian or Pacific Island language at home (55% speak English very well , 34% speak English well , 9% speak English not well , 2% don't speak English at all ).of residents speak other language at home (86% speak English very well , 10% speak English well , 4% speak English not well ).
Foreign born population: 4,061 (13.1%)of them are naturalized citizens )
Median number of rooms in houses and condos:
Median number of rooms in apartments
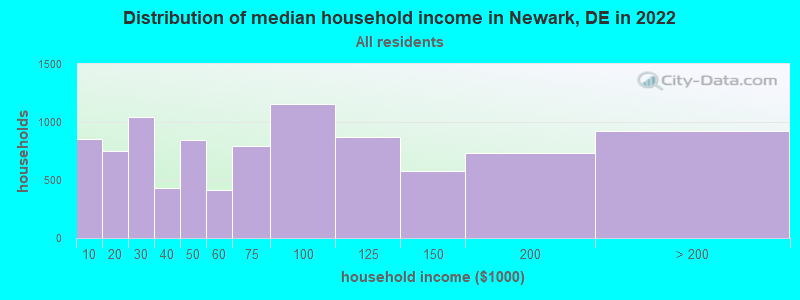
Newark, DE household income distribution 850 Less than $10,000750 $10,000 to $19,9991,044 $20,000 to $29,999430 $30,000 to $39,999843 $40,000 to $49,999412 $50,000 to $59,999790 $60,000 to $74,9991,158 $75,000 to $99,999873 $100,000 to $124,999574 $125,000 to $149,999733 $150,000 to $199,999924 $200,000 or more
Home value of owner - occupied houses in 2022 in Newark, DE 47 Less than $10,00016 $10,000 to $14,99912 $20,000 to $24,99913 $25,000 to $29,99933 $30,000 to $34,9998 $50,000 to $59,9997 $80,000 to $89,99919 $90,000 to $99,999112 $100,000 to $124,99965 $125,000 to $149,99993 $150,000 to $174,999191 $175,000 to $199,999449 $200,000 to $249,999596 $250,000 to $299,9991,684 $300,000 to $399,999858 $400,000 to $499,999661 $500,000 to $749,99931 $750,000 to $999,99917 $1,000,000 to $1,499,99920 $2,000,000 or moreRent paid by renters in 2022 in Newark, DE 10 $100 to $14928 $200 to $2499 $250 to $2994 $300 to $34912 $350 to $39973 $400 to $44925 $550 to $59940 $650 to $69928 $700 to $74940 $750 to $799139 $800 to $899178 $900 to $999778 $1,000 to $1,249936 $1,250 to $1,499633 $1,500 to $1,999536 $2,000 to $2,499265 $2,500 to $2,999297 $3,000 to $3,49989 $3,500 or more408 No cash rent
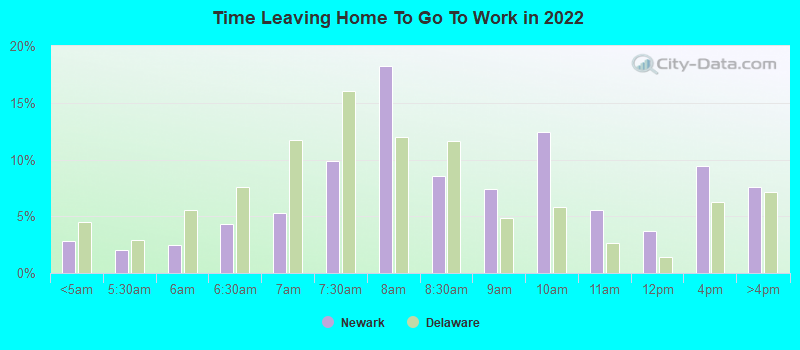
Percentage of workers working in this county: 88.1%Number of people working at home: 2,861 (21.1% of all workers )
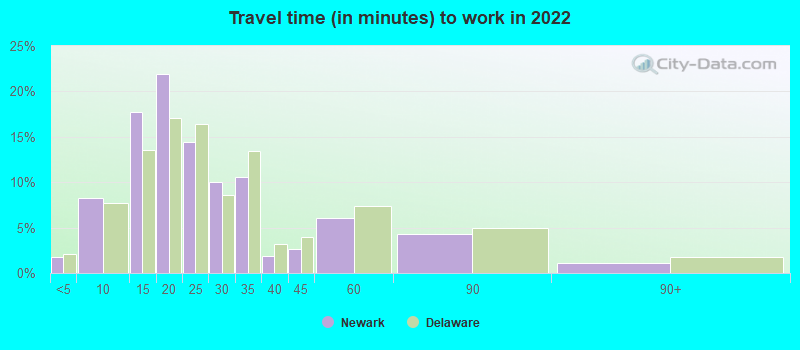
Travel time to work (commute)
Less than 5 minutes: 4365 to 9 minutes: 1,45210 to 14 minutes: 2,12515 to 19 minutes: 2,03620 to 24 minutes: 1,20925 to 29 minutes: 1,09130 to 34 minutes: 1,04235 to 39 minutes: 27740 to 44 minutes: 52745 to 59 minutes: 24460 to 89 minutes: 26190 or more minutes: 64
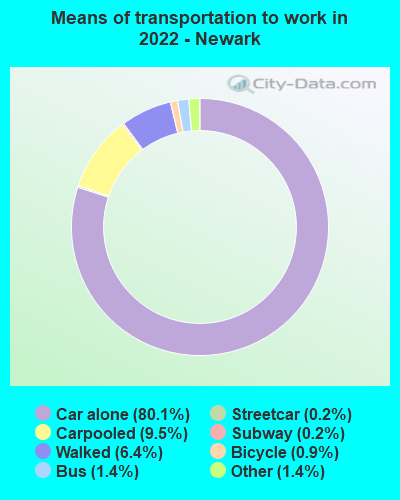
Means of transportation to work:
Drove a car alone: 20,290 (70.8%)Carpooled: 2,268 (7.9%)Bus : 334 (1.2%)Subway or elevated rail : 64 (0.2%)Long-distance train or commuter rail : 29 (0.1%)Taxi: 337 (1.2%)Bicycle: 452 (1.6%)Walked: 1,687 (5.9%)Worked at home: 2,861 (10.0%)
Unemployment by race in 2022
Unemployment rate for White non-Hispanic residents 6.6% Males6.3% FemalesUnemployment rate for Black residents 7.5% Males7.3% FemalesUnemployment rate for Asian residents 1.5% Males1.3% FemalesUnemployment rate for two or more race residents 3.7% MalesUnemployment rate for Hispanic or Latino residents 0.8% Males4.1% Females
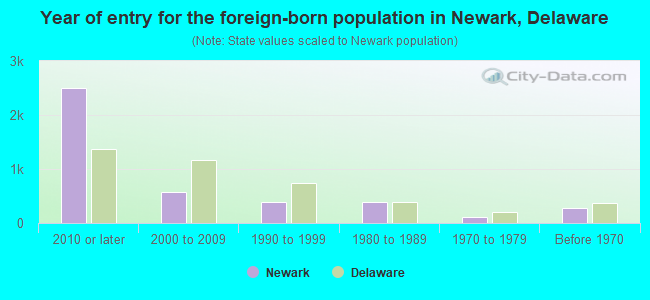
Year of entry for the foreign-born population in Newark, Delaware
2,505 2010 or later 574 2000 to 2009 385 1990 to 1999 381 1980 to 1989 108 1970 to 1979 281 Before 1970
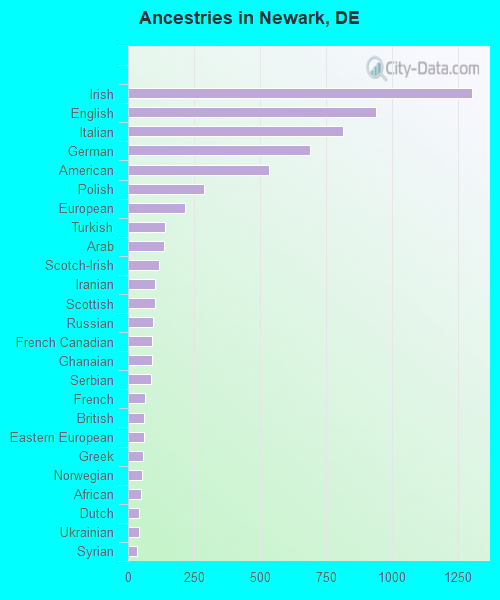
First ancestries reported:
Irish: 1,304 (11.4%)
English: 940 (8.2%)
Italian: 814 (7.1%)
German: 691 (6.1%)
American: 536 (4.7%)
Polish: 287 (2.5%)
European: 217 (1.9%)
Turkish: 141 (1.2%)
Arab: 135 (1.2%)
Scotch-Irish: 117 (1.0%)
Iranian: 103 (0.9%)
Scottish: 103 (0.9%)
Russian: 96 (0.8%)
French Canadian: 90 (0.8%)
Ghanaian: 90 (0.8%)
Serbian: 86 (0.8%)
French: 65 (0.6%)
British: 61 (0.5%)
Eastern European: 61 (0.5%)
Greek: 58 (0.5%)
Norwegian: 53 (0.5%)
African: 51 (0.4%)
Dutch: 42 (0.4%)
Ukrainian: 42 (0.4%)
Syrian: 36 (0.3%)
Belgian: 36 (0.3%)
Albanian: 34 (0.3%)
West Indian: 30 (0.3%)
Northern European: 27 (0.2%)
Jamaican: 23 (0.2%)
Scandinavian: 21 (0.2%)
Ethiopian: 20 (0.2%)
Welsh: 20 (0.2%)
Austrian: 15 (0.1%)
Swiss: 13 (0.1%)
Guyanese: 12 (0.1%)
Hungarian: 12 (0.1%)
Lebanese: 11 (0.10%)
Canadian: 11 (0.10%)
Carpatho Rusyn: 10 (0.09%)
Pennsylvania German: 9 (0.08%)
Nigerian: 8 (0.07%)
Yugoslavian: 8 (0.07%)
South African: 7 (0.06%)
Slovak: 6 (0.05%)
Maltese: 6 (0.05%)
Danish: 6 (0.05%)
Swedish: 5 (0.04%)
Kenyan: 4 (0.04%)
Haitian: 3 (0.03%)
Israeli: 3 (0.03%)
Egyptian: 2 (0.02%)
Australian: 1 (0.01%)
British West Indian: 1 (0.01%)
Most common places of birth for foreign-born residents (%): China, excluding Hong Kong and Taiwan Newark:
25.9% (1,045)Delaware:
5.7% (5,583)
Venezuela Newark:
7.5% (303)Delaware:
0.5% (445)
Mexico Newark:
6.6% (266)Delaware:
15.3% (14,887)
India Newark:
5.4% (217)Delaware:
11.6% (11,288)
Other Western Asia Newark:
4.4% (176)Delaware:
0.2% (171)
Nigeria Newark:
3.9% (157)Delaware:
3.0% (2,919)
Turkey Newark:
3.5% (141)Delaware:
1.1% (1,064)
Iran Newark:
3.5% (141)Delaware:
0.3% (302)
Other South Central Asia Newark:
3.3% (132)Delaware:
0.2% (181)
Canada Newark:
3.2% (129)Delaware:
1.4% (1,345)
Vietnam Newark:
2.3% (94)Delaware:
1.4% (1,388)
Brazil Newark:
2.3% (94)Delaware:
0.5% (533)
Serbia Newark:
2.3% (93)Delaware:
0.1% (100)
Saudi Arabia Newark:
2.1% (84)Delaware:
0.1% (88)
Russia Newark:
2.0% (79)Delaware:
0.9% (911)
Ghana Newark:
1.8% (74)Delaware:
1.6% (1,557)
Poland Newark:
1.6% (65)Delaware:
0.6% (591)
Kenya Newark:
1.5% (62)Delaware:
1.8% (1,717)
Place of birth for U.S.-born residents:
This state: 9,347Other state: 16,957Northeast: 10,989Midwest: 1,170South: 3,834West: 911 69.4% of Newark residents lived in the same house 1 years ago.
Out of people who lived in different houses, 25.6% lived in this county.
Out of people who lived in different counties, 10.5% lived in Delaware.
Newark:
69.4%State average:
89.2%
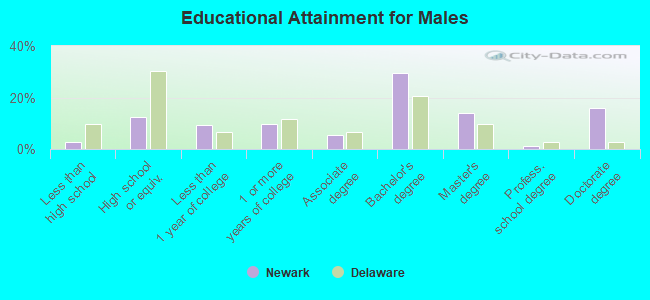
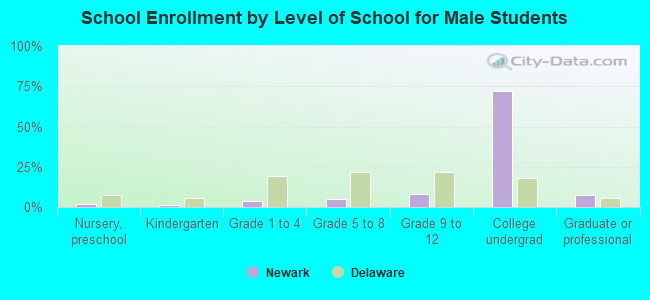
Education attainment for males 25 years and older:
No schooling: 42Nursery to 4th grade: 15th and 6th grade: 07th and 8th grade: 429th grade: 2110th grade: 2111th grade: 2012th grade, no diploma: 36High school graduate (or equivalency): 908Less than 1 year of college: 664Some college more than 1 year, no degree: 707Associate degree: 385Bachelor's degree: 2,126Master's degree: 1,019Professional school degree: 88Doctorate degree: 1,141
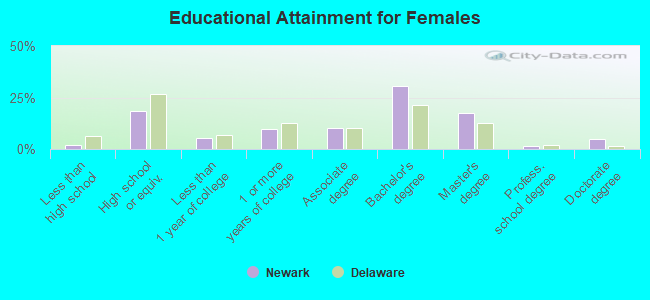
Education attainment for females 25 years and older:
No schooling: 20Nursery to 4th grade: 05th and 6th grade: 297th and 8th grade: 209th grade: 1010th grade: 2711th grade: 712th grade, no diploma: 33High school graduate (or equivalency): 1,257Less than 1 year of college: 376Some college more than 1 year, no degree: 667Associate degree: 682Bachelor's degree: 2,092Master's degree: 1,179Professional school degree: 105Doctorate degree: 320
Housing units in structures:
One, detached: 4,531One, attached: 1,696Two: 2403 or 4: 4645 to 9: 52810 to 19: 1,51120 to 49: 82150 or more: 882Mobile homes: 13Housing units lacking complete plumbing facilities in 2022: 0.1%Housing units lacking complete kitchen facilities in 2022: 2.6%House/condo owner moved in on average 17 years ago
Renter moved in on average 2 years ago
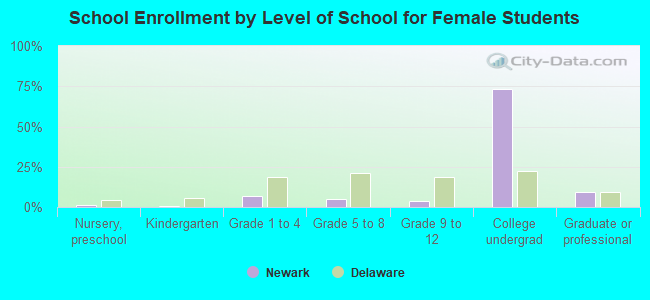
Private vs. public school enrollment:
Students in private schools in grades 1 to 8 (elementary and middle school): 213 Students in private schools in grades 9 to 12 (high school): 51 Students in private undergraduate colleges: 875