Races in Newark, Delaware (DE) Detailed Stats
Data:
Races - White alone (%)
Races - White alone (% change since 2000)
Races - Black alone (%)
Races - Black alone (% change since 2000)
Races - American Indian alone (%)
Races - American Indian alone (% change since 2000)
Races - Asian alone (%)
Races - Asian alone (% change since 2000)
Races - Hispanic (%)
Races - Hispanic (% change since 2000)
Races - Native Hawaiian and Other Pacific Islander alone (%)
Races - Native Hawaiian and Other Pacific Islander alone (% change since 2000)
Races - Two or more races(%)
Races - Two or more races(% change since 2000)
Races - Other race alone (%)
Races - Other race alone (% change since 2000)
Racial diversity
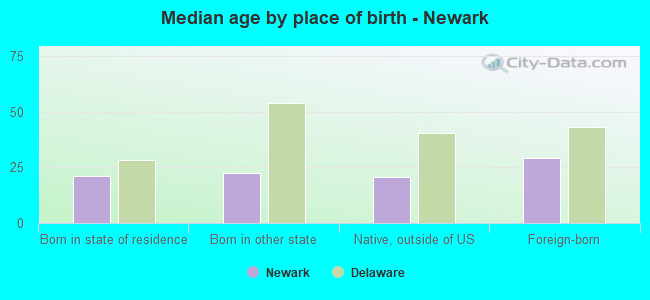
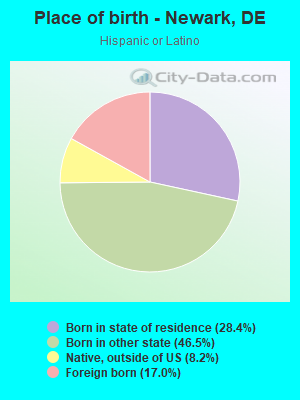
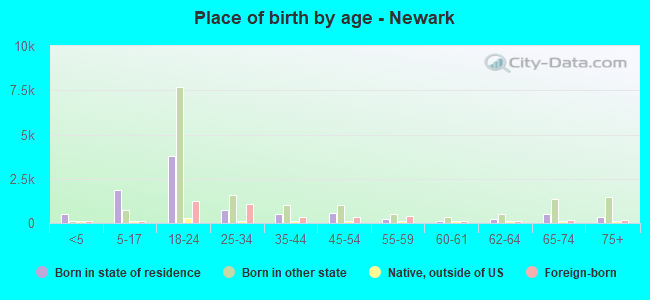
Place of birth - Born in state of residence (%)
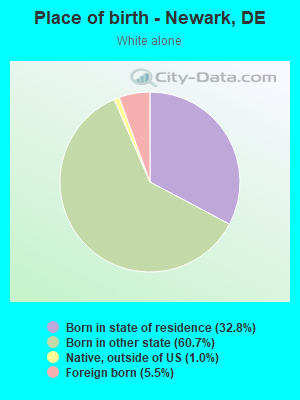
Place of birth - Born in state of residence (%) - White
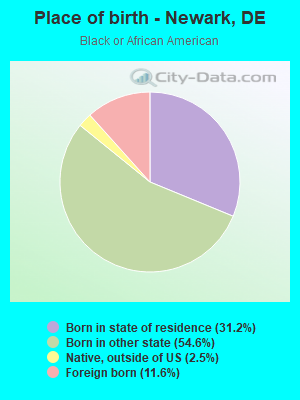
Place of birth - Born in state of residence (%) - Black or African American
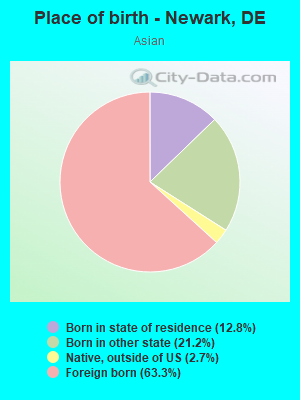
Place of birth - Born in state of residence (%) - Asian
Place of birth - Born in state of residence (%) - Hispanic or Latino
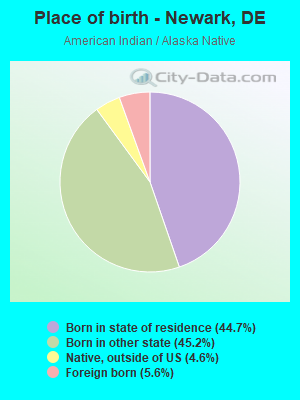
Place of birth - Born in state of residence (%) - American Indian and Alaska Native
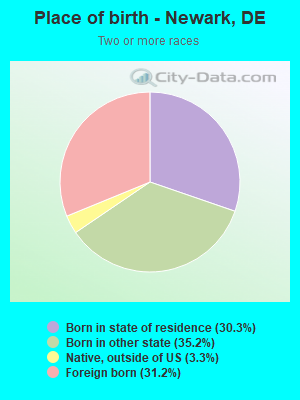
Place of birth - Born in state of residence (%) - Multirace
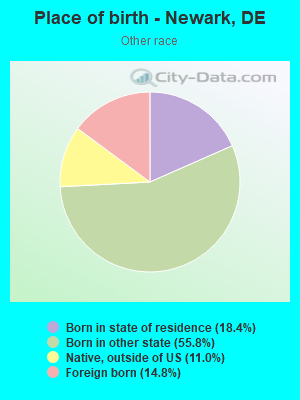
Place of birth - Born in state of residence (%) - Other Race
Place of birth - Born in other state (%)
Place of birth - Born in other state (%) - White
Place of birth - Born in other state (%) - Black or African American
Place of birth - Born in other state (%) - Asian
Place of birth - Born in other state (%) - Hispanic or Latino
Place of birth - Born in other state (%) - American Indian and Alaska Native
Place of birth - Born in other state (%) - Multirace
Place of birth - Born in other state (%) - Other Race
Place of birth - Native, outside of US (%)
Place of birth - Native, outside of US (%) - White
Place of birth - Native, outside of US (%) - Black or African American
Place of birth - Native, outside of US (%) - Asian
Place of birth - Native, outside of US (%) - Hispanic or Latino
Place of birth - Native, outside of US (%) - American Indian and Alaska Native
Place of birth - Native, outside of US (%) - Multirace
Place of birth - Native, outside of US (%) - Other Race
Place of birth - Foreign born (%)
Place of birth - Foreign born (%) - White
Place of birth - Foreign born (%) - Black or African American
Place of birth - Foreign born (%) - Asian
Place of birth - Foreign born (%) - Hispanic or Latino
Place of birth - Foreign born (%) - American Indian and Alaska Native
Place of birth - Foreign born (%) - Multirace
Place of birth - Foreign born (%) - Other Race
Residents speaking English at home (%)
Residents speaking English at home - Born in the United States (%)
Residents speaking English at home - Native, born elsewhere (%)
Residents speaking English at home - Foreign born (%)
Residents speaking Spanish at home (%)
Residents speaking Spanish at home - Born in the United States (%)
Residents speaking Spanish at home - Native, born elsewhere (%)
Residents speaking Spanish at home - Foreign born (%)
Residents speaking other language at home (%)
Residents speaking other language at home - Born in the United States (%)
Residents speaking other language at home - Native, born elsewhere (%)
Residents speaking other language at home - Foreign born (%)
Marital status - Never married (%)
Marital status - Now married (%)
Marital status - Separated (%)
Marital status - Widowed (%)
Marital status - Divorced (%)
Ancestries Reported - Arab (%)
Ancestries Reported - Czech (%)
Ancestries Reported - Danish (%)
Ancestries Reported - Dutch (%)
Ancestries Reported - English (%)
Ancestries Reported - French (%)
Ancestries Reported - French Canadian (%)
Ancestries Reported - German (%)
Ancestries Reported - Greek (%)
Ancestries Reported - Hungarian (%)
Ancestries Reported - Irish (%)
Ancestries Reported - Italian (%)
Ancestries Reported - Lithuanian (%)
Ancestries Reported - Norwegian (%)
Ancestries Reported - Polish (%)
Ancestries Reported - Portuguese (%)
Ancestries Reported - Russian (%)
Ancestries Reported - Scotch-Irish (%)
Ancestries Reported - Scottish (%)
Ancestries Reported - Slovak (%)
Ancestries Reported - Subsaharan African (%)
Ancestries Reported - Swedish (%)
Ancestries Reported - Swiss (%)
Ancestries Reported - Ukrainian (%)
Ancestries Reported - United States (%)
Ancestries Reported - Welsh (%)
Ancestries Reported - West Indian (%)
Ancestries Reported - Other (%)
Geographical mobility - Same house 1 year ago (%)
Geographical mobility - Same house 1 year ago (%) - White
Geographical mobility - Same house 1 year ago (%) - Black or African American
Geographical mobility - Same house 1 year ago (%) - Asian
Geographical mobility - Same house 1 year ago (%) - Hispanic or Latino
Geographical mobility - Same house 1 year ago (%) - American Indian and Alaska Native
Geographical mobility - Same house 1 year ago (%) - Multirace
Geographical mobility - Same house 1 year ago (%) - Other Race
Geographical mobility - Moved within same county (%)
Geographical mobility - Moved within same county (%) - White
Geographical mobility - Moved within same county (%) - Black or African American
Geographical mobility - Moved within same county (%) - Asian
Geographical mobility - Moved within same county (%) - Hispanic or Latino
Geographical mobility - Moved within same county (%) - American Indian and Alaska Native
Geographical mobility - Moved within same county (%) - Multirace
Geographical mobility - Moved within same county (%) - Other Race
Geographical mobility - Moved from different county within same state (%)
Geographical mobility - Moved from different county within same state (%) - White
Geographical mobility - Moved from different county within same state (%) - Black or African American
Geographical mobility - Moved from different county within same state (%) - Asian
Geographical mobility - Moved from different county within same state (%) - Hispanic or Latino
Geographical mobility - Moved from different county within same state (%) - American Indian and Alaska Native
Geographical mobility - Moved from different county within same state (%) - Multirace
Geographical mobility - Moved from different county within same state (%) - Other Race
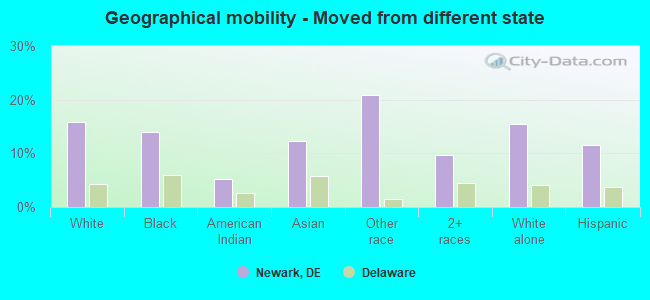
Geographical mobility - Moved from different state (%)
Geographical mobility - Moved from different state (%) - White
Geographical mobility - Moved from different state (%) - Black or African American
Geographical mobility - Moved from different state (%) - Asian
Geographical mobility - Moved from different state (%) - Hispanic or Latino
Geographical mobility - Moved from different state (%) - American Indian and Alaska Native
Geographical mobility - Moved from different state (%) - Multirace
Geographical mobility - Moved from different state (%) - Other Race
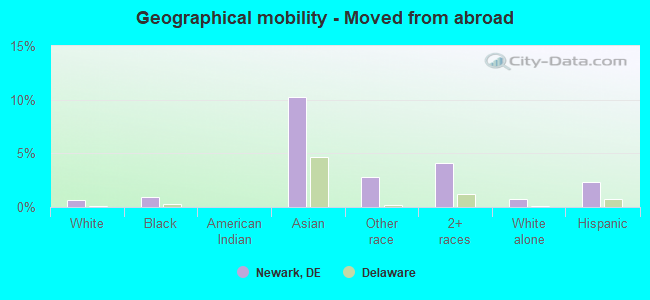
Geographical mobility - Moved from abroad (%)
Geographical mobility - Moved from abroad (%) - White
Geographical mobility - Moved from abroad (%) - Black or African American
Geographical mobility - Moved from abroad (%) - Asian
Geographical mobility - Moved from abroad (%) - Hispanic or Latino
Geographical mobility - Moved from abroad (%) - American Indian and Alaska Native
Geographical mobility - Moved from abroad (%) - Multirace
Geographical mobility - Moved from abroad (%) - Other Race
Place of birth for the foreign-born population - Ireland (%)
Place of birth for the foreign-born population - Denmark (%)
Place of birth for the foreign-born population - Norway (%)
Place of birth for the foreign-born population - Sweden (%)
Place of birth for the foreign-born population - United Kingdom (%)
Place of birth for the foreign-born population - England (%)
Place of birth for the foreign-born population - Scotland (%)
Place of birth for the foreign-born population - Other Northern Europe (%)
Place of birth for the foreign-born population - Austria (%)
Place of birth for the foreign-born population - Belgium (%)
Place of birth for the foreign-born population - France (%)
Place of birth for the foreign-born population - Germany (%)
Place of birth for the foreign-born population - Netherlands (%)
Place of birth for the foreign-born population - Switzerland (%)
Place of birth for the foreign-born population - Other Western Europe (%)
Place of birth for the foreign-born population - Greece (%)
Place of birth for the foreign-born population - Italy (%)
Place of birth for the foreign-born population - Portugal (%)
Place of birth for the foreign-born population - Spain (%)
Place of birth for the foreign-born population - Other Southern Europe (%)
Place of birth for the foreign-born population - Albania (%)
Place of birth for the foreign-born population - Belarus (%)
Place of birth for the foreign-born population - Bosnia and Herzegovina (%)
Place of birth for the foreign-born population - Bulgaria (%)
Place of birth for the foreign-born population - Croatia (%)
Place of birth for the foreign-born population - Czechoslovakia (%)
Place of birth for the foreign-born population - Hungary (%)
Place of birth for the foreign-born population - Latvia (%)
Place of birth for the foreign-born population - Lithuania (%)
Place of birth for the foreign-born population - North Macedonia (Macedonia) (%)
Place of birth for the foreign-born population - Moldova (%)
Place of birth for the foreign-born population - Poland (%)
Place of birth for the foreign-born population - Romania (%)
Place of birth for the foreign-born population - Russia (%)
Place of birth for the foreign-born population - Serbia (%)
Place of birth for the foreign-born population - Ukraine (%)
Place of birth for the foreign-born population - Other Eastern Europe (%)
Place of birth for the foreign-born population - China (%)
Place of birth for the foreign-born population - Hong Kong (%)
Place of birth for the foreign-born population - Taiwan (%)
Place of birth for the foreign-born population - Japan (%)
Place of birth for the foreign-born population - Korea (%)
Place of birth for the foreign-born population - Other Eastern Asia (%)
Place of birth for the foreign-born population - Afghanistan (%)
Place of birth for the foreign-born population - Bangladesh (%)
Place of birth for the foreign-born population - India (%)
Place of birth for the foreign-born population - Iran (%)
Place of birth for the foreign-born population - Kazakhstan (%)
Place of birth for the foreign-born population - Nepal (%)
Place of birth for the foreign-born population - Pakistan (%)
Place of birth for the foreign-born population - Sri Lanka (%)
Place of birth for the foreign-born population - Uzbekistan (%)
Place of birth for the foreign-born population - Other South Central Asia (%)
Place of birth for the foreign-born population - Burma (%)
Place of birth for the foreign-born population - Cambodia (%)
Place of birth for the foreign-born population - Indonesia (%)
Place of birth for the foreign-born population - Laos (%)
Place of birth for the foreign-born population - Malaysia (%)
Place of birth for the foreign-born population - Philippines (%)
Place of birth for the foreign-born population - Singapore (%)
Place of birth for the foreign-born population - Thailand (%)
Place of birth for the foreign-born population - Vietnam (%)
Place of birth for the foreign-born population - Other South Eastern Asia (%)
Place of birth for the foreign-born population - Armenia (%)
Place of birth for the foreign-born population - Iraq (%)
Place of birth for the foreign-born population - Israel (%)
Place of birth for the foreign-born population - Jordan (%)
Place of birth for the foreign-born population - Kuwait (%)
Place of birth for the foreign-born population - Lebanon (%)
Place of birth for the foreign-born population - Saudi Arabia (%)
Place of birth for the foreign-born population - Syria (%)
Place of birth for the foreign-born population - Turkey (%)
Place of birth for the foreign-born population - Yemen (%)
Place of birth for the foreign-born population - Other Western Asia (%)
Place of birth for the foreign-born population - Eritrea (%)
Place of birth for the foreign-born population - Ethiopia (%)
Place of birth for the foreign-born population - Kenya (%)
Place of birth for the foreign-born population - Somalia (%)
Place of birth for the foreign-born population - Uganda (%)
Place of birth for the foreign-born population - Zimbabwe (%)
Place of birth for the foreign-born population - Other Eastern Africa (%)
Place of birth for the foreign-born population - Cameroon (%)
Place of birth for the foreign-born population - Congo (%)
Place of birth for the foreign-born population - Democratic Republic of Congo (Zaire) (%)
Place of birth for the foreign-born population - Other Middle Africa (%)
Place of birth for the foreign-born population - Egypt (%)
Place of birth for the foreign-born population - Morocco (%)
Place of birth for the foreign-born population - Sudan (%)
Place of birth for the foreign-born population - Other Northern Africa (%)
Place of birth for the foreign-born population - South Africa (%)
Place of birth for the foreign-born population - Other Southern Africa (%)
Place of birth for the foreign-born population - Cabo Verde (%)
Place of birth for the foreign-born population - Ghana (%)
Place of birth for the foreign-born population - Liberia (%)
Place of birth for the foreign-born population - Nigeria (%)
Place of birth for the foreign-born population - Senegal (%)
Place of birth for the foreign-born population - Sierra Leone (%)
Place of birth for the foreign-born population - Other Western Africa (%)
Place of birth for the foreign-born population - Australia (%)
Place of birth for the foreign-born population - New Zealand (%)
Place of birth for the foreign-born population - Fiji (%)
Place of birth for the foreign-born population - Micronesia (%)
Place of birth for the foreign-born population - Bahamas (%)
Place of birth for the foreign-born population - Barbados (%)
Place of birth for the foreign-born population - Cuba (%)
Place of birth for the foreign-born population - Dominica (%)
Place of birth for the foreign-born population - Dominican Republic (%)
Place of birth for the foreign-born population - Grenada (%)
Place of birth for the foreign-born population - Haiti (%)
Place of birth for the foreign-born population - Jamaica (%)
Place of birth for the foreign-born population - St. Vincent and the Grenadines (%)
Place of birth for the foreign-born population - Trinidad and Tobago (%)
Place of birth for the foreign-born population - West Indies (%)
Place of birth for the foreign-born population - Other Caribbean (%)
Place of birth for the foreign-born population - Belize (%)
Place of birth for the foreign-born population - Costa Rica (%)
Place of birth for the foreign-born population - El Salvador (%)
Place of birth for the foreign-born population - Guatemala (%)
Place of birth for the foreign-born population - Honduras (%)
Place of birth for the foreign-born population - Mexico (%)
Place of birth for the foreign-born population - Nicaragua (%)
Place of birth for the foreign-born population - Panama (%)
Place of birth for the foreign-born population - Other Central America (%)
Place of birth for the foreign-born population - Argentina (%)
Place of birth for the foreign-born population - Bolivia (%)
Place of birth for the foreign-born population - Brazil (%)
Place of birth for the foreign-born population - Chile (%)
Place of birth for the foreign-born population - Colombia (%)
Place of birth for the foreign-born population - Ecuador (%)
Place of birth for the foreign-born population - Guyana (%)
Place of birth for the foreign-born population - Peru (%)
Place of birth for the foreign-born population - Uruguay (%)
Place of birth for the foreign-born population - Venezuela (%)
Place of birth for the foreign-born population - Other South America (%)
Place of birth for the foreign-born population - Canada (%)
Place of birth for the foreign-born population - Other Northern America (%)
Place of birth for the foreign-born population - Other (%)
Latest news about races in Newark, DE collected exclusively by city-data.com from local newspapers, TV, and radio stations
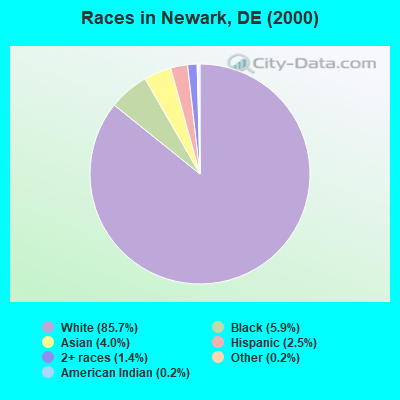
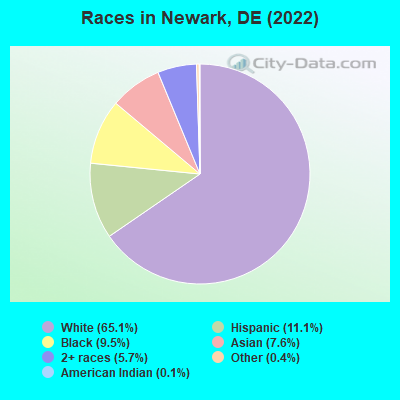
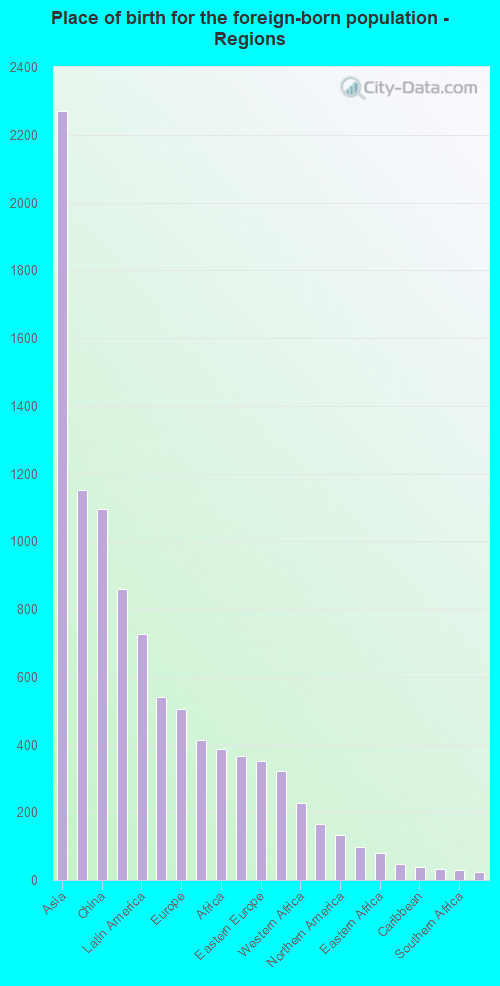
According to 2022 data, the most numerous races in Newark, DE are White alone (20,137 residents), Black alone (2,942 residents), and Hispanic (3,423 residents). 82.1% of Newark residents speak English at home. 13.0% of Newark, DE residents are foreign-born (7.3% born in Asia, 2.3% born in Latin America, 1.6% born in Europe), which is 31.0% greater than the foreign-born rate of 9.0% across the entire state of Delaware.
Race distribution in Newark
2000 2022
567,973 72.5% White alone 148,435 18.9% Black alone 37,277 4.8% Hispanic 16,110 2.1% Asian alone 10,222 1.3% Two or more races 2,324 0.3% American Indian alone 1,025 0.1% Other race alone 234 0.03% Native Hawaiian and Other
599,347 58.9% White alone 220,010 21.6% Black alone 105,300 10.3% Hispanic 46,016 4.5% Two or more races 41,350 4.1% Asian alone 5,097 0.5% Other race alone 1,276 0.1% American Indian alone
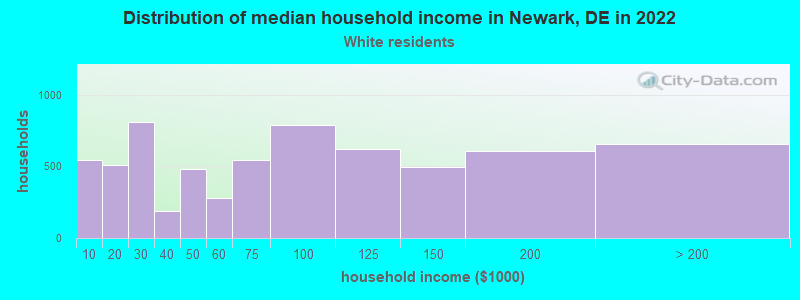
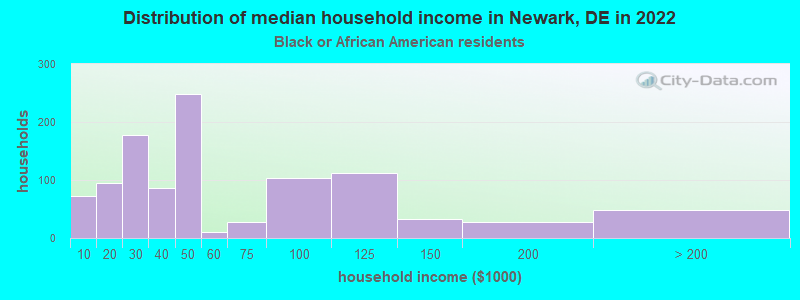
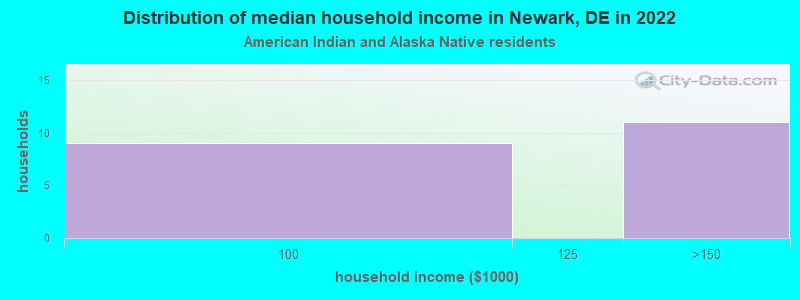
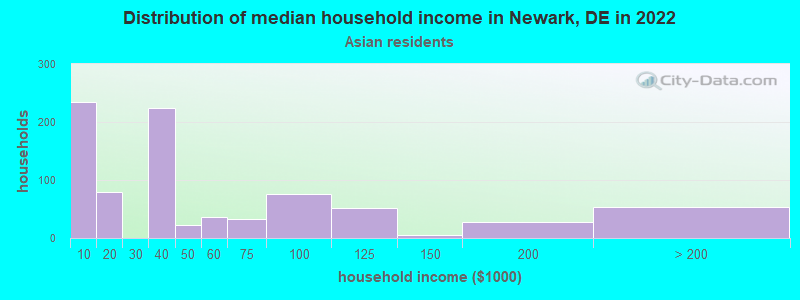
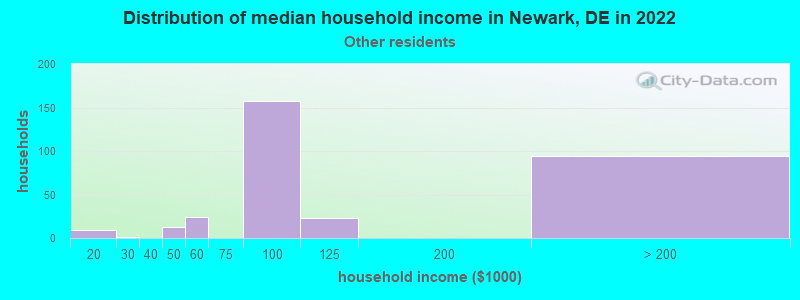
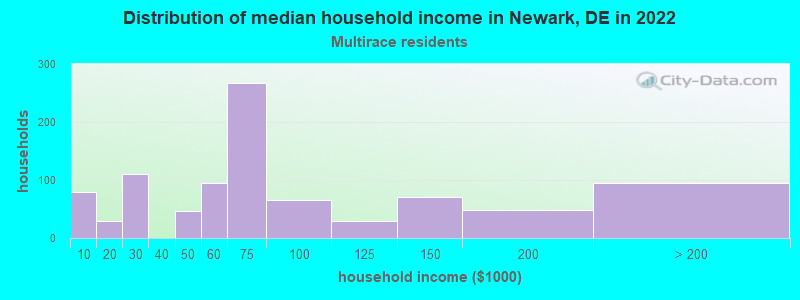
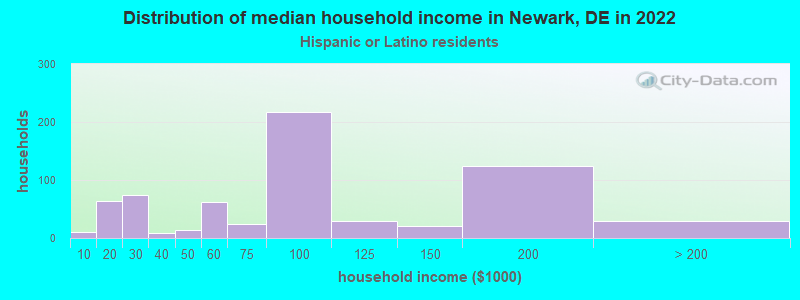
Income and house value in Newark Median household income in 2022 $70,766 White non-Hispanic householders$43,373 Black householders$32,593 Asian householders$108,870 Some other race householders$65,846 Two or more races householders$100,541 Hispanic or Latino race householdersMedian 2022 house value $359,329 White Non-Hispanic householders$309,331 Black or African American householders $463,296 Asian householders$321,247 Native Hawaiian and other Pacific Islander householders$321,247 Some other race householders$338,068 Two or more races householders$322,649 Hispanic or Latino householders
Median age by race in Newark
22.9 Median age for White residents23.2 22.6 25.2 Median age for Black or African American residents27.4 21.6 54.3 Median age for American Indian / Alaska Native residents85.5 60.5 26.3 Median age for Asian residents25.5 27.1 -666,666,666.0 Median age for Native Hawaiian / Pacific Islander residents-668,724,279.2 -670,599,802.7 27.3 Median age for Other race residents28.2 27.1 22.3 Median age for Two or more races residents21.7 23.0 22.4 Median age for White alone residents22.7 22.0 22.0 Median age for Hispanic or Latino residents27.5 20.1
Owner/renter occupied households by race in Newark
House owners and renters - White residents 3,827 60.9% Owner occupied2,455 39.1% Renter occupiedHouse owners and renters - Black or African American residents 348 36.5% Owner occupied605 63.5% Renter occupiedHouse owners and renters - American Indian / Alaska Native residents 38 100.0% Owner occupiedHouse owners and renters - Asian residents 255 36.6% Owner occupied441 63.4% Renter occupiedHouse owners and renters - Other race residents 185 68.6% Owner occupied85 31.4% Renter occupiedHouse owners and renters - Two or more races residents 391 40.0% Owner occupied587 60.0% Renter occupiedHouse owners and renters - White alone residents 3,754 59.8% Owner occupied2,527 40.2% Renter occupiedHouse owners and renters - Hispanic or Latino residents 268 42.3% Owner occupied365 57.7% Renter occupied
Language usage in Newark
English speakers - Total 82.1% of residents of Newark speak English at home.
5.9% of residents speak Spanish at home 1,591 89.0% Speak English very well197 11.0% Speak English less than very well12.3% of residents speak other language at home 2,575 69.3% Speak English very well1,140 30.7% Speak English less than very well
English speakers - Born in the United States 93.6% of residents of Newark speak English at home.
3.1% of residents speak Spanish at home 514 99.8% Speak English very well1 0.2% Speak English less than very well3.3% of residents speak other language at home 509 92.4% Speak English very well42 7.6% Speak English less than very well
English speakers - Native, born elsewhere 51.9% of residents of Newark speak English at home.
39.2% of residents speak Spanish at home 173 65.8% Speak English very well90 34.2% Speak English less than very well6.9% of residents speak other language at home 45 97.8% Speak English very well1 2.2% Speak English less than very well
English speakers - Foreign-born 21.2% of residents of Newark speak English at home.
8.2% of residents speak Spanish at home 246 73.9% Speak English very well87 26.1% Speak English less than very well71.3% of residents speak other language at home 1,849 64.1% Speak English very well1,034 35.9% Speak English less than very well
White (Caucasian) - Speak only English Native:
98.6% (18,849)Foreign-born:
26.4% (200)
White (Caucasian) - Speak another language Native:
1.8% (337)Foreign-born:
69.8% (528)
Black or African American - Speak only English Native:
97.0% (2,546)Foreign-born:
12.1% (44)
Black or African American - Speak another language Native:
3.0% (78)Foreign-born:
100.0% (362)
American Indian / Alaska Native - Speak only English Native:
90.3% (96)Foreign-born:
81.2% (6)
Asian - Speak only English Native:
30.0% (252)Foreign-born:
9.3% (139)
Asian - Speak another language Native:
75.8% (635)Foreign-born:
88.3% (1,321)
Other race - Speak another language Native:
21.8% (139)Foreign-born:
91.5% (122)
Two or more races - Speak only English Native:
54.3% (1,584)Foreign-born:
51.5% (720)
Two or more races - Speak another language Native:
53.8% (1,567)Foreign-born:
51.1% (715)
White alone - Speak only English Native:
98.8% (18,509)Foreign-born:
19.8% (219)
White alone - Speak another language Native:
1.3% (234)Foreign-born:
79.2% (875)
Hispanic or Latino - Speak only English Native:
49.4% (1,383)Foreign-born:
73.3% (447)
Hispanic or Latino - Speak another language Native:
51.2% (1,434)Foreign-born:
53.7% (328)
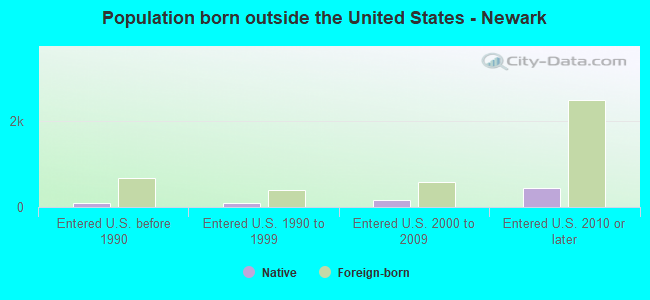
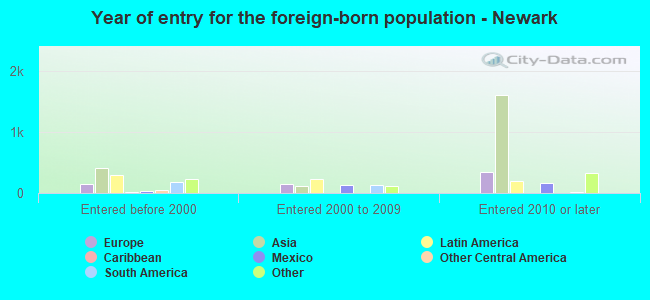
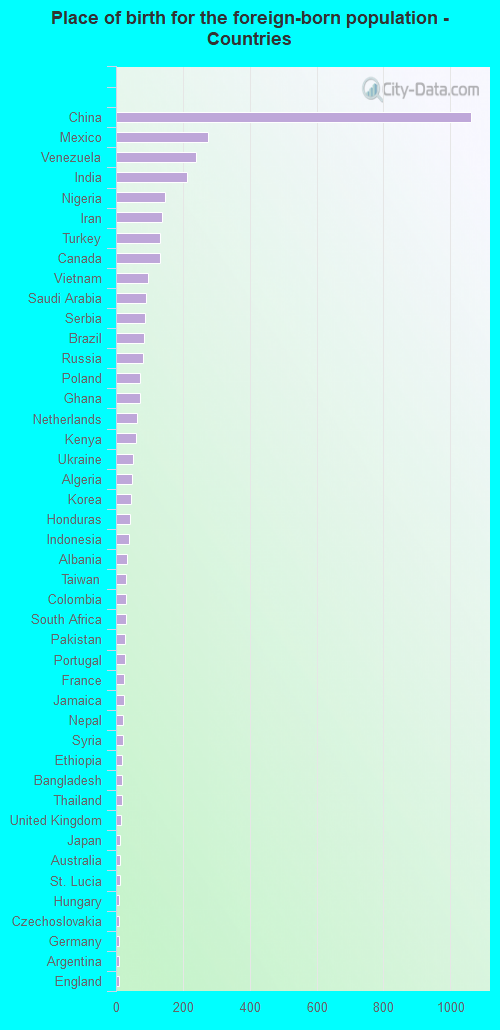
Foreign-born residents in Newark 4,034 residents are foreign born (7.3% Asia , 2.3% Latin America , 1.6% Europe ).
This city:
13.0%Delaware:
9.8%
Marital status for residents in Newark Marital status - White (Caucasian) population 15 years and over
Males 66.5% Never married27.8% Now married0.2% Separated2.2% Widowed3.2% DivorcedFemales 63.5% Never married24.6% Now married0.1% Separated6.2% Widowed5.6% DivorcedWomen who gave birth in the past 12 months Now married:
74.6% (45)Unmarried:
25.4% (15)
Women who did not give birth in the past 12 months Now married:
12.0% (814)Unmarried:
88.0% (5,957)
Marital status - Black or African American population 15 years and over
Males 54.9% Never married37.8% Now married0.0% Separated2.5% Widowed4.8% DivorcedFemales 58.1% Never married26.2% Now married3.1% Separated8.0% Widowed4.5% DivorcedWomen who gave birth in the past 12 months Now married:
0.0% (0)Unmarried:
100.0% (52)
Women who did not give birth in the past 12 months Now married:
25.9% (228)Unmarried:
74.1% (650)
Marital status - American Indian / Alaska Native population 15 years and over
Males 46.7% Never married53.3% Now married0.0% Separated0.0% Widowed0.0% DivorcedFemales 40.2% Never married49.4% Now married0.0% Separated10.3% Widowed0.0% DivorcedWomen who did not give birth in the past 12 months Now married:
12.5% (6)Unmarried:
87.5% (41)
Marital status - Asian population 15 years and over
Males 62.3% Never married37.7% Now married0.0% Separated0.0% Widowed0.0% DivorcedFemales 73.2% Never married25.3% Now married0.0% Separated1.1% Widowed0.4% DivorcedWomen who gave birth in the past 12 months Now married:
100.0% (79)Unmarried:
0.0% (0)
Women who did not give birth in the past 12 months Now married:
10.9% (112)Unmarried:
89.1% (924)
Marital status - Other race population 15 years and over
Males 62.2% Never married37.8% Now married0.0% Separated0.0% Widowed0.0% DivorcedFemales 43.7% Never married12.9% Now married3.6% Separated0.0% Widowed39.8% DivorcedWomen who did not give birth in the past 12 months Now married:
20.1% (60)Unmarried:
79.9% (238)
Marital status - Two or more races population 15 years and over
Males 62.8% Never married35.8% Now married0.0% Separated0.0% Widowed1.4% DivorcedFemales 58.2% Never married37.0% Now married0.0% Separated0.4% Widowed4.3% DivorcedWomen who gave birth in the past 12 months Now married:
100.0% (11)Unmarried:
0.0% (0)
Women who did not give birth in the past 12 months Now married:
12.6% (101)Unmarried:
87.4% (698)
Marital status - White alone, not Hispanic / Latino population 15 years and over
Males 67.2% Never married26.9% Now married0.2% Separated2.3% Widowed3.3% DivorcedFemales 63.6% Never married24.3% Now married0.1% Separated6.3% Widowed5.7% DivorcedWomen who gave birth in the past 12 months Now married:
74.6% (48)Unmarried:
25.4% (16)
Women who did not give birth in the past 12 months Now married:
11.3% (781)Unmarried:
88.7% (6,152)
Marital status - Hispanic or Latino population 15 years and over
Males 57.4% Never married42.6% Now married0.0% Separated0.0% Widowed0.0% DivorcedFemales 52.9% Never married30.8% Now married1.0% Separated0.9% Widowed14.5% DivorcedWomen who did not give birth in the past 12 months Now married:
17.4% (154)Unmarried:
82.6% (732)
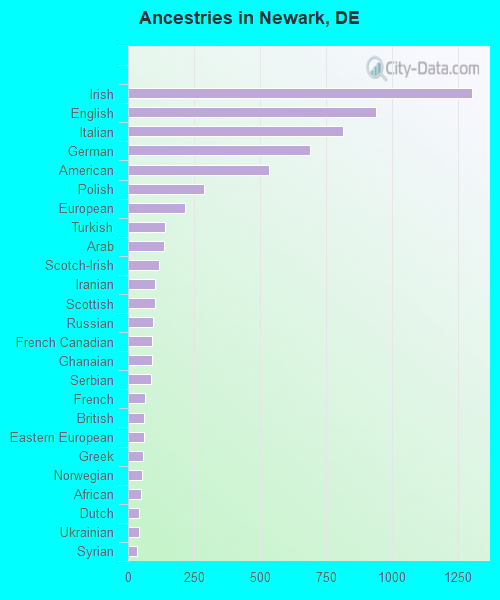
Ancestries in Newark
1,304 11.4% Irish940 8.2% English814 7.1% Italian691 6.1% German536 4.7% American287 2.5% Polish217 1.9% European141 1.2% Turkish135 1.2% Arab117 1.0% Scotch-Irish103 0.9% Iranian103 0.9% Scottish96 0.8% Russian90 0.8% French Canadian90 0.8% Ghanaian86 0.8% Serbian65 0.6% French61 0.5% British61 0.5% Eastern European58 0.5% Greek53 0.5% Norwegian51 0.4% African42 0.4% Dutch42 0.4% Ukrainian36 0.3% Syrian36 0.3% Belgian34 0.3% Albanian30 0.3% West Indian27 0.2% Northern European23 0.2% Jamaican21 0.2% Scandinavian20 0.2% Ethiopian20 0.2% Welsh15 0.1% Austrian13 0.1% Swiss12 0.1% Guyanese12 0.1% Hungarian11 0.10% Lebanese11 0.10% Canadian10 0.09% Carpatho Rusyn9 0.08% Pennsylvania German8 0.07% Nigerian8 0.07% Yugoslavian7 0.06% South African6 0.05% Slovak6 0.05% Maltese6 0.05% Danish5 0.04% Swedish4 0.04% Kenyan3 0.03% Haitian3 0.03% Israeli2 0.02% Egyptian1 0.01% Australian1 0.01% British West Indian
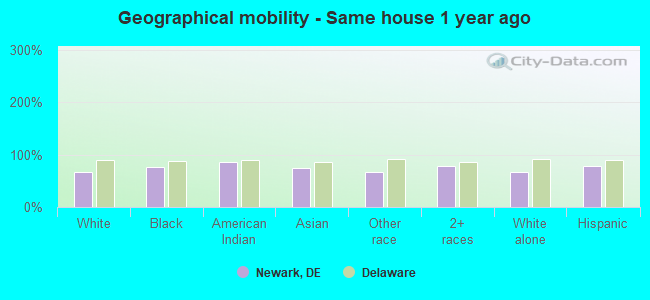
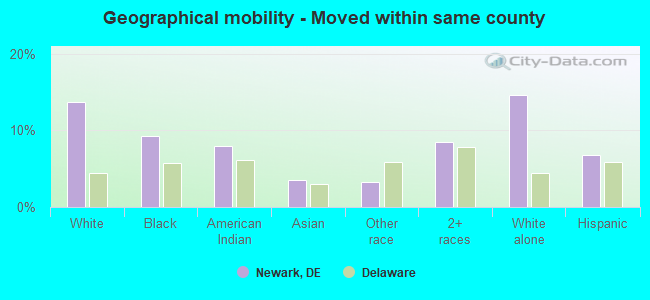
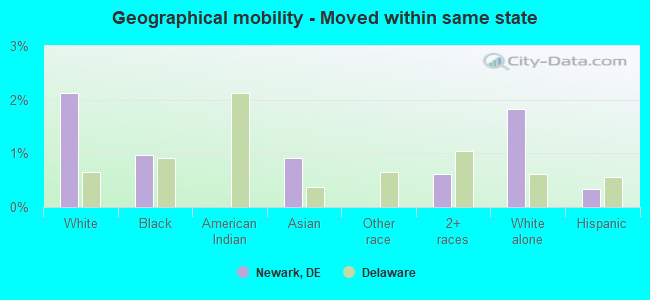
Geographical mobility in Newark Same house 1 year ago 13,396 66.8% White (Caucasian)2,319 75.6% Black or African American101 85.9% American Indian / Alaska Native1,751 74.8% Asian551 67.3% Other race3,517 78.5% Two or more races13,313 66.4% White alone, not Hispanic / Latino2,675 78.1% Hispanic or LatinoMoved within same county 2,739 13.7% White / Caucasian284 9.3% Black or African American9 7.9% American Indian / Alaska Native83 3.5% Asian27 3.3% Other race379 8.5% Two or more races2,927 14.6% White alone, not Hispanic / Latino231 6.8% Hispanic or LatinoMoved within same state 425 2.1% White / Caucasian30 1.0% Black or African American21 0.9% Asian28 0.6% Two or more races366 1.8% White alone, not Hispanic / Latino12 0.3% Hispanic or LatinoMoved from different state 3,174 15.8% White / Caucasian426 13.9% Black or African American6 5.3% American Indian / Alaska Native289 12.4% Asian171 20.9% Other race434 9.7% Two or more races3,116 15.6% White alone, not Hispanic / Latino394 11.5% Hispanic or LatinoMoved from abroad 129 0.6% White28 0.9% Black or African American240 10.2% Asian23 2.8% Other race185 4.1% Two or more races140 0.7% White alone, not Hispanic / Latino80 2.3% Hispanic or Latino
Children Nativity (place of birth) in Newark
Children under 6 years - Living with two parents Both parents native 326 100.0% NativeBoth parents foreign-born 200 85.6% Native34 14.4% Foreign-bornOne native, one foreign-born parent 65 100.0% NativeChildren under 6 years - Living with one parent Native parent 218 100.0% NativeForeign-born parent 12 25.6% Native34 74.4% Foreign-bornChildren 6 to 17 years - Living with two parents Both parents native 1,530 100.0% NativeBoth parents foreign-born 129 57.9% Native94 42.1% Foreign-bornOne native, one foreign-born parent 129 100.0% NativeChildren 6 to 17 years - Living with one parent Native parent 582 100.0% NativeForeign-born parent 34 53.6% Native30 46.4% Foreign-born
Grandparents responsible for own grandchildren in Newark
Grandparents (30 to 59 years) White / Caucasian 18 23.5% Responsible for grandchildren60 76.5% Not responsible for grandchildrenBlack or African American 12 100.0% Not responsible for grandchildrenAsian 5 100.0% Responsible for grandchildrenWhite alone, not Hispanic / Latino 21 31.2% Responsible for grandchildren47 68.8% Not responsible for grandchildrenHispanic or Latino 3 100.0% Not responsible for grandchildrenGrandparents (60 years and over) White / Caucasian 17 17.5% Responsible for grandchildren80 82.5% Not responsible for grandchildrenBlack or African American 2 9.6% Responsible for grandchildren20 90.4% Not responsible for grandchildrenAsian 12 100.0% Not responsible for grandchildrenWhite alone, not Hispanic / Latino 18 17.5% Responsible for grandchildren84 82.5% Not responsible for grandchildren