New Limerick, ME (Maine) Houses and Residents
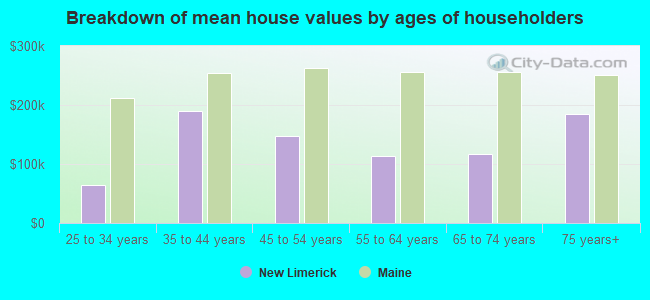
| New Limerick: | $179,898 |
| Maine: | $290,600 |
Total population: 510 (Urban population: 0, Rural population: 528 (11 farm, 517 nonfarm))
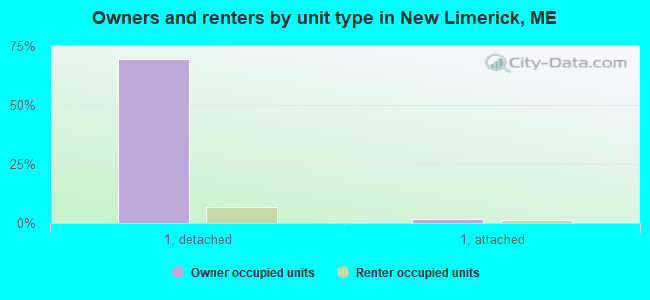
Houses: 385 (225 occupied: 192 owner occupied, 33 renter occupied)
| % of renters here: | 15% |
| State: | 26% |
Housing density: 21 houses/condos per square mile
Median price asked for vacant for-sale houses and condos in 2022 in this county: $39,305.
Median contract rent in 2022: $520 (lower quartile is $447, upper quartile is $867)
Median gross rent in New Limerick, ME in 2022: $640
Housing units in New Limerick with a mortgage: 71 (2 second mortgage, 13 home equity loan, 0 both second mortgage and home equity loan)
Houses without a mortgage: 52


 | This may be the cheapest house I've ever seen (21 replies) |
| Information about Houlton and area?? (15 replies) |
| high taxes in maine (36 replies) |
| Merrill Maine here we come (a continuation of the post abt Aroostook) (6 replies) |
| Thinking about taking a job in Houlton and need advice ... (3 replies) |

Household type by relationship:
Households: 69,865- In family households: 56,286 (14,401 male householders, 5,177 female householders)
15,342 spouses, 17,272 children (15,805 natural, 490 adopted, 977 stepchildren), 906 grandchildren, 388 brothers or sisters, 444 parents, foster children, 351 other relatives, 1,729 non-relatives
- In nonfamily households: 13,579 (5,454 male householders (4,306 living alone)), 5,929 female householders (5,219 living alone)), 2,196 nonrelatives
- In group quarters: 2,005 (780 institutionalized population)
11,978 married couples with children.
3,458 single-parent households (967 men, 2,491 women).
94.6% of residents of New Limerick speak English at home.
5.0% of residents speak other Indo-European language at home (100% speak English very well).
0.4% of residents speak Asian or Pacific Island language at home (100% speak English well).
Foreign born population: 14 (2.9%)
(50.0% of them are naturalized citizens)
| Here: | 6.1 |
| State: | 6.1 |
| Here: | 2.9 |
| State: | 4.0 |
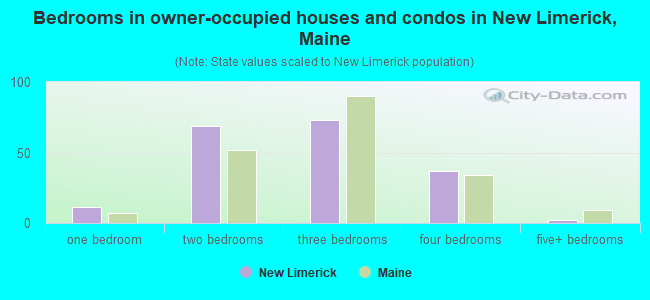
- Bedrooms in owner-occupied houses and condos in New Limerick, Maine
- 0no bedroom
- 111 bedroom
- 692 bedrooms
- 733 bedrooms
- 374 bedrooms
- 25+ bedrooms
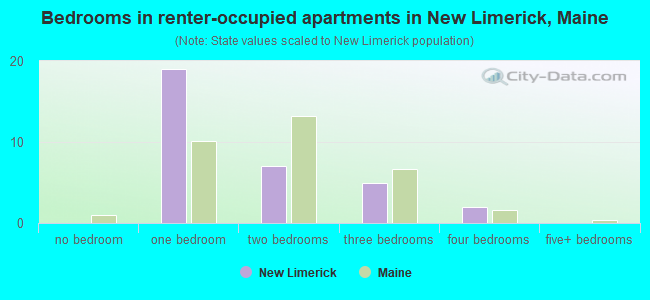
- Bedrooms in renter-occupied apartments in New Limerick, Maine
- 0no bedroom
- 191 bedroom
- 72 bedrooms
- 53 bedrooms
- 24 bedrooms
- 05+ bedrooms
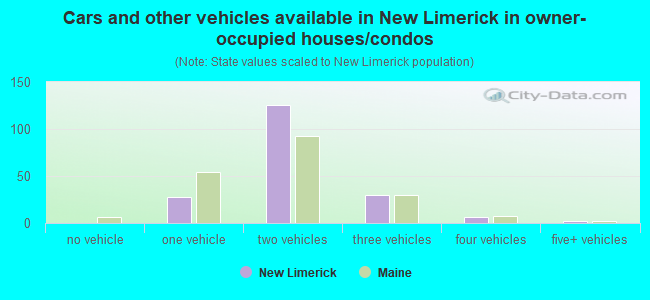
- Cars and other vehicles available in New Limerick in owner-occupied houses/condos
- 0no vehicle
- 281 vehicle
- 1262 vehicles
- 303 vehicles
- 64 vehicles
- 25+ vehicles
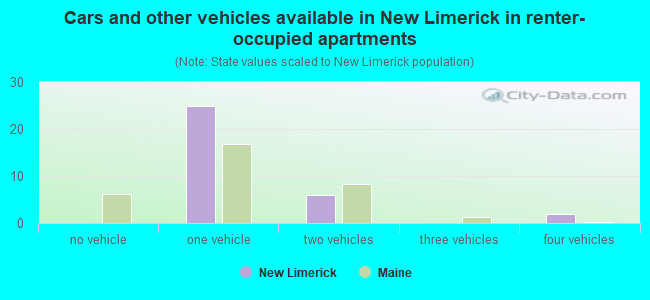
- Cars and other vehicles available in New Limerick in renter-occupied apartments
- 0no vehicle
- 251 vehicle
- 62 vehicles
- 03 vehicles
- 24 vehicles
- 05+ vehicles
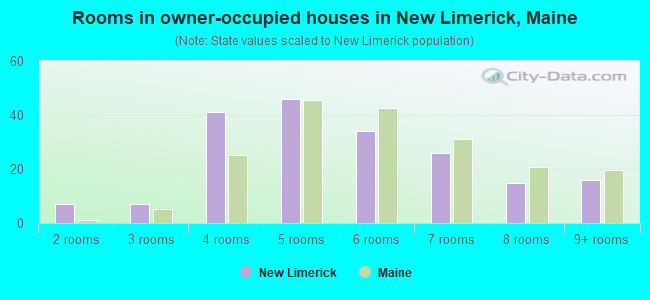
- Rooms in owner-occupied houses in New Limerick, Maine
- 01 room
- 72 rooms
- 73 rooms
- 414 rooms
- 465 rooms
- 346 rooms
- 267 rooms
- 158 rooms
- 169+ rooms
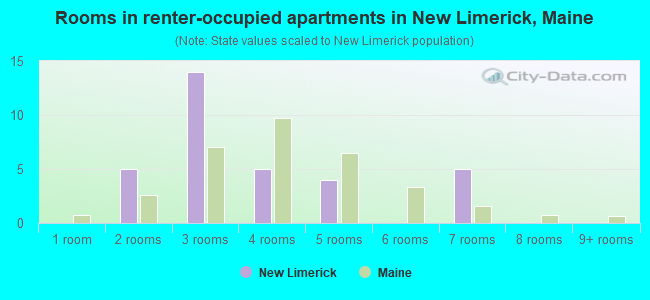
- Rooms in renter-occupied apartments in New Limerick, Maine
- 01 room
- 52 rooms
- 143 rooms
- 54 rooms
- 45 rooms
- 06 rooms
- 57 rooms
- 08 rooms
- 09+ rooms
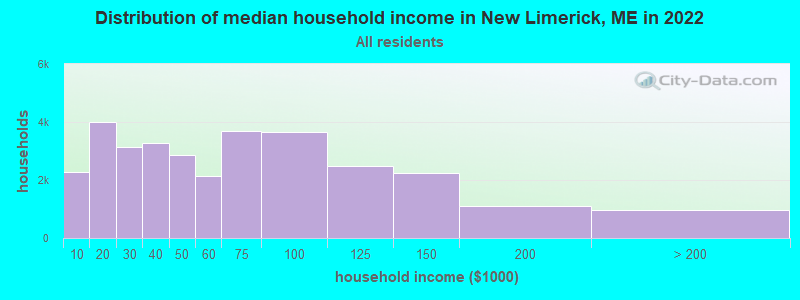
New Limerick, ME household income distribution

- 2,278Less than $10,000
- 3,999$10,000 to $19,999
- 3,130$20,000 to $29,999
- 3,259$30,000 to $39,999
- 2,853$40,000 to $49,999
- 2,127$50,000 to $59,999
- 3,697$60,000 to $74,999
- 3,648$75,000 to $99,999
- 2,493$100,000 to $124,999
- 2,247$125,000 to $149,999
- 1,114$150,000 to $199,999
- 963$200,000 or more
Percentage of workers working in this county: 99.6%
Number of people working at home: 41 (14.4% of all workers)
Travel time to work (commute)
- Less than 5 minutes: 7
- 5 to 9 minutes: 27
- 10 to 14 minutes: 66
- 15 to 19 minutes: 63
- 20 to 24 minutes: 48
- 25 to 29 minutes: 7
- 30 to 34 minutes: 18
- 35 to 39 minutes: 0
- 40 to 44 minutes: 2
- 45 to 59 minutes: 2
- 60 to 89 minutes: 2
- 90 or more minutes: 10
Means of transportation to work:
- Drove a car alone: 219 (85.2%)
- Carpooled: 27 (10.5%)
- Other means: 6 (2.3%)
- Worked at home: 5 (1.9%)
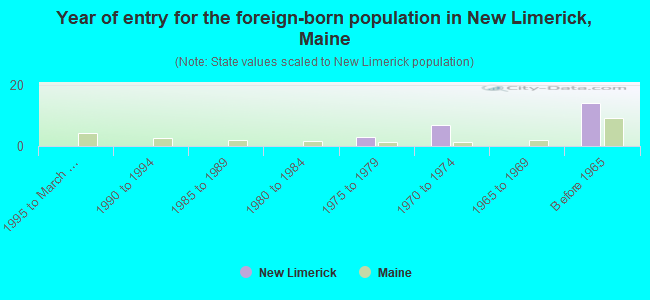
- Year of entry for the foreign-born population in New Limerick, Maine
- 01995 to March 2000
- 01990 to 1994
- 01985 to 1989
- 01980 to 1984
- 31975 to 1979
- 71970 to 1974
- 01965 to 1969
- 14Before 1965
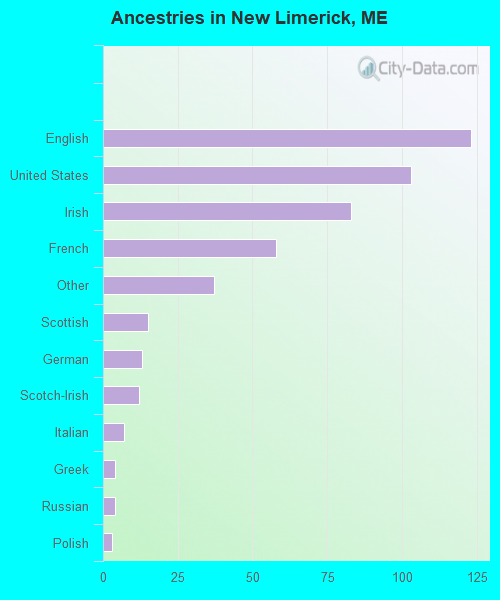
First ancestries reported:
- English: 123 (26.6%)
- United States: 103 (22.3%)
- Irish: 83 (18.0%)
- French: 58 (12.6%)
- Other: 37 (8.0%)
- Scottish: 15 (3.2%)
- German: 13 (2.8%)
- Scotch-Irish: 12 (2.6%)
- Italian: 7 (1.5%)
- Greek: 4 (0.9%)
- Russian: 4 (0.9%)
- Polish: 3 (0.6%)
Most common places of birth for foreign-born residents (%):
| New Limerick: | 70.8% (17) |
| Maine: | 41.4% (15,199) |
| New Limerick: | 12.5% (3) |
| Maine: | 1.3% (486) |
| New Limerick: | 8.3% (2) |
| Maine: | 1.2% (450) |
| New Limerick: | 8.3% (2) |
| Maine: | 0.8% (278) |
Place of birth for U.S.-born residents:
- This state: 448
- Other state: 56
- Northeast: 32
- Midwest: 0
- South: 20
- West: 4
80% of New Limerick residents lived in the same house 5 years ago.
Out of people who lived in different houses, 79% lived in this county.
Out of people who lived in different counties, 48% lived in Maine.
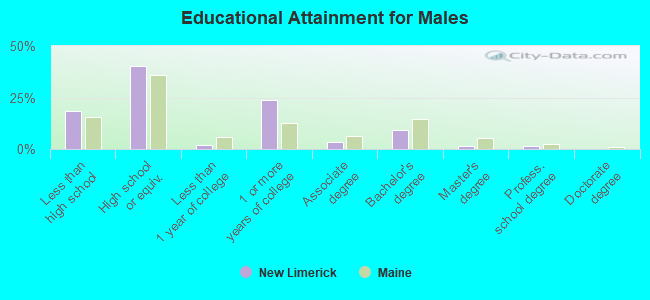
Education attainment for males 25 years and older:
- No schooling: 0
- Nursery to 4th grade: 0
- 5th and 6th grade: 2
- 7th and 8th grade: 22
- 9th grade: 2
- 10th grade: 5
- 11th grade: 2
- 12th grade, no diploma: 3
- High school graduate (or equivalency): 79
- Less than 1 year of college: 4
- Some college more than 1 year, no degree: 47
- Associate degree: 7
- Bachelor's degree: 18
- Master's degree: 3
- Professional school degree: 3
- Doctorate degree: 0
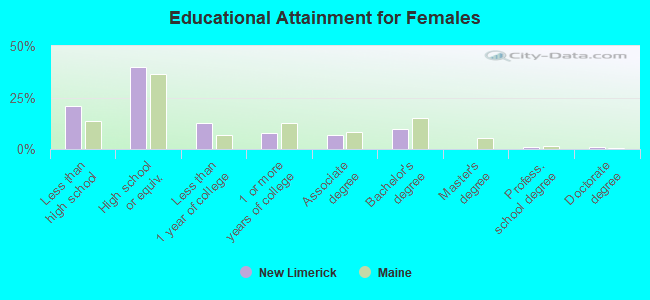
Education attainment for females 25 years and older:
- No schooling: 0
- Nursery to 4th grade: 0
- 5th and 6th grade: 5
- 7th and 8th grade: 9
- 9th grade: 9
- 10th grade: 5
- 11th grade: 10
- 12th grade, no diploma: 2
- High school graduate (or equivalency): 76
- Less than 1 year of college: 24
- Some college more than 1 year, no degree: 15
- Associate degree: 13
- Bachelor's degree: 19
- Master's degree: 0
- Professional school degree: 2
- Doctorate degree: 2


Housing units in structures:
- One, detached: 325
- One, attached: 9
- 3 or 4: 11
- 10 to 19: 4
- Mobile homes: 36
Median worth of mobile homes: $81,066
Housing units lacking complete kitchen facilities: 2.6%
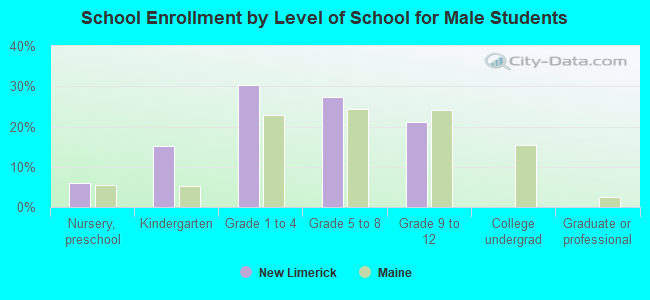
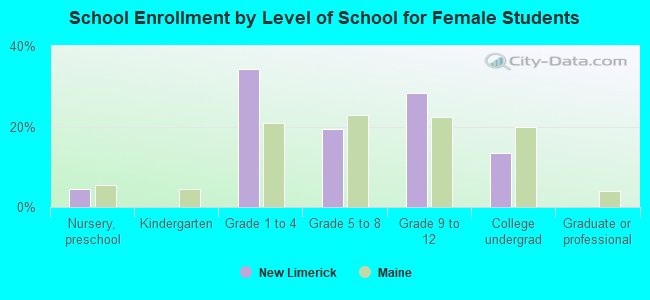
Private vs. public school enrollment:
| Here: | 21.8% |
| Maine: | 6.9% |
| Here: | 26.9% |
| Maine: | 8.9% |
| Here: | 0.0% |
| Maine: | 28.3% |