Naperville, IL (Illinois) Houses and Residents
Estimated median house or condo value in 2022: $484,400 (it was $248,200 in 2000 )
Naperville:
$484,400Illinois:
$251,600
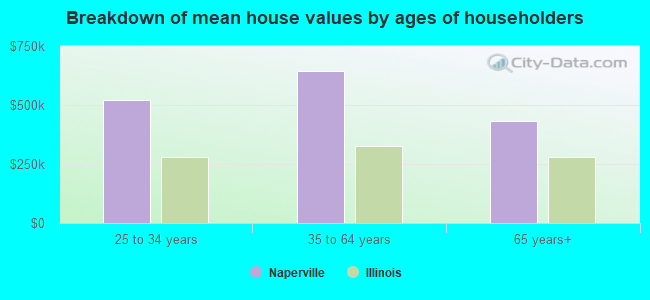
Lower value quartile - upper value quartile: $365,100 - $655,300Mean price in 2022: Detached houses: $576,418 Here:
$576,418State:
$310,164
Townhouses or other attached units: $304,725 Here:
$304,725State:
$286,230
In 2-unit structures: $583,588 Here:
$583,588State:
$299,638
In 3-to-4-unit structures: $250,263 Here:
$250,263State:
$330,907
In 5-or-more-unit structures: $182,300 Here:
$182,300State:
$318,887
Mobile homes: $64,171 Here:
$64,171State:
$78,855
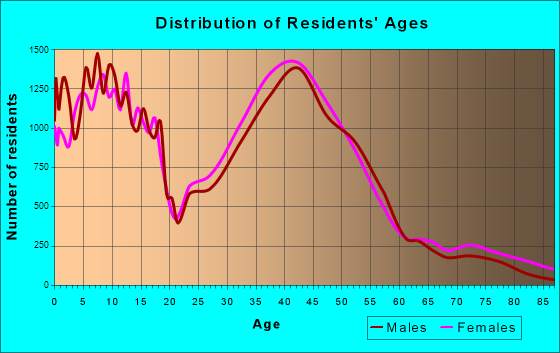
Total population: 146,128 (Urban population: 128,300, Rural population: 0)
Houses: 56,028 (54,014 occupied: 41,375 owner occupied, 12,639 renter occupied )
% of renters here:
23%State:
33%
Housing density: 1,584 houses/condos per square mile
Median price asked for vacant for-sale houses and condos in 2022: $423,500.
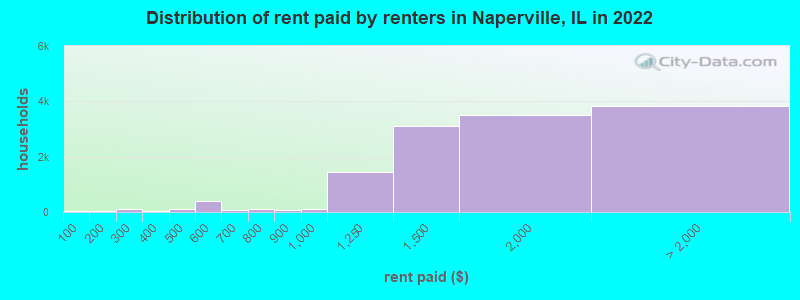
Median contract rent in 2022: $1,609 (lower quartile is $1,320, upper quartile is $1,967)
Median rent asked for vacant for-rent units in 2022: $2,870
Median gross rent in Naperville, IL in 2022: $1,761
Housing units in Naperville with a mortgage: 25,859 (2,676 second mortgage, 106 home equity loan, 2,425 both second mortgage and home equity loan )Houses without a mortgage: 436
Median household income for houses/condos with a mortgage: $184,983
Median household income for apartments without a mortgage: $138,707
Median monthly housing costs: $1,900
Data:
Median house or condo value ($)
Median house or condo value ($ change since 2000)
Median house or condo value ($) - White
Median house or condo value ($) - Black or African American
Median house or condo value ($) - Asian
Median house or condo value ($) - Hispanic or Latino
Median house or condo value ($) - American Indian and Alaska Native
Median house or condo value ($) - Multirace
Median house or condo value ($) - Other Race
Median price asked for mobile homes ($)
Household density (households per square mile)
Mean house or condo value by units in structure - 1, detached ($)
Mean house or condo value by units in structure - 1, attached ($)
Mean house or condo value by units in structure - 2 ($)
Mean house or condo value by units in structure by units in structure - 3 or 4 ($)
Mean house or condo value by units in structure - 5 or more ($)
Mean house or condo value by units in structure - Boat, RV, van, etc. ($)
Mean house or condo value by units in structure - Mobile home ($)
Median contract rent ($)
Median contract rent - Lower quartile ($)
Median contract rent - Upper quartile ($)
Median gross rent ($)
Urban houses (%)
Rural houses (%)
Houses occupied (%)
Houses occupied (% change since 2000)
Houses owner occupied (%)
Houses owner occupied (% change since 2000)
Houses renter occupied (%)
Houses renter occupied (% change since 2000)
Vacant housing units - For rent (%)
Vacant housing units - For rent (% change since 2000)
Vacant housing units - For sale only (%)
Vacant housing units - For sale only (% change since 2000)
Vacant housing units - Rented or sold, not occupied (%)
Vacant housing units - Rented or sold, not occupied (% change since 2000)
Vacant housing units - For seasonal, recreational, or occasional use (%)
Vacant housing units - For seasonal, recreational, or occasional use (% change since 2000)
Vacant housing units - For migrant workers (%)
Vacant housing units - For migrant workers (% change since 2000)
Vacant housing units - Other vacant (%)
Vacant housing units - Other vacant (% change since 2000)
Median monthly housing costs ($)
Median household income for houses/condos with a mortgage ($)
Median household income for houses/condos without a mortgage ($)
Median household income ($)
Median household income ($) - White
Median household income ($) - Black or African American
Median household income ($) - Asian
Median household income ($) - Hispanic or Latino
Median household income ($) - American Indian and Alaska Native
Median household income ($) - Multirace
Median household income ($) - Other Race
Mortgage status - with mortgage (%)
Mortgage status - with second mortgage (%)
Mortgage status - with home equity loan (%)
Mortgage status - with both second mortgage and home equity loan (%)
Mortgage status - without a mortgage (%)
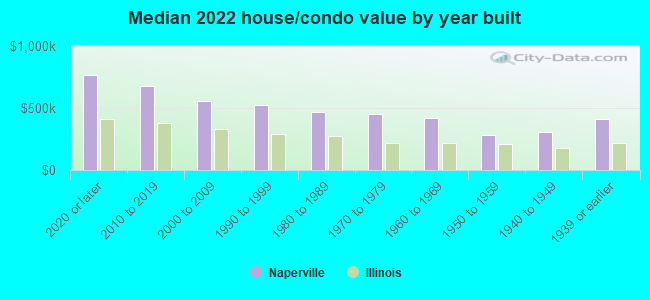
Median year house/condo built
Median year apartment built
Household type by relationship - Male householder living alone (%)
Household type by relationship - Male householder not living alone (%)
Household type by relationship - Female householder living alone (%)
Household type by relationship - Female householder not living alone (%)
Household type by relationship - Opposite-Sex spouse (%)
Household type by relationship - Same-Sex spouse (%)
Household type by relationship - Opposite-Sex unmarried partner (%)
Household type by relationship - Same-Sex unmarried partner (%)
Household type by relationship - In group quarters (%)
Size of family households - 2-person household (%)
Size of family households - 3-person household (%)
Size of family households - 4-person household (%)
Size of family households - 5-person household (%)
Size of family households - 6-person household (%)
Size of family households - 7-or-more-person household (%)
Size of nonfamily households - 1-person household (%)
Size of nonfamily households - 2-person household (%)
Size of nonfamily households - 3-person household (%)
Size of nonfamily households - 4-person household (%)
Size of nonfamily households - 5-person household (%)
Size of nonfamily households - 6-person household (%)
Size of nonfamily households - 7-or-moreperson household (%)
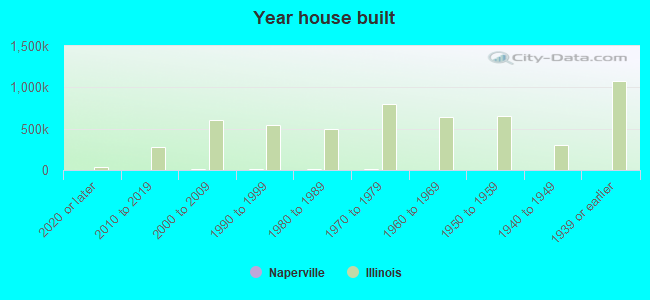
Year house built - Built 2010 or later (%)
Year house built - Built 2000 to 2009 (%)
Year house built - Built 1990 to 1999 (%)
Year house built - Built 1980 to 1989 (%)
Year house built - Built 1970 to 1979 (%)
Year house built - Built 1960 to 1969 (%)
Year house built - Built 1950 to 1959 (%)
Year house built - Built 1940 to 1949 (%)
Year house built - Built 1939 or earlier (%)
Median number of rooms in houses and condos
Median number of rooms in apartments
Median number of bedrooms in owner occupied houses
Mean number of bedrooms in owner occupied houses
Median number of bedrooms in renter occupied houses
Mean number of bedrooms in renter occupied houses
Median number of vehichles in owner occupied houses
Mean number of vehichles in owner occupied houses
Median number of vehichles in renter occupied houses
Mean number of vehichles in renter occupied houses
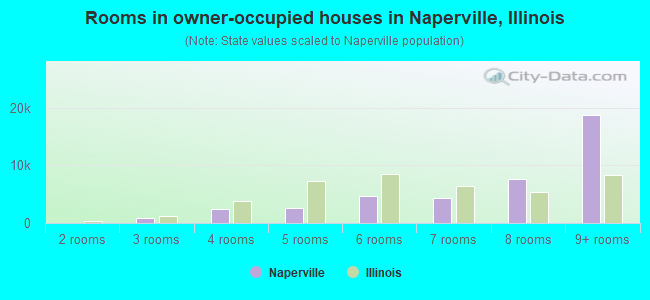
Rooms in owner-occupied houses - 1 room (%)
Rooms in owner-occupied houses - 2 rooms (%)
Rooms in owner-occupied houses - 3 rooms (%)
Rooms in owner-occupied houses - 4 rooms (%)
Rooms in owner-occupied houses - 5 rooms (%)
Rooms in owner-occupied houses - 6 rooms (%)
Rooms in owner-occupied houses - 7 rooms (%)
Rooms in owner-occupied houses - 8 rooms (%)
Rooms in owner-occupied houses - 9+ rooms (%)
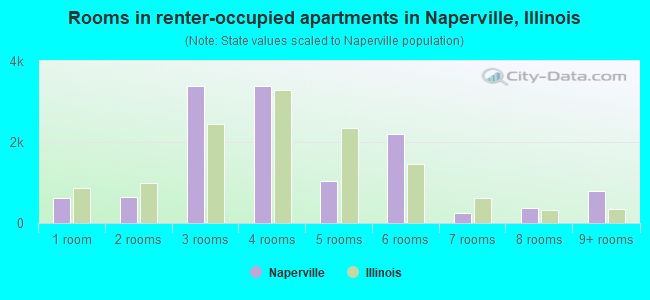
Rooms in renter-occupied houses - 1 room (%)
Rooms in renter-occupied houses - 2 rooms (%)
Rooms in renter-occupied houses - 3 rooms (%)
Rooms in renter-occupied houses - 4 rooms (%)
Rooms in renter-occupied houses - 5 rooms (%)
Rooms in renter-occupied houses - 6 rooms (%)
Rooms in renter-occupied houses - 7 rooms (%)
Rooms in renter-occupied houses - 8 rooms (%)
Rooms in renter-occupied houses - 9+ rooms (%)
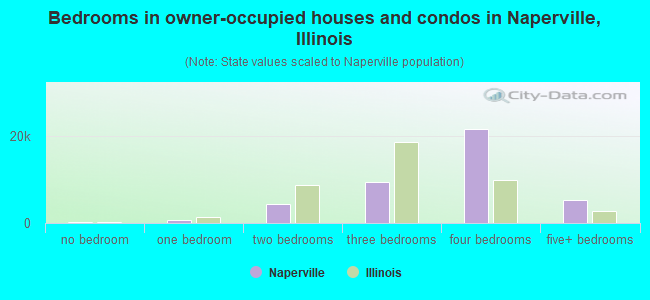
Bedrooms in owner-occupied houses - no bedrooms (%)
Bedrooms in owner-occupied houses - 1 bedroom (%)
Bedrooms in owner-occupied houses - 2 bedrooms (%)
Bedrooms in owner-occupied houses - 3 bedrooms (%)
Bedrooms in owner-occupied houses - 4 bedrooms (%)
Bedrooms in owner-occupied houses - 5+ bedrooms (%)
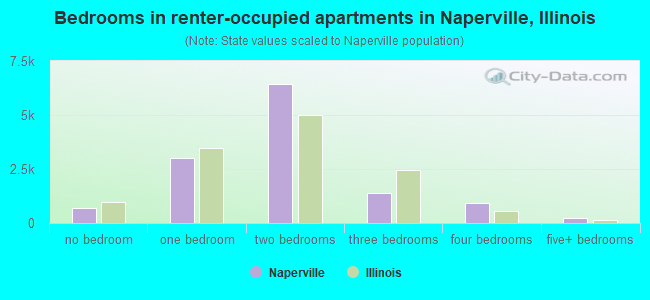
Bedrooms in renter-occupied houses - no bedrooms (%)
Bedrooms in renter-occupied houses - 1 bedroom (%)
Bedrooms in renter-occupied houses - 2 bedrooms (%)
Bedrooms in renter-occupied houses - 3 bedrooms (%)
Bedrooms in renter-occupied houses - 4 bedrooms (%)
Bedrooms in renter-occupied houses - 5+ bedrooms (%)
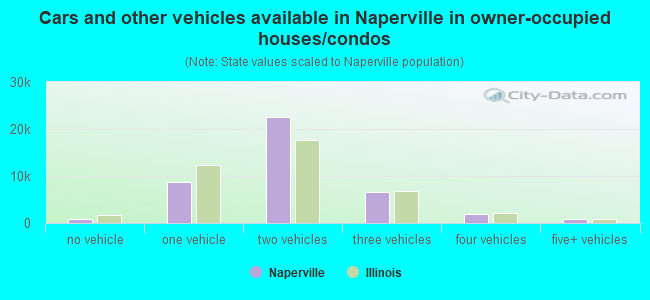
Vehicles available in owner-occupied houses - no vehicle available (%)
Vehicles available in owner-occupied houses - 1 vehicle available(%)
Vehicles available in owner-occupied houses - 2 Vehicles available (%)
Vehicles available in owner-occupied houses - 3 Vehicles available (%)
Vehicles available in owner-occupied houses - 4 Vehicles available (%)
Vehicles available in owner-occupied houses - 5+ Vehicles available (%)
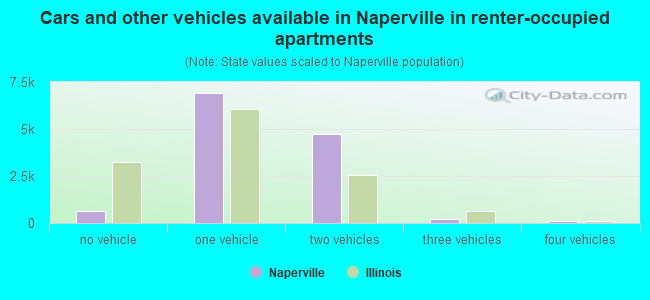
Vehicles available in renter-occupied houses - no vehicle available (%)
Vehicles available in renter-occupied houses - 1 vehicle available (%)
Vehicles available in renter-occupied houses - 2 Vehicles available (%)
Vehicles available in renter-occupied houses - 3 Vehicles available (%)
Vehicles available in renter-occupied houses - 4 Vehicles available (%)
Vehicles available in renter-occupied houses - 5+ Vehicles available (%)
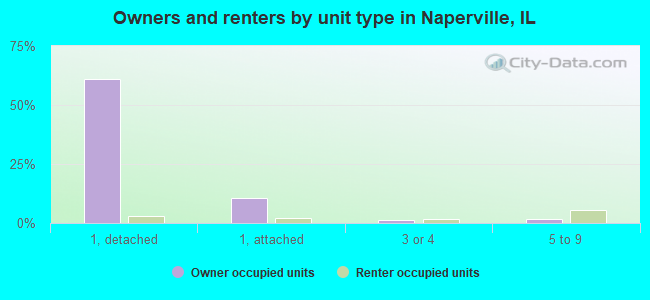
Housing units in structures - 1, detached (%)
Housing units in structures - 1, attached (%)
Housing units in structures - 2 (%)
Housing units in structures - 3 or 4 (%)
Housing units in structures - 5 to 9 (%)
Housing units in structures - 10 to 19 (%)
Housing units in structures - 20 to 49 (%)
Housing units in structures - 50 or more (%)
Housing units in structures - Mobile home (%)
Housing units in structures - Boat, RV, van, etc. (%)
Housing units in structures - Owners - 1, detached (%)
Housing units in structures - Owners - 1, attached (%)
Housing units in structures - Owners - 2 (%)
Housing units in structures - Owners - 3 or 4 (%)
Housing units in structures - Owners - 5 to 9 (%)
Housing units in structures - Owners - 10 to 19 (%)
Housing units in structures - Owners - 20 to 49 (%)
Housing units in structures - Owners - 50 or more (%)
Housing units in structures - Owners - Mobile home (%)
Housing units in structures - Owners - Boat, RV, van, etc. (%)
Housing units in structures - Renters - 1, detached (%)
Housing units in structures - Renters - 1, attached (%)
Housing units in structures - Renters - 2 (%)
Housing units in structures - Renters - 3 or 4 (%)
Housing units in structures - Renters - 5 to 9 (%)
Housing units in structures - Renters - 10 to 19 (%)
Housing units in structures - Renters - 20 to 49 (%)
Housing units in structures - Renters - 50 or more (%)
Housing units in structures - Renters - Mobile home (%)
Housing units in structures - Renters - Boat, RV, van, etc. (%)
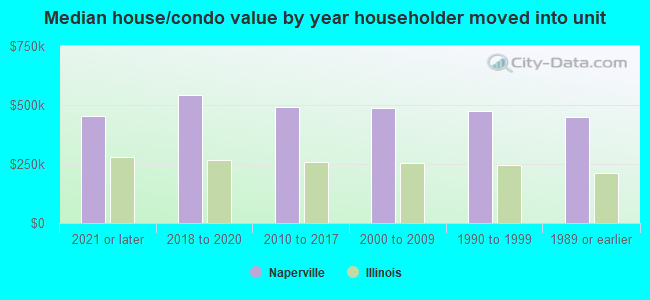
House/condo owner moved in on average (years ago)
Renter moved in on average (years ago)
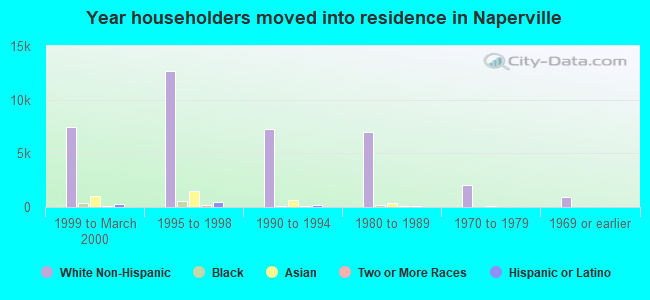
Year householder moved into unit - Moved in 1999 to March 2000 (%)
Year householder moved into unit - Moved in 1999 to March 2000 (%) - White
Year householder moved into unit - Moved in 1999 to March 2000 (%) - Black or African American
Year householder moved into unit - Moved in 1999 to March 2000 (%) - Asian
Year householder moved into unit - Moved in 1999 to March 2000 (%) - Hispanic or Latino
Year householder moved into unit - Moved in 1999 to March 2000 (%) - American Indian and Alaska Native
Year householder moved into unit - Moved in 1999 to March 2000 (%) - Multirace
Year householder moved into unit - Moved in 1999 to March 2000 (%) - Other Race
Year householder moved into unit - Moved in 1995 to 1998 (%)
Year householder moved into unit - Moved in 1995 to 1998 (%) - White
Year householder moved into unit - Moved in 1995 to 1998 (%) - Black or African American
Year householder moved into unit - Moved in 1995 to 1998 (%) - Asian
Year householder moved into unit - Moved in 1995 to 1998 (%) - Hispanic or Latino
Year householder moved into unit - Moved in 1995 to 1998 (%) - American Indian and Alaska Native
Year householder moved into unit - Moved in 1995 to 1998 (%) - Multirace
Year householder moved into unit - Moved in 1995 to 1998 (%) - Other Race
Year householder moved into unit - Moved in 1990 to 1994 (%)
Year householder moved into unit - Moved in 1990 to 1994 (%) - White
Year householder moved into unit - Moved in 1990 to 1994 (%) - Black or African American
Year householder moved into unit - Moved in 1990 to 1994 (%) - Asian
Year householder moved into unit - Moved in 1990 to 1994 (%) - Hispanic or Latino
Year householder moved into unit - Moved in 1990 to 1994 (%) - American Indian and Alaska Native
Year householder moved into unit - Moved in 1990 to 1994 (%) - Multirace
Year householder moved into unit - Moved in 1990 to 1994 (%) - Other Race
Year householder moved into unit - Moved in 1980 to 1989 (%)
Year householder moved into unit - Moved in 1980 to 1989 (%) - White
Year householder moved into unit - Moved in 1980 to 1989 (%) - Black or African American
Year householder moved into unit - Moved in 1980 to 1989 (%) - Asian
Year householder moved into unit - Moved in 1980 to 1989 (%) - Hispanic or Latino
Year householder moved into unit - Moved in 1980 to 1989 (%) - American Indian and Alaska Native
Year householder moved into unit - Moved in 1980 to 1989 (%) - Multirace
Year householder moved into unit - Moved in 1980 to 1989 (%) - Other Race
Year householder moved into unit - Moved in 1970 to 1979 (%)
Year householder moved into unit - Moved in 1970 to 1979 (%) - White
Year householder moved into unit - Moved in 1970 to 1979 (%) - Black or African American
Year householder moved into unit - Moved in 1970 to 1979 (%) - Asian
Year householder moved into unit - Moved in 1970 to 1979 (%) - Hispanic or Latino
Year householder moved into unit - Moved in 1970 to 1979 (%) - American Indian and Alaska Native
Year householder moved into unit - Moved in 1970 to 1979 (%) - Multirace
Year householder moved into unit - Moved in 1970 to 1979 (%) - Other Race
Year householder moved into unit - Moved in 1969 or earlier (%)
Year householder moved into unit - Moved in 1969 or earlier (%) - White
Year householder moved into unit - Moved in 1969 or earlier (%) - Black or African American
Year householder moved into unit - Moved in 1969 or earlier (%) - Asian
Year householder moved into unit - Moved in 1969 or earlier (%) - Hispanic or Latino
Year householder moved into unit - Moved in 1969 or earlier (%) - American Indian and Alaska Native
Year householder moved into unit - Moved in 1969 or earlier (%) - Multirace
Year householder moved into unit - Moved in 1969 or earlier (%) - Other Race
Housing units lacking complete plumbing facilities (%)
Housing units lacking complete kitchen facilities (%)
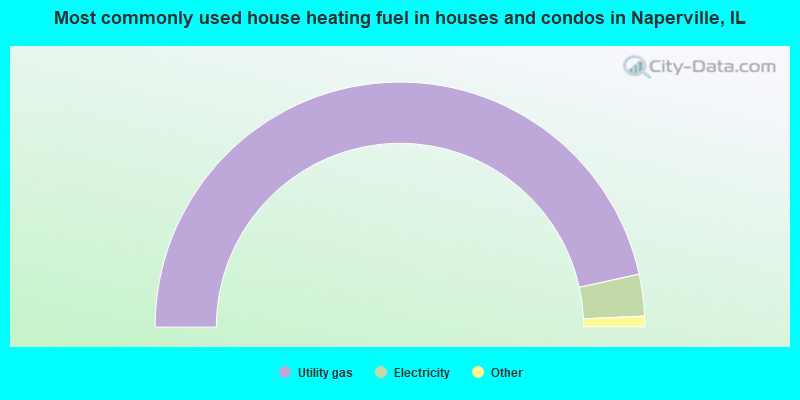
House heating fuel used in houses and condos - Utility gas (%)
House heating fuel used in houses and condos - Bottled, tank, or LP gas (%)
House heating fuel used in houses and condos - Electricity (%)
House heating fuel used in houses and condos - Fuel oil, kerosene, etc. (%)
House heating fuel used in houses and condos - Coal or coke (%)
House heating fuel used in houses and condos - Wood (%)
House heating fuel used in houses and condos - Solar energy (%)
House heating fuel used in houses and condos - Other fuel (%)
House heating fuel used in houses and condos - No fuel used (%)
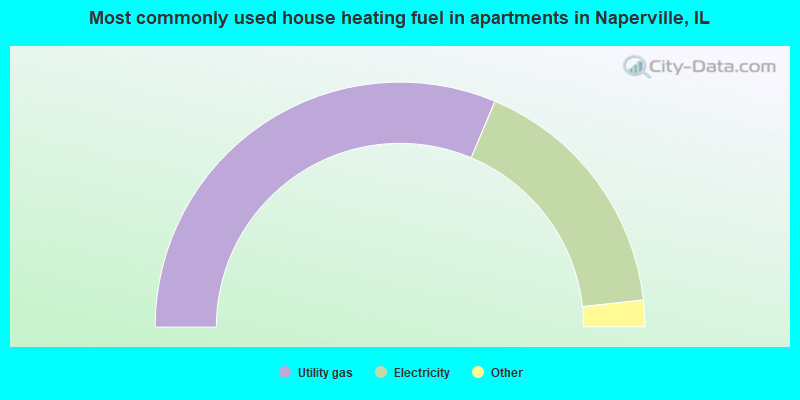
House heating fuel used in apartments - Utility gas (%)
House heating fuel used in apartments - Bottled, tank, or LP gas (%)
House heating fuel used in apartments - Electricity (%)
House heating fuel used in apartments - Fuel oil, kerosene, etc. (%)
House heating fuel used in apartments - Coal or coke (%)
House heating fuel used in apartments - Wood (%)
House heating fuel used in apartments - Solar energy (%)
House heating fuel used in apartments - Other fuel (%)
House heating fuel used in apartments - No fuel used (%)
Latest news about housing in Naperville, IL collected exclusively by city-data.com from local newspapers, TV, and radio stations
Median year house/condo built: 1989Median year apartment built: 1990Household type by relationship:
Households: 148,508
Male householders: 29,366 (4,173 living alone ), Female householders: 24,648 (5,617 living alone )35,362 spouses (35,028 opposite-sex spouses ), 998 unmarried partners , (998 opposite-sex unmarried partners ), 47,728 children (45,968 natural , 497 adopted , 1,263 stepchildren ), 1,242 grandchildren , 482 brothers or sisters , 2,306 parents , 0 foster children , 648 other relatives , 3,013 non-relatives In group quarters: 2,715
Size of family households: 18,325 2-persons , 10,243 3-persons , 8,743 4-persons , 3,190 5-persons , 1,005 6-persons , 441 7-or-more-persons .
Size of nonfamily households: 9,790 1-person , 1,762 2-persons , 44 3-persons , 423 4-persons , 48 6-persons .
30,111 married couples with children. single-parent households (474 men , 4,290 women ).
73.2% of residents of Naperville speak English at home. of residents speak Spanish at home (75% speak English very well , 10% speak English well , 10% speak English not well , 5% don't speak English at all ).of residents speak other Indo-European language at home (79% speak English very well , 15% speak English well , 5% speak English not well , 1% don't speak English at all ).of residents speak Asian or Pacific Island language at home (73% speak English very well , 17% speak English well , 6% speak English not well , 4% don't speak English at all ).of residents speak other language at home (93% speak English very well , 7% speak English well ).
Foreign born population: 32,600 (22.0%)of them are naturalized citizens )
Median number of rooms in houses and condos:
Median number of rooms in apartments
Owner-occupied Renter-occupied
Rooms in owner-occupied houses in Naperville, Illinois
76 1 room 83 2 rooms 831 3 rooms 2,483 4 rooms 2,644 5 rooms 4,712 6 rooms 4,281 7 rooms 7,546 8 rooms 18,719 9+ rooms
Rooms in renter-occupied apartments in Naperville, Illinois
606 1 room 650 2 rooms 3,372 3 rooms 3,390 4 rooms 1,044 5 rooms 2,186 6 rooms 240 7 rooms 373 8 rooms 778 9+ rooms
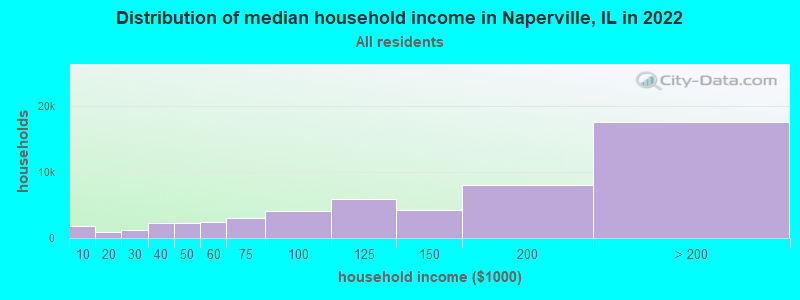
Naperville, IL household income distribution 1,756 Less than $10,000959 $10,000 to $19,9991,268 $20,000 to $29,9992,295 $30,000 to $39,9992,263 $40,000 to $49,9992,418 $50,000 to $59,9993,032 $60,000 to $74,9994,057 $75,000 to $99,9995,954 $100,000 to $124,9994,312 $125,000 to $149,9998,062 $150,000 to $199,99917,638 $200,000 or more
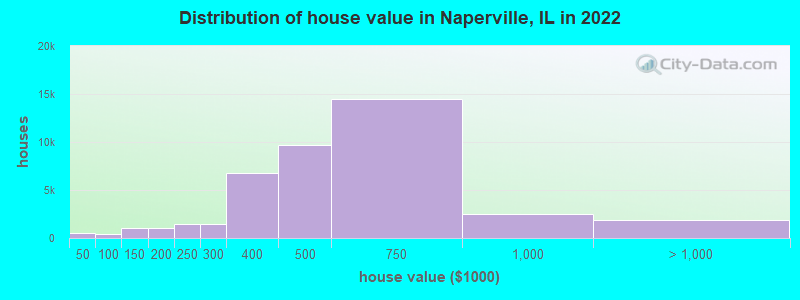
Home value of owner - occupied houses in 2022 in Naperville, IL 273 Less than $10,00028 $10,000 to $14,999146 $20,000 to $24,99923 $30,000 to $34,99935 $35,000 to $39,99939 $40,000 to $49,999107 $60,000 to $69,99920 $70,000 to $79,99952 $80,000 to $89,999178 $90,000 to $99,999419 $100,000 to $124,999602 $125,000 to $149,999532 $150,000 to $174,999519 $175,000 to $199,9991,452 $200,000 to $249,9991,487 $250,000 to $299,9996,817 $300,000 to $399,9999,729 $400,000 to $499,99914,509 $500,000 to $749,9992,548 $750,000 to $999,9991,517 $1,000,000 to $1,499,999166 $1,500,000 to $1,999,999235 $2,000,000 or moreRent paid by renters in 2022 in Naperville, IL 37 Less than $10037 $100 to $14913 $150 to $19949 $200 to $24942 $250 to $29937 $350 to $39932 $400 to $44967 $450 to $499162 $500 to $549218 $550 to $59949 $600 to $64924 $650 to $69920 $700 to $74976 $750 to $79981 $800 to $899100 $900 to $9991,444 $1,000 to $1,2493,105 $1,250 to $1,4993,518 $1,500 to $1,9992,013 $2,000 to $2,499467 $2,500 to $2,999559 $3,000 to $3,499489 $3,500 or more292 No cash rent
Percentage of workers working in this county: 62.4%Number of people working at home: 20,265 (26.8% of all workers )
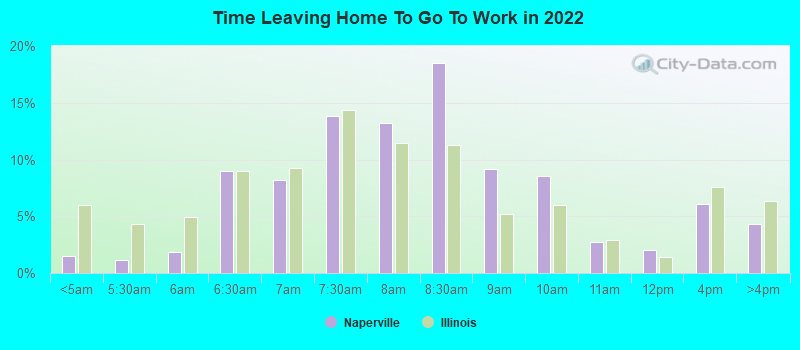
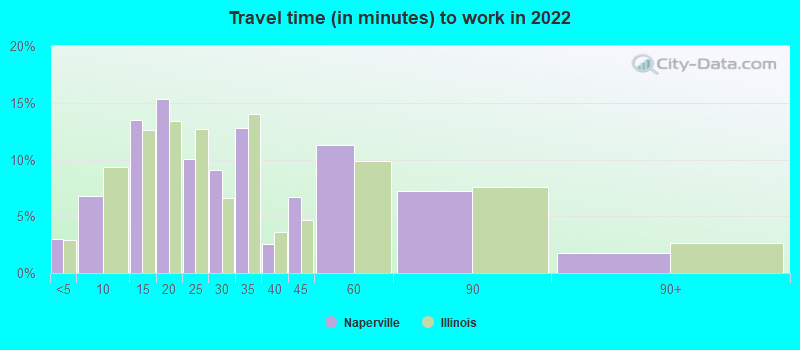
Travel time to work (commute)
Less than 5 minutes: 1,4725 to 9 minutes: 4,31110 to 14 minutes: 6,42615 to 19 minutes: 8,32620 to 24 minutes: 7,94325 to 29 minutes: 4,34830 to 34 minutes: 5,96935 to 39 minutes: 1,47040 to 44 minutes: 3,38945 to 59 minutes: 5,62560 to 89 minutes: 4,50390 or more minutes: 1,569
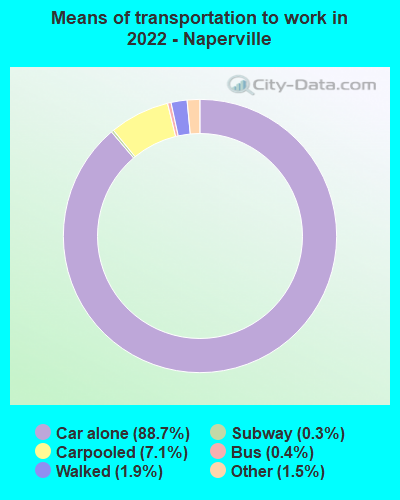
Means of transportation to work:
Drove a car alone: 64,331 (69.3%)Carpooled: 5,180 (5.6%)Bus : 260 (0.3%)Long-distance train or commuter rail : 184 (0.2%)Light rail, streetcar or trolley : 60 (0.1%)Taxi: 1,088 (1.2%)Bicycle: 54 (0.1%)Walked: 1,353 (1.5%)Worked at home: 20,265 (21.8%)
Unemployment by race in 2022
Unemployment rate for White non-Hispanic residents 4.1% Males2.8% FemalesUnemployment rate for Black residents 8.9% Males17.9% FemalesUnemployment rate for Asian residents 3.8% Males4.3% FemalesUnemployment rate for other race residents 3.6% MalesUnemployment rate for two or more race residents 4.1% Males1.8% FemalesUnemployment rate for Hispanic or Latino residents 6.2% Males2.1% Females
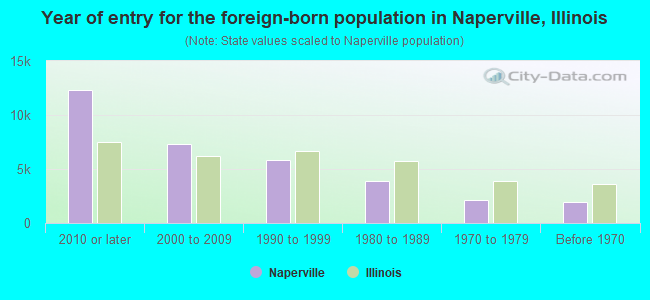
Year of entry for the foreign-born population in Naperville, Illinois
12,361 2010 or later 7,360 2000 to 2009 5,841 1990 to 1999 3,854 1980 to 1989 2,175 1970 to 1979 1,958 Before 1970
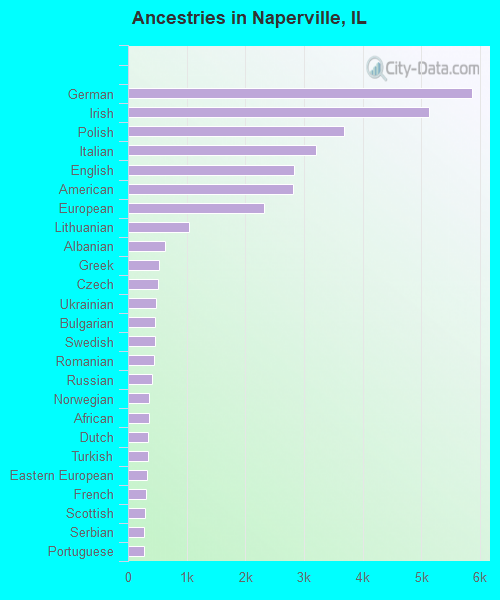
First ancestries reported:
German: 5,862 (8.4%)
Irish: 5,129 (7.3%)
Polish: 3,688 (5.3%)
Italian: 3,210 (4.6%)
English: 2,834 (4.0%)
American: 2,810 (4.0%)
European: 2,316 (3.3%)
Lithuanian: 1,048 (1.5%)
Albanian: 624 (0.9%)
Greek: 523 (0.7%)
Czech: 514 (0.7%)
Ukrainian: 482 (0.7%)
Bulgarian: 467 (0.7%)
Swedish: 458 (0.7%)
Romanian: 436 (0.6%)
Russian: 406 (0.6%)
Norwegian: 361 (0.5%)
African: 352 (0.5%)
Dutch: 346 (0.5%)
Turkish: 336 (0.5%)
Eastern European: 319 (0.5%)
French: 312 (0.4%)
Scottish: 289 (0.4%)
Serbian: 281 (0.4%)
Portuguese: 272 (0.4%)
French Canadian: 245 (0.3%)
Palestinian: 217 (0.3%)
British: 197 (0.3%)
Iranian: 177 (0.3%)
Scotch-Irish: 166 (0.2%)
Croatian: 162 (0.2%)
Nigerian: 159 (0.2%)
Hungarian: 140 (0.2%)
Haitian: 131 (0.2%)
Slovak: 127 (0.2%)
Canadian: 113 (0.2%)
Danish: 110 (0.2%)
Lebanese: 102 (0.1%)
Northern European: 91 (0.1%)
Austrian: 91 (0.1%)
Macedonian: 90 (0.1%)
Latvian: 83 (0.1%)
Czechoslovakian: 80 (0.1%)
South African: 72 (0.1%)
Zimbabwean: 68 (0.10%)
Moroccan: 66 (0.09%)
Jordanian: 64 (0.09%)
Assyrian: 62 (0.09%)
Finnish: 53 (0.08%)
Scandinavian: 46 (0.07%)
Swiss: 46 (0.07%)
Estonian: 45 (0.06%)
Kenyan: 43 (0.06%)
Welsh: 41 (0.06%)
Brazilian: 40 (0.06%)
Yugoslavian: 33 (0.05%)
Luxembourger: 32 (0.05%)
Australian: 24 (0.03%)
Cypriot: 22 (0.03%)
Ghanaian: 21 (0.03%)
Belgian: 21 (0.03%)
Jamaican: 17 (0.02%)
Egyptian: 15 (0.02%)
Carpatho Rusyn: 15 (0.02%)
Ethiopian: 14 (0.02%)
Armenian: 13 (0.02%)
Basque: 13 (0.02%)
Slavic: 12 (0.02%)
Maltese: 11 (0.02%)
Slovene: 9 (0.01%)
Syrian: 6 (0.01%)
West Indian: 5 (0.01%)
Most common places of birth for foreign-born residents (%): India Naperville:
38.8% (12,718)Illinois:
9.2% (166,409)
China, excluding Hong Kong and Taiwan Naperville:
10.2% (3,343)Illinois:
4.1% (74,364)
Mexico Naperville:
5.2% (1,695)Illinois:
34.7% (626,958)
Pakistan Naperville:
3.3% (1,086)Illinois:
1.6% (29,519)
Korea Naperville:
3.1% (1,011)Illinois:
2.2% (40,393)
Philippines Naperville:
2.5% (819)Illinois:
5.2% (93,003)
Taiwan Naperville:
2.0% (671)Illinois:
0.5% (8,235)
Poland Naperville:
2.0% (661)Illinois:
6.9% (124,474)
Lithuania Naperville:
1.7% (552)Illinois:
0.6% (10,249)
United Kingdom, excluding England and Scotland Naperville:
1.6% (532)Illinois:
0.5% (9,671)
Place of birth for U.S.-born residents:
This state: 78,869Other state: 34,955Northeast: 8,961Midwest: 14,154South: 5,555West: 6,285 89.7% of Naperville residents lived in the same house 1 years ago.
Out of people who lived in different houses, 30.7% lived in this county.
Out of people who lived in different counties, 68.1% lived in Illinois.
Naperville:
89.7%State average:
88.3%
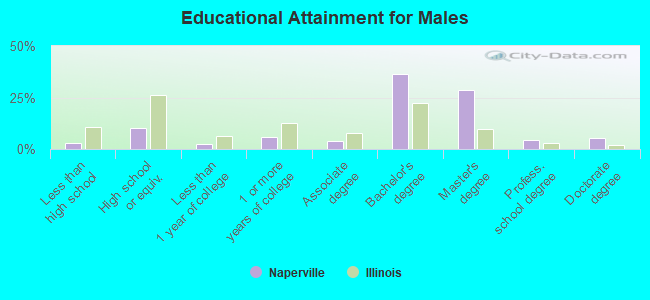
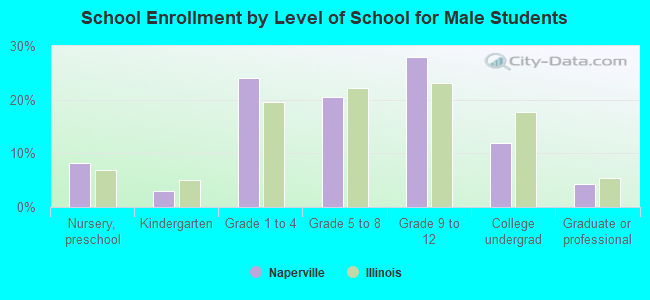
Education attainment for males 25 years and older:
No schooling: 549Nursery to 4th grade: 885th and 6th grade: 327th and 8th grade: 2579th grade: 010th grade: 011th grade: 32512th grade, no diploma: 158High school graduate (or equivalency): 5,194Less than 1 year of college: 1,289Some college more than 1 year, no degree: 2,991Associate degree: 1,883Bachelor's degree: 18,144Master's degree: 14,404Professional school degree: 2,149Doctorate degree: 2,598
Education attainment for females 25 years and older:
No schooling: 955Nursery to 4th grade: 2305th and 6th grade: 3377th and 8th grade: 2059th grade: 010th grade: 8711th grade: 4212th grade, no diploma: 190High school graduate (or equivalency): 6,006Less than 1 year of college: 2,089Some college more than 1 year, no degree: 3,168Associate degree: 3,322Bachelor's degree: 18,984Master's degree: 13,088Professional school degree: 1,958Doctorate degree: 1,572
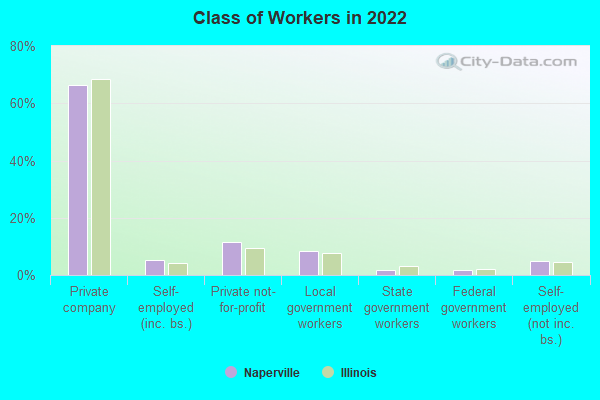
Housing units in structures:
One, detached: 36,149One, attached: 7,040Two: 4573 or 4: 1,8465 to 9: 3,23210 to 19: 2,46920 to 49: 1,90050 or more: 2,497Mobile homes: 438Housing units lacking complete plumbing facilities in 2022: 0.4%Housing units lacking complete kitchen facilities in 2022: 1.0%House/condo owner moved in on average 12 years ago
Renter moved in on average 2 years ago
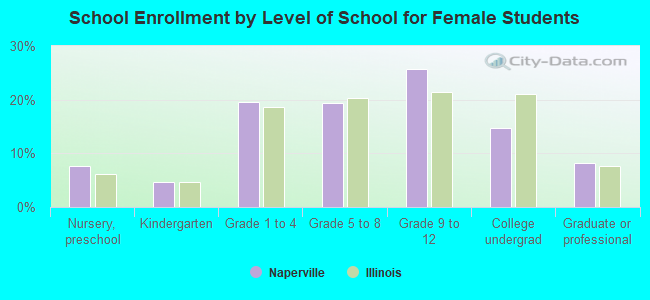
Private vs. public school enrollment:
Students in private schools in grades 1 to 8 (elementary and middle school): 2,701 Students in private schools in grades 9 to 12 (high school): 1,271 Students in private undergraduate colleges: 2,092