Races in Naperville, Illinois (IL) Detailed Stats
Data:
Races - White alone (%)
Races - White alone (% change since 2000)
Races - Black alone (%)
Races - Black alone (% change since 2000)
Races - American Indian alone (%)
Races - American Indian alone (% change since 2000)
Races - Asian alone (%)
Races - Asian alone (% change since 2000)
Races - Hispanic (%)
Races - Hispanic (% change since 2000)
Races - Native Hawaiian and Other Pacific Islander alone (%)
Races - Native Hawaiian and Other Pacific Islander alone (% change since 2000)
Races - Two or more races(%)
Races - Two or more races(% change since 2000)
Races - Other race alone (%)
Races - Other race alone (% change since 2000)
Racial diversity
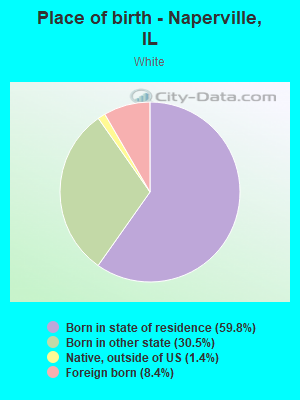
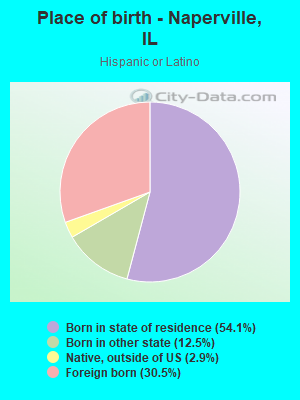
Place of birth - Born in state of residence (%)
Place of birth - Born in state of residence (%) - White
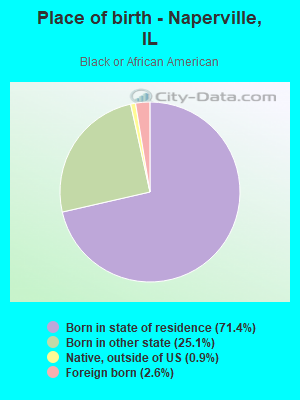
Place of birth - Born in state of residence (%) - Black or African American
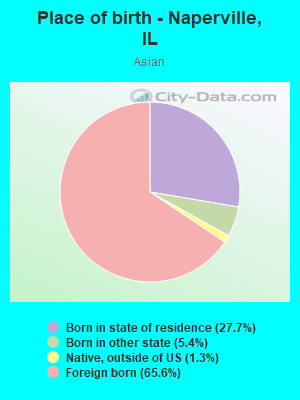
Place of birth - Born in state of residence (%) - Asian
Place of birth - Born in state of residence (%) - Hispanic or Latino
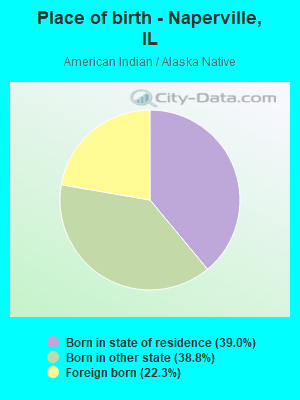
Place of birth - Born in state of residence (%) - American Indian and Alaska Native
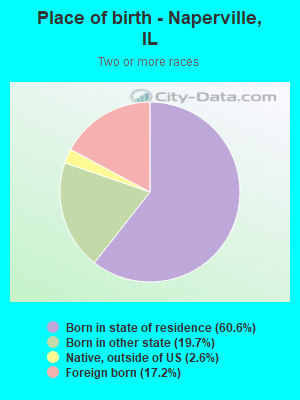
Place of birth - Born in state of residence (%) - Multirace
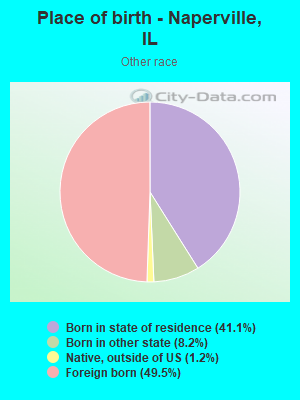
Place of birth - Born in state of residence (%) - Other Race
Place of birth - Born in other state (%)
Place of birth - Born in other state (%) - White
Place of birth - Born in other state (%) - Black or African American
Place of birth - Born in other state (%) - Asian
Place of birth - Born in other state (%) - Hispanic or Latino
Place of birth - Born in other state (%) - American Indian and Alaska Native
Place of birth - Born in other state (%) - Multirace
Place of birth - Born in other state (%) - Other Race
Place of birth - Native, outside of US (%)
Place of birth - Native, outside of US (%) - White
Place of birth - Native, outside of US (%) - Black or African American
Place of birth - Native, outside of US (%) - Asian
Place of birth - Native, outside of US (%) - Hispanic or Latino
Place of birth - Native, outside of US (%) - American Indian and Alaska Native
Place of birth - Native, outside of US (%) - Multirace
Place of birth - Native, outside of US (%) - Other Race
Place of birth - Foreign born (%)
Place of birth - Foreign born (%) - White
Place of birth - Foreign born (%) - Black or African American
Place of birth - Foreign born (%) - Asian
Place of birth - Foreign born (%) - Hispanic or Latino
Place of birth - Foreign born (%) - American Indian and Alaska Native
Place of birth - Foreign born (%) - Multirace
Place of birth - Foreign born (%) - Other Race
Residents speaking English at home (%)
Residents speaking English at home - Born in the United States (%)
Residents speaking English at home - Native, born elsewhere (%)
Residents speaking English at home - Foreign born (%)
Residents speaking Spanish at home (%)
Residents speaking Spanish at home - Born in the United States (%)
Residents speaking Spanish at home - Native, born elsewhere (%)
Residents speaking Spanish at home - Foreign born (%)
Residents speaking other language at home (%)
Residents speaking other language at home - Born in the United States (%)
Residents speaking other language at home - Native, born elsewhere (%)
Residents speaking other language at home - Foreign born (%)
Marital status - Never married (%)
Marital status - Now married (%)
Marital status - Separated (%)
Marital status - Widowed (%)
Marital status - Divorced (%)
Ancestries Reported - Arab (%)
Ancestries Reported - Czech (%)
Ancestries Reported - Danish (%)
Ancestries Reported - Dutch (%)
Ancestries Reported - English (%)
Ancestries Reported - French (%)
Ancestries Reported - French Canadian (%)
Ancestries Reported - German (%)
Ancestries Reported - Greek (%)
Ancestries Reported - Hungarian (%)
Ancestries Reported - Irish (%)
Ancestries Reported - Italian (%)
Ancestries Reported - Lithuanian (%)
Ancestries Reported - Norwegian (%)
Ancestries Reported - Polish (%)
Ancestries Reported - Portuguese (%)
Ancestries Reported - Russian (%)
Ancestries Reported - Scotch-Irish (%)
Ancestries Reported - Scottish (%)
Ancestries Reported - Slovak (%)
Ancestries Reported - Subsaharan African (%)
Ancestries Reported - Swedish (%)
Ancestries Reported - Swiss (%)
Ancestries Reported - Ukrainian (%)
Ancestries Reported - United States (%)
Ancestries Reported - Welsh (%)
Ancestries Reported - West Indian (%)
Ancestries Reported - Other (%)
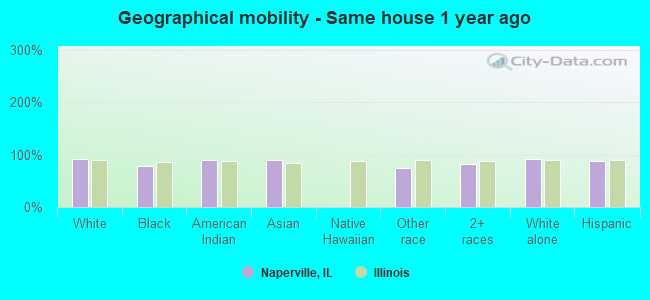
Geographical mobility - Same house 1 year ago (%)
Geographical mobility - Same house 1 year ago (%) - White
Geographical mobility - Same house 1 year ago (%) - Black or African American
Geographical mobility - Same house 1 year ago (%) - Asian
Geographical mobility - Same house 1 year ago (%) - Hispanic or Latino
Geographical mobility - Same house 1 year ago (%) - American Indian and Alaska Native
Geographical mobility - Same house 1 year ago (%) - Multirace
Geographical mobility - Same house 1 year ago (%) - Other Race
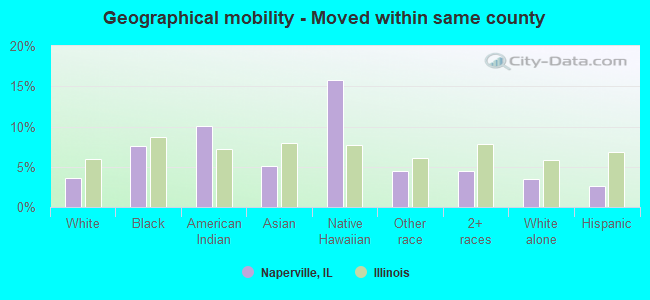
Geographical mobility - Moved within same county (%)
Geographical mobility - Moved within same county (%) - White
Geographical mobility - Moved within same county (%) - Black or African American
Geographical mobility - Moved within same county (%) - Asian
Geographical mobility - Moved within same county (%) - Hispanic or Latino
Geographical mobility - Moved within same county (%) - American Indian and Alaska Native
Geographical mobility - Moved within same county (%) - Multirace
Geographical mobility - Moved within same county (%) - Other Race
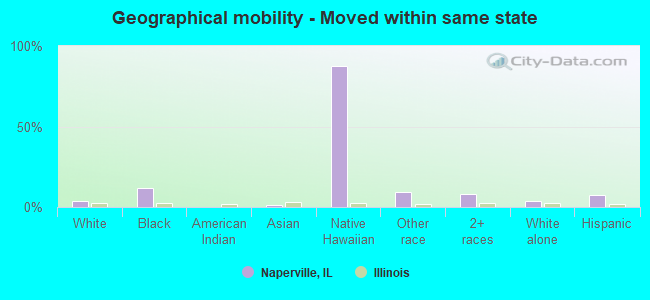
Geographical mobility - Moved from different county within same state (%)
Geographical mobility - Moved from different county within same state (%) - White
Geographical mobility - Moved from different county within same state (%) - Black or African American
Geographical mobility - Moved from different county within same state (%) - Asian
Geographical mobility - Moved from different county within same state (%) - Hispanic or Latino
Geographical mobility - Moved from different county within same state (%) - American Indian and Alaska Native
Geographical mobility - Moved from different county within same state (%) - Multirace
Geographical mobility - Moved from different county within same state (%) - Other Race
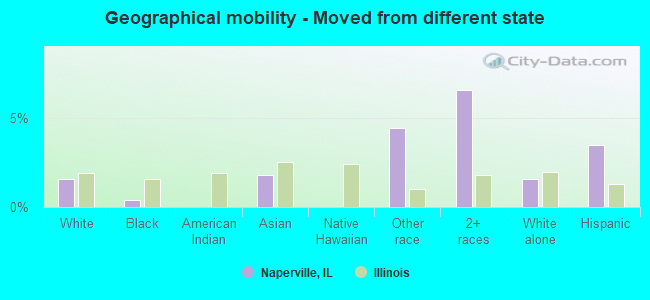
Geographical mobility - Moved from different state (%)
Geographical mobility - Moved from different state (%) - White
Geographical mobility - Moved from different state (%) - Black or African American
Geographical mobility - Moved from different state (%) - Asian
Geographical mobility - Moved from different state (%) - Hispanic or Latino
Geographical mobility - Moved from different state (%) - American Indian and Alaska Native
Geographical mobility - Moved from different state (%) - Multirace
Geographical mobility - Moved from different state (%) - Other Race
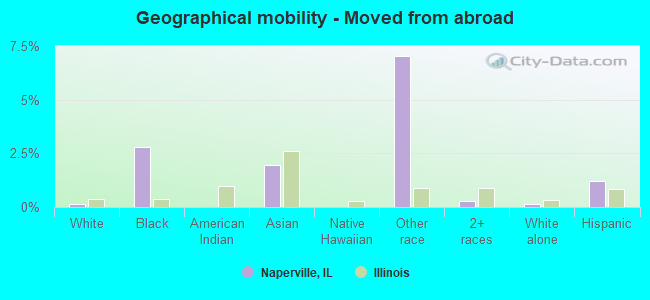
Geographical mobility - Moved from abroad (%)
Geographical mobility - Moved from abroad (%) - White
Geographical mobility - Moved from abroad (%) - Black or African American
Geographical mobility - Moved from abroad (%) - Asian
Geographical mobility - Moved from abroad (%) - Hispanic or Latino
Geographical mobility - Moved from abroad (%) - American Indian and Alaska Native
Geographical mobility - Moved from abroad (%) - Multirace
Geographical mobility - Moved from abroad (%) - Other Race
Place of birth for the foreign-born population - Ireland (%)
Place of birth for the foreign-born population - Denmark (%)
Place of birth for the foreign-born population - Norway (%)
Place of birth for the foreign-born population - Sweden (%)
Place of birth for the foreign-born population - United Kingdom (%)
Place of birth for the foreign-born population - England (%)
Place of birth for the foreign-born population - Scotland (%)
Place of birth for the foreign-born population - Other Northern Europe (%)
Place of birth for the foreign-born population - Austria (%)
Place of birth for the foreign-born population - Belgium (%)
Place of birth for the foreign-born population - France (%)
Place of birth for the foreign-born population - Germany (%)
Place of birth for the foreign-born population - Netherlands (%)
Place of birth for the foreign-born population - Switzerland (%)
Place of birth for the foreign-born population - Other Western Europe (%)
Place of birth for the foreign-born population - Greece (%)
Place of birth for the foreign-born population - Italy (%)
Place of birth for the foreign-born population - Portugal (%)
Place of birth for the foreign-born population - Spain (%)
Place of birth for the foreign-born population - Other Southern Europe (%)
Place of birth for the foreign-born population - Albania (%)
Place of birth for the foreign-born population - Belarus (%)
Place of birth for the foreign-born population - Bosnia and Herzegovina (%)
Place of birth for the foreign-born population - Bulgaria (%)
Place of birth for the foreign-born population - Croatia (%)
Place of birth for the foreign-born population - Czechoslovakia (%)
Place of birth for the foreign-born population - Hungary (%)
Place of birth for the foreign-born population - Latvia (%)
Place of birth for the foreign-born population - Lithuania (%)
Place of birth for the foreign-born population - North Macedonia (Macedonia) (%)
Place of birth for the foreign-born population - Moldova (%)
Place of birth for the foreign-born population - Poland (%)
Place of birth for the foreign-born population - Romania (%)
Place of birth for the foreign-born population - Russia (%)
Place of birth for the foreign-born population - Serbia (%)
Place of birth for the foreign-born population - Ukraine (%)
Place of birth for the foreign-born population - Other Eastern Europe (%)
Place of birth for the foreign-born population - China (%)
Place of birth for the foreign-born population - Hong Kong (%)
Place of birth for the foreign-born population - Taiwan (%)
Place of birth for the foreign-born population - Japan (%)
Place of birth for the foreign-born population - Korea (%)
Place of birth for the foreign-born population - Other Eastern Asia (%)
Place of birth for the foreign-born population - Afghanistan (%)
Place of birth for the foreign-born population - Bangladesh (%)
Place of birth for the foreign-born population - India (%)
Place of birth for the foreign-born population - Iran (%)
Place of birth for the foreign-born population - Kazakhstan (%)
Place of birth for the foreign-born population - Nepal (%)
Place of birth for the foreign-born population - Pakistan (%)
Place of birth for the foreign-born population - Sri Lanka (%)
Place of birth for the foreign-born population - Uzbekistan (%)
Place of birth for the foreign-born population - Other South Central Asia (%)
Place of birth for the foreign-born population - Burma (%)
Place of birth for the foreign-born population - Cambodia (%)
Place of birth for the foreign-born population - Indonesia (%)
Place of birth for the foreign-born population - Laos (%)
Place of birth for the foreign-born population - Malaysia (%)
Place of birth for the foreign-born population - Philippines (%)
Place of birth for the foreign-born population - Singapore (%)
Place of birth for the foreign-born population - Thailand (%)
Place of birth for the foreign-born population - Vietnam (%)
Place of birth for the foreign-born population - Other South Eastern Asia (%)
Place of birth for the foreign-born population - Armenia (%)
Place of birth for the foreign-born population - Iraq (%)
Place of birth for the foreign-born population - Israel (%)
Place of birth for the foreign-born population - Jordan (%)
Place of birth for the foreign-born population - Kuwait (%)
Place of birth for the foreign-born population - Lebanon (%)
Place of birth for the foreign-born population - Saudi Arabia (%)
Place of birth for the foreign-born population - Syria (%)
Place of birth for the foreign-born population - Turkey (%)
Place of birth for the foreign-born population - Yemen (%)
Place of birth for the foreign-born population - Other Western Asia (%)
Place of birth for the foreign-born population - Eritrea (%)
Place of birth for the foreign-born population - Ethiopia (%)
Place of birth for the foreign-born population - Kenya (%)
Place of birth for the foreign-born population - Somalia (%)
Place of birth for the foreign-born population - Uganda (%)
Place of birth for the foreign-born population - Zimbabwe (%)
Place of birth for the foreign-born population - Other Eastern Africa (%)
Place of birth for the foreign-born population - Cameroon (%)
Place of birth for the foreign-born population - Congo (%)
Place of birth for the foreign-born population - Democratic Republic of Congo (Zaire) (%)
Place of birth for the foreign-born population - Other Middle Africa (%)
Place of birth for the foreign-born population - Egypt (%)
Place of birth for the foreign-born population - Morocco (%)
Place of birth for the foreign-born population - Sudan (%)
Place of birth for the foreign-born population - Other Northern Africa (%)
Place of birth for the foreign-born population - South Africa (%)
Place of birth for the foreign-born population - Other Southern Africa (%)
Place of birth for the foreign-born population - Cabo Verde (%)
Place of birth for the foreign-born population - Ghana (%)
Place of birth for the foreign-born population - Liberia (%)
Place of birth for the foreign-born population - Nigeria (%)
Place of birth for the foreign-born population - Senegal (%)
Place of birth for the foreign-born population - Sierra Leone (%)
Place of birth for the foreign-born population - Other Western Africa (%)
Place of birth for the foreign-born population - Australia (%)
Place of birth for the foreign-born population - New Zealand (%)
Place of birth for the foreign-born population - Fiji (%)
Place of birth for the foreign-born population - Micronesia (%)
Place of birth for the foreign-born population - Bahamas (%)
Place of birth for the foreign-born population - Barbados (%)
Place of birth for the foreign-born population - Cuba (%)
Place of birth for the foreign-born population - Dominica (%)
Place of birth for the foreign-born population - Dominican Republic (%)
Place of birth for the foreign-born population - Grenada (%)
Place of birth for the foreign-born population - Haiti (%)
Place of birth for the foreign-born population - Jamaica (%)
Place of birth for the foreign-born population - St. Vincent and the Grenadines (%)
Place of birth for the foreign-born population - Trinidad and Tobago (%)
Place of birth for the foreign-born population - West Indies (%)
Place of birth for the foreign-born population - Other Caribbean (%)
Place of birth for the foreign-born population - Belize (%)
Place of birth for the foreign-born population - Costa Rica (%)
Place of birth for the foreign-born population - El Salvador (%)
Place of birth for the foreign-born population - Guatemala (%)
Place of birth for the foreign-born population - Honduras (%)
Place of birth for the foreign-born population - Mexico (%)
Place of birth for the foreign-born population - Nicaragua (%)
Place of birth for the foreign-born population - Panama (%)
Place of birth for the foreign-born population - Other Central America (%)
Place of birth for the foreign-born population - Argentina (%)
Place of birth for the foreign-born population - Bolivia (%)
Place of birth for the foreign-born population - Brazil (%)
Place of birth for the foreign-born population - Chile (%)
Place of birth for the foreign-born population - Colombia (%)
Place of birth for the foreign-born population - Ecuador (%)
Place of birth for the foreign-born population - Guyana (%)
Place of birth for the foreign-born population - Peru (%)
Place of birth for the foreign-born population - Uruguay (%)
Place of birth for the foreign-born population - Venezuela (%)
Place of birth for the foreign-born population - Other South America (%)
Place of birth for the foreign-born population - Canada (%)
Place of birth for the foreign-born population - Other Northern America (%)
Place of birth for the foreign-born population - Other (%)
Latest news about races in Naperville, IL collected exclusively by city-data.com from local newspapers, TV, and radio stations
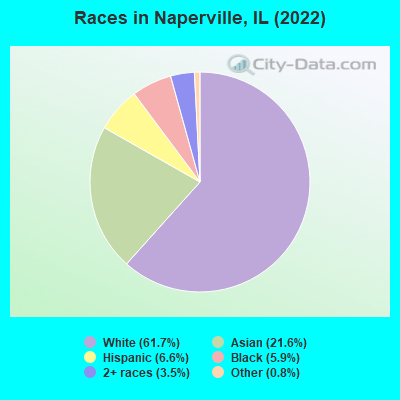
According to 2022 data, the most numerous races in Naperville, IL are White alone (91,612 residents), Hispanic (9,754 residents), and Black alone (8,690 residents). 73.2% of Naperville residents speak English at home. 22.2% of Naperville, IL residents are foreign-born (14.6% born in Asia, 4.2% born in Europe), which is 37.0% greater than the foreign-born rate of 14.0% across the entire state of Illinois.
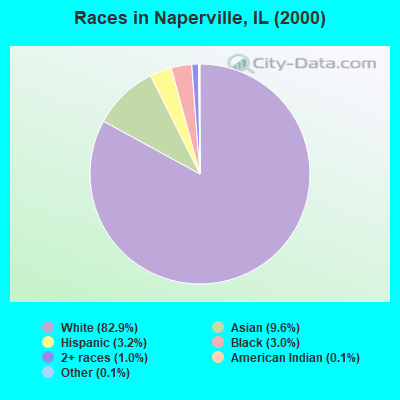
Race distribution in Naperville
2000 2022
106,386 82.9% White alone 12,351 9.6% Asian alone 4,160 3.2% Hispanic 3,828 3.0% Black alone 1,346 1.0% Two or more races 130 0.1% Other race alone 134 0.1% American Indian alone 23 0.02% Native Hawaiian and Other
91,612 61.7% White alone 32,015 21.6% Asian alone 9,754 6.6% Hispanic 8,690 5.9% Black alone 5,188 3.5% Two or more races 1,222 0.8% Other race alone 27 0.02% American Indian alone
2000 2022
8,424,140 67.8% White alone 1,856,152 14.9% Black alone 1,530,262 12.3% Hispanic 419,916 3.4% Asian alone 153,996 1.2% Two or more races 13,479 0.1% Other race alone 18,232 0.1% American Indian alone 3,116 0.03% Native Hawaiian and Other
7,356,301 58.5% White alone 2,299,726 18.3% Hispanic 1,660,423 13.2% Black alone 747,296 5.9% Asian alone 458,599 3.6% Two or more races 45,386 0.4% Other race alone 10,405 0.08% American Indian alone 3,896 0.03% Native Hawaiian and Other
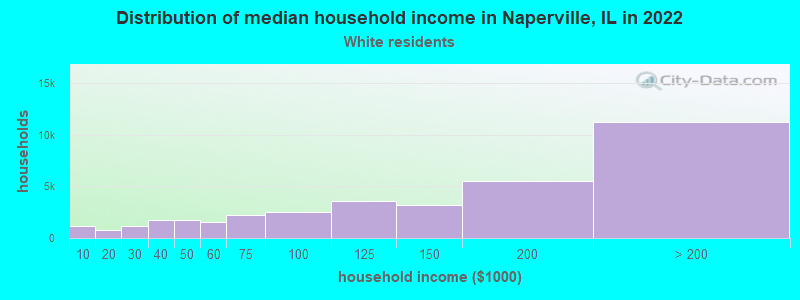
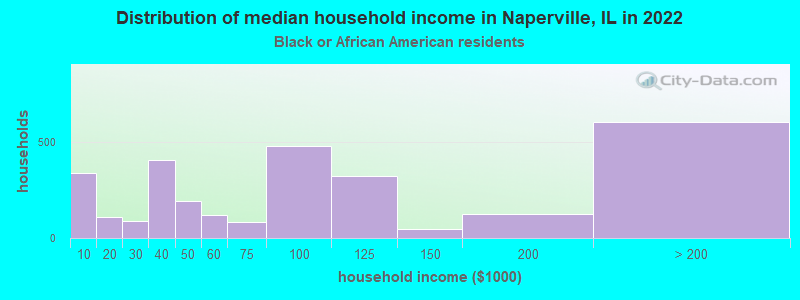
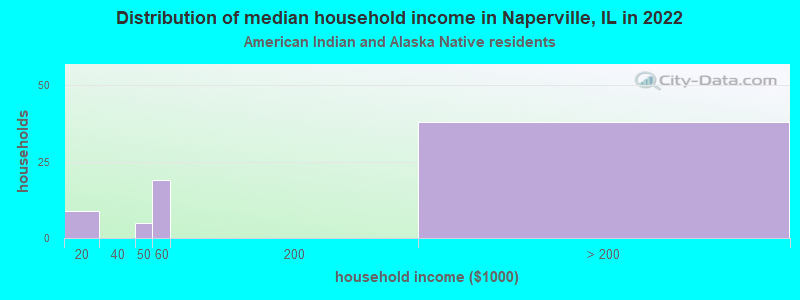
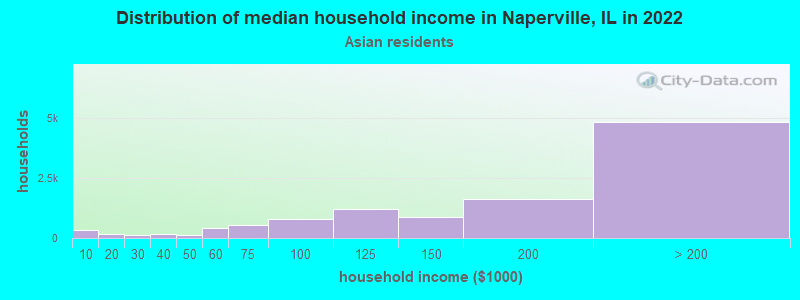
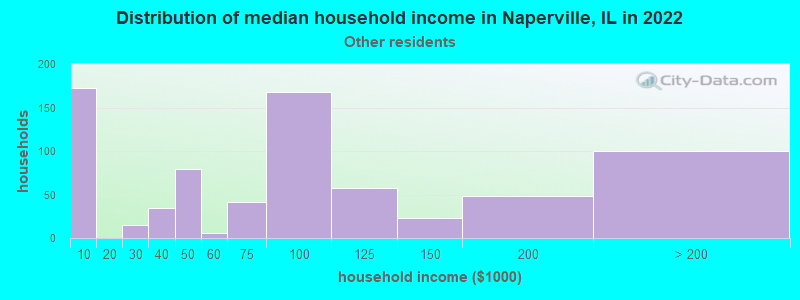
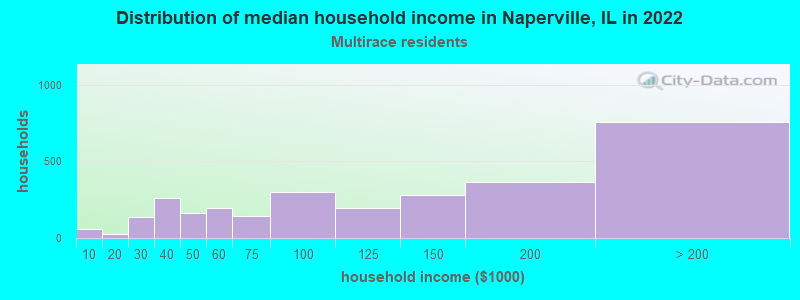
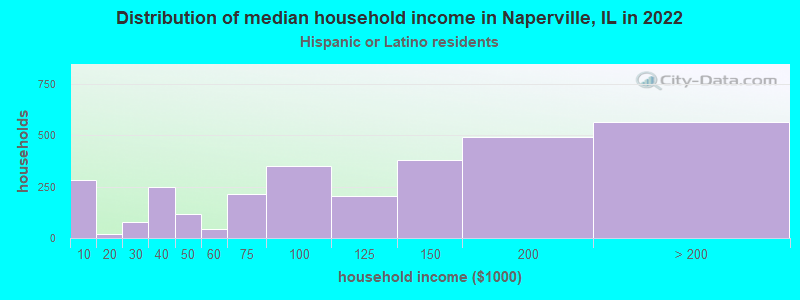
Income and house value in Naperville Median household income in 2022 $140,333 White non-Hispanic householders$97,392 Black householders$180,742 Asian householders$86,635 Some other race householders$115,769 Two or more races householders$124,252 Hispanic or Latino race householdersMedian 2022 house value $496,500 White Non-Hispanic householders$519,139 Black or African American householders$153,790 American Indian or Alaska Native householders $506,648 Asian householders$165,890 Native Hawaiian and other Pacific Islander householders$382,133 Some other race householders$471,128 Two or more races householders$439,121 Hispanic or Latino householders
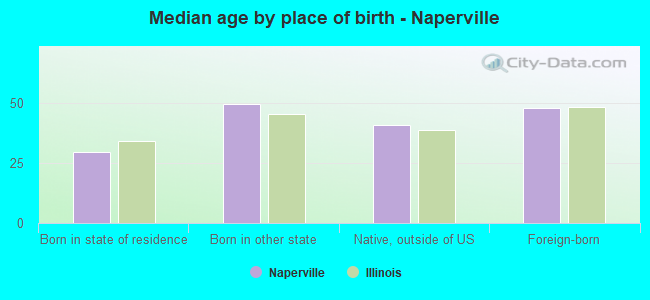
Median age by race in Naperville
42.6 Median age for White residents40.4 44.9 42.3 Median age for Black or African American residents39.0 42.3 -666,666,666.0 Median age for American Indian / Alaska Native residents-666,666,666.0 -666,666,666.0 40.7 Median age for Asian residents41.5 39.6 -666,666,666.0 Median age for Native Hawaiian / Pacific Islander residents-666,666,666.0 -666,666,666.0 42.3 Median age for Other race residents41.1 46.1 28.5 Median age for Two or more races residents28.3 28.8 43.8 Median age for White alone residents41.0 45.7 32.0 Median age for Hispanic or Latino residents31.6 33.7
Owner/renter occupied households by race in Naperville
House owners and renters - White residents 28,867 79.3% Owner occupied7,530 20.7% Renter occupiedHouse owners and renters - Black or African American residents 1,138 29.0% Owner occupied2,782 71.0% Renter occupiedHouse owners and renters - American Indian / Alaska Native residents 43 77.0% Owner occupied13 23.0% Renter occupiedHouse owners and renters - Asian residents 9,226 85.8% Owner occupied1,525 14.2% Renter occupiedHouse owners and renters - Other race residents 579 71.0% Owner occupied236 29.0% Renter occupiedHouse owners and renters - Two or more races residents 1,538 73.1% Owner occupied566 26.9% Renter occupiedHouse owners and renters - White alone residents 28,674 80.0% Owner occupied7,175 20.0% Renter occupiedHouse owners and renters - Hispanic or Latino residents 1,348 61.9% Owner occupied828 38.1% Renter occupied
Language usage in Naperville
English speakers - Total 73.2% of residents of Naperville speak English at home.
3.9% of residents speak Spanish at home 4,144 75.4% Speak English very well1,354 24.6% Speak English less than very well22.9% of residents speak other language at home 24,605 76.5% Speak English very well7,546 23.5% Speak English less than very well
English speakers - Born in the United States 94.1% of residents of Naperville speak English at home.
1.2% of residents speak Spanish at home 327 76.4% Speak English very well101 23.6% Speak English less than very well4.6% of residents speak other language at home 1,283 81.3% Speak English very well296 18.7% Speak English less than very well
English speakers - Native, born elsewhere 60.9% of residents of Naperville speak English at home.
7.4% of residents speak Spanish at home 145 100.0% Speak English very well31.7% of residents speak other language at home 418 67.5% Speak English very well201 32.5% Speak English less than very well
English speakers - Foreign-born 14.8% of residents of Naperville speak English at home.
8.4% of residents speak Spanish at home 1,595 58.2% Speak English very well1,144 41.8% Speak English less than very well76.8% of residents speak other language at home 18,172 72.7% Speak English very well6,813 27.3% Speak English less than very well
White (Caucasian) - Speak only English Native:
95.5% (78,002)Foreign-born:
25.6% (2,024)
White (Caucasian) - Speak another language Native:
4.5% (3,681)Foreign-born:
74.4% (5,872)
Black or African American - Speak only English Native:
96.5% (6,259)Foreign-born:
48.3% (92)
Black or African American - Speak another language Native:
3.5% (228)Foreign-born:
100.0% (191)
American Indian / Alaska Native - Speak only English Native:
69.0% (128)Foreign-born:
12.2% (6)
American Indian / Alaska Native - Speak another language Native:
15.7% (29)Foreign-born:
98.6% (49)
Asian - Speak only English Native:
57.3% (5,432)Foreign-born:
11.9% (2,525)
Asian - Speak another language Native:
42.7% (4,056)Foreign-born:
88.1% (18,770)
Other race - Speak another language Native:
26.5% (369)Foreign-born:
100.0% (1,469)
Two or more races - Speak only English Native:
80.1% (5,817)Foreign-born:
6.4% (105)
Two or more races - Speak another language Native:
19.9% (1,441)Foreign-born:
93.6% (1,539)
White alone - Speak only English Native:
95.9% (76,320)Foreign-born:
25.4% (1,985)
White alone - Speak another language Native:
4.1% (3,255)Foreign-born:
74.6% (5,819)
Hispanic or Latino - Speak only English Native:
66.8% (4,011)Foreign-born:
4.8% (144)
Hispanic or Latino - Speak another language Native:
33.2% (1,991)Foreign-born:
95.2% (2,828)
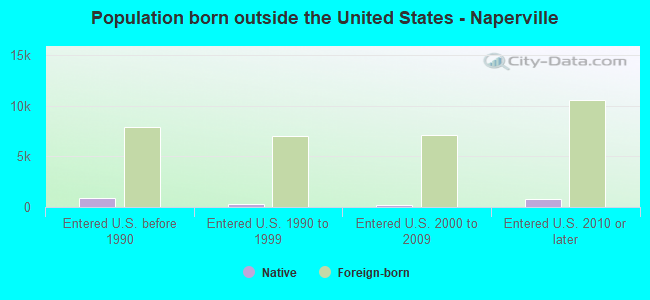
Foreign-born residents in Naperville 32,789 residents are foreign born (14.6% Asia , 4.2% Europe ).
This city:
22.2%Illinois:
14.1%
Marital status for residents in Naperville Marital status - White (Caucasian) population 15 years and over
Males 28.5% Never married64.8% Now married0.1% Separated2.5% Widowed4.1% DivorcedFemales 24.3% Never married58.9% Now married1.2% Separated6.3% Widowed9.3% DivorcedWomen who gave birth in the past 12 months Now married:
95.1% (1,037)Unmarried:
4.9% (53)
Women who did not give birth in the past 12 months Now married:
49.1% (9,474)Unmarried:
50.9% (9,832)
Marital status - Black or African American population 15 years and over
Males 26.1% Never married65.6% Now married2.8% Separated2.1% Widowed3.5% DivorcedFemales 30.8% Never married43.3% Now married0.0% Separated1.3% Widowed24.6% DivorcedWomen who gave birth in the past 12 months Now married:
12.6% (18)Unmarried:
87.4% (127)
Women who did not give birth in the past 12 months Now married:
25.5% (582)Unmarried:
74.5% (1,706)
Marital status - American Indian / Alaska Native population 15 years and over
Males 18.2% Never married47.5% Now married0.0% Separated0.0% Widowed34.3% DivorcedFemales 56.2% Never married43.7% Now married0.0% Separated0.0% Widowed0.0% DivorcedWomen who did not give birth in the past 12 months Now married:
0.0% (0)Unmarried:
100.0% (45)
Marital status - Asian population 15 years and over
Males 22.0% Never married75.5% Now married0.4% Separated1.5% Widowed0.6% DivorcedFemales 15.6% Never married73.9% Now married0.4% Separated7.9% Widowed2.3% DivorcedWomen who gave birth in the past 12 months Now married:
100.0% (247)Unmarried:
0.0% (0)
Women who did not give birth in the past 12 months Now married:
72.6% (5,303)Unmarried:
27.4% (2,004)
Marital status - Native Hawaiian / Pacific Islander population 15 years and over
Males 100.0% Never married0.0% Now married0.0% Separated0.0% Widowed0.0% DivorcedFemales 100.0% Never married0.0% Now married0.0% Separated0.0% Widowed0.0% DivorcedMarital status - Other race population 15 years and over
Males 58.7% Never married32.9% Now married4.5% Separated3.4% Widowed0.5% DivorcedFemales 40.3% Never married43.3% Now married1.6% Separated7.8% Widowed7.0% DivorcedWomen who gave birth in the past 12 months Now married:
0.0% (0)Unmarried:
100.0% (28)
Women who did not give birth in the past 12 months Now married:
52.1% (308)Unmarried:
47.9% (283)
Marital status - Two or more races population 15 years and over
Males 42.2% Never married50.2% Now married0.0% Separated0.0% Widowed7.6% DivorcedFemales 40.2% Never married42.0% Now married1.4% Separated7.7% Widowed8.7% DivorcedWomen who gave birth in the past 12 months Now married:
55.7% (48)Unmarried:
44.3% (38)
Women who did not give birth in the past 12 months Now married:
52.6% (1,400)Unmarried:
47.4% (1,262)
Marital status - White alone, not Hispanic / Latino population 15 years and over
Males 28.3% Never married64.9% Now married0.1% Separated2.6% Widowed4.2% DivorcedFemales 23.7% Never married59.2% Now married1.2% Separated6.4% Widowed9.5% DivorcedWomen who gave birth in the past 12 months Now married:
95.1% (1,037)Unmarried:
4.9% (53)
Women who did not give birth in the past 12 months Now married:
49.3% (9,171)Unmarried:
50.7% (9,430)
Marital status - Hispanic or Latino population 15 years and over
Males 40.5% Never married50.7% Now married1.5% Separated1.1% Widowed6.2% DivorcedFemales 36.7% Never married48.5% Now married5.6% Separated4.7% Widowed4.5% DivorcedWomen who gave birth in the past 12 months Now married:
13.0% (7)Unmarried:
87.0% (49)
Women who did not give birth in the past 12 months Now married:
48.4% (1,239)Unmarried:
51.6% (1,319)
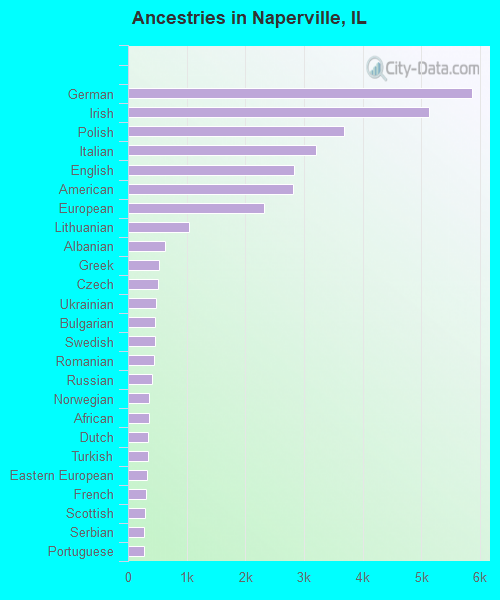
Ancestries in Naperville
5,862 8.4% German5,129 7.3% Irish3,688 5.3% Polish3,210 4.6% Italian2,834 4.0% English2,810 4.0% American2,316 3.3% European1,048 1.5% Lithuanian624 0.9% Albanian523 0.7% Greek514 0.7% Czech482 0.7% Ukrainian467 0.7% Bulgarian458 0.7% Swedish436 0.6% Romanian406 0.6% Russian361 0.5% Norwegian352 0.5% African346 0.5% Dutch336 0.5% Turkish319 0.5% Eastern European312 0.4% French289 0.4% Scottish281 0.4% Serbian272 0.4% Portuguese245 0.3% French Canadian217 0.3% Palestinian197 0.3% British177 0.3% Iranian166 0.2% Scotch-Irish162 0.2% Croatian159 0.2% Nigerian140 0.2% Hungarian131 0.2% Haitian127 0.2% Slovak113 0.2% Canadian110 0.2% Danish102 0.1% Lebanese91 0.1% Northern European91 0.1% Austrian90 0.1% Macedonian83 0.1% Latvian80 0.1% Czechoslovakian72 0.1% South African68 0.10% Zimbabwean66 0.09% Moroccan64 0.09% Jordanian62 0.09% Assyrian53 0.08% Finnish46 0.07% Scandinavian46 0.07% Swiss45 0.06% Estonian43 0.06% Kenyan41 0.06% Welsh40 0.06% Brazilian33 0.05% Yugoslavian32 0.05% Luxembourger24 0.03% Australian22 0.03% Cypriot21 0.03% Ghanaian21 0.03% Belgian17 0.02% Jamaican15 0.02% Egyptian15 0.02% Carpatho Rusyn14 0.02% Ethiopian13 0.02% Armenian13 0.02% Basque12 0.02% Slavic11 0.02% Maltese9 0.01% Slovene6 0.01% Syrian5 0.01% West Indian
Geographical mobility in Naperville Same house 1 year ago 85,182 91.0% White (Caucasian)5,253 78.3% Black or African American298 89.9% American Indian / Alaska Native29,171 89.8% Asian1,947 74.5% Other race10,133 82.1% Two or more races82,861 91.3% White alone, not Hispanic / Latino9,050 87.0% Hispanic or LatinoMoved within same county 3,316 3.5% White / Caucasian511 7.6% Black or African American33 10.1% American Indian / Alaska Native1,661 5.1% Asian1 15.8% Native Hawaiian / Pacific Islander118 4.5% Other race548 4.4% Two or more races3,123 3.4% White alone, not Hispanic / Latino268 2.6% Hispanic or LatinoMoved within same state 3,529 3.8% White / Caucasian788 11.7% Black or African American455 1.4% Asian6 87.3% Native Hawaiian / Pacific Islander244 9.3% Other race1,014 8.2% Two or more races3,202 3.5% White alone, not Hispanic / Latino747 7.2% Hispanic or LatinoMoved from different state 1,483 1.6% White / Caucasian25 0.4% Black or African American574 1.8% Asian116 4.4% Other race809 6.6% Two or more races1,419 1.6% White alone, not Hispanic / Latino359 3.4% Hispanic or LatinoMoved from abroad 132 0.1% White187 2.8% Black or African American633 1.9% Asian184 7.0% Other race37 0.3% Two or more races132 0.1% White alone, not Hispanic / Latino127 1.2% Hispanic or Latino
Children Nativity (place of birth) in Naperville
Children under 6 years - Living with two parents Both parents native 5,206 100.0% NativeBoth parents foreign-born 2,519 95.7% Native112 4.3% Foreign-bornOne native, one foreign-born parent 1,059 100.0% NativeChildren under 6 years - Living with one parent Native parent 813 100.0% NativeForeign-born parent 91 100.0% NativeChildren 6 to 17 years - Living with two parents Both parents native 11,658 99.7% Native31 0.3% Foreign-bornBoth parents foreign-born 5,473 75.6% Native1,764 24.4% Foreign-bornOne native, one foreign-born parent 2,385 100.0% NativeChildren 6 to 17 years - Living with one parent Native parent 4,028 100.0% NativeForeign-born parent 398 53.5% Native346 46.5% Foreign-born
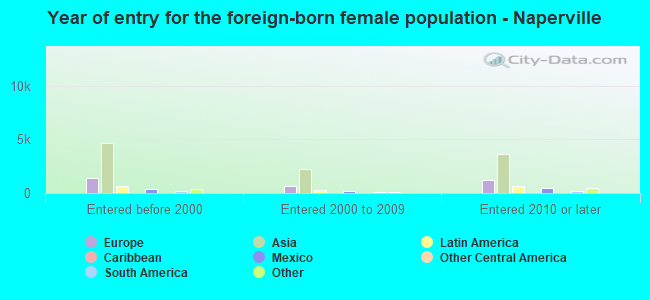
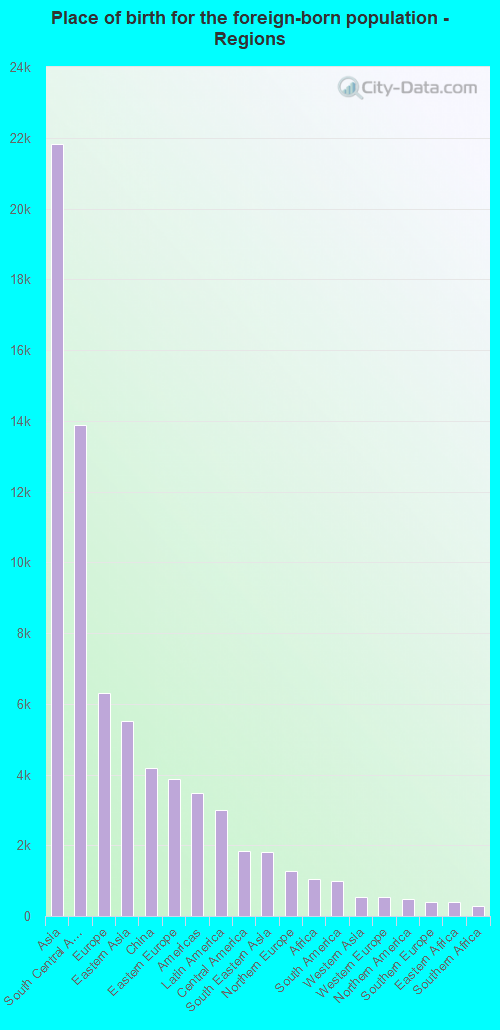
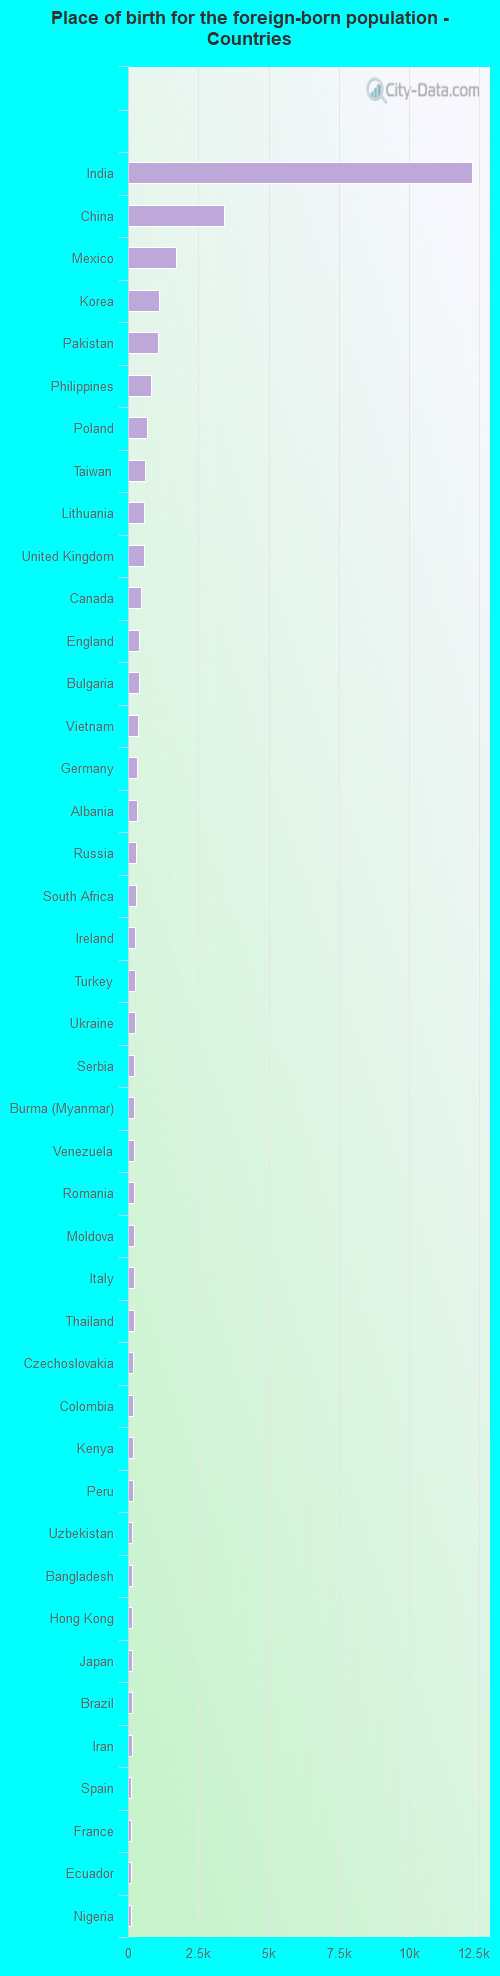
Place of birth for residents in Naperville 21,829 Asia13,885 South Central Asia6,292 Europe5,499 Eastern Asia4,192 China3,879 Eastern Europe3,466 Americas2,990 Latin America1,829 Central America1,818 South Eastern Asia1,274 Northern Europe1,033 Africa978 South America551 Western Asia542 Western Europe475 Northern America408 Southern Europe406 Eastern Africa273 Southern Africa182 Caribbean167 Oceania156 Western Africa127 Australia and New Zealand Subregion72 Northern Africa12 Middle Africa12,229 India3,426 China1,715 Mexico1,088 Korea1,078 Pakistan825 Philippines685 Poland616 Taiwan574 Lithuania563 United Kingdom475 Canada397 England395 Bulgaria363 Vietnam321 Germany313 Albania285 Russia273 South Africa254 Ireland252 Turkey242 Ukraine228 Serbia226 Burma (Myanmar)219 Venezuela218 Romania216 Moldova213 Italy197 Thailand195 Czechoslovakia187 Colombia182 Kenya182 Peru158 Uzbekistan154 Bangladesh149 Hong Kong142 Japan129 Brazil125 Iran123 Spain117 France117 Ecuador116 Nigeria108 Singapore85 New Zealand84 Uganda81 Bosnia and Herzegovina78 North Macedonia (Macedonia)76 Guatemala71 Greece70 Belarus70 Haiti70 Kazakhstan66 Sri Lanka64 Cuba61 Uruguay59 Switzerland54 Kuwait48 Israel48 Zimbabwe47 Chile47 Latvia45 Morocco42 Australia41 Iraq41 United Arab Emirates40 Indonesia38 Ghana38 Croatia38 Malaysia35 Ethiopia35 Dominican Republic34 Argentina33 Jordan30 Netherlands28 Fiji27 Egypt25 El Salvador22 Lebanon21 Syria18 Saudi Arabia16 Hungary16 Tanzania14 Belgium13 Jamaica13 Cambodia11 Panama10 Micronesia8 Sweden8 Scotland6 Laos3 Nepal2 Liberia2 Nicaragua
Grandparents responsible for own grandchildren in Naperville
Grandparents (30 to 59 years) White / Caucasian 24 18.5% Responsible for grandchildren106 81.5% Not responsible for grandchildrenBlack or African American 86 100.0% Not responsible for grandchildrenAsian 9 10.9% Responsible for grandchildren75 89.1% Not responsible for grandchildrenWhite alone, not Hispanic / Latino 9 7.9% Responsible for grandchildren104 92.1% Not responsible for grandchildrenHispanic or Latino 8 24.8% Responsible for grandchildren26 75.2% Not responsible for grandchildrenGrandparents (60 years and over) White / Caucasian 53 9.7% Responsible for grandchildren491 90.3% Not responsible for grandchildrenBlack or African American 54 79.5% Responsible for grandchildren14 20.5% Not responsible for grandchildrenAsian 39 5.8% Responsible for grandchildren625 94.2% Not responsible for grandchildrenWhite alone, not Hispanic / Latino 58 10.8% Responsible for grandchildren479 89.2% Not responsible for grandchildrenHispanic or Latino 36 100.0% Not responsible for grandchildren