Mount Rainier, WA (Washington) Houses and Residents
| Mount Rainier: | $566,469 |
| Washington: | $569,500 |
Total population: 2,723 (Urban population: 101, Rural population: 2,376 (9 farm, 2,367 nonfarm))
Houses: 1,018 (825 occupied: 680 owner occupied, 145 renter occupied)
| % of renters here: | 18% |
| State: | 36% |
Housing density: 1 houses/condos per square mile
Median price asked for vacant for-sale houses and condos in 2022 in this county: $155,723.
Median contract rent in 2022: $1,606 (lower quartile is $988, upper quartile is over $2,000)
Median gross rent in Mount Rainier, WA in 2022: $1,701
Housing units in Mount Rainier with a mortgage: 320 (42 second mortgage, 13 home equity loan, 6 both second mortgage and home equity loan)
Houses without a mortgage: 53
Compare current foreclosures near Mount Rainier, WA:
| Photo | Address | Area | Beds / Baths | Price | Details |
|---|---|---|---|---|---|

|
#1
279th Avenue Ct E
Wilkeson, WA 98396
|
2,880 sq. feet
|
2 baths 4 beds |
show details | |

|
#2
Greenbelt Dr E
Bonney Lake, WA 98391
|
1,478 sq. feet
|
2 baths 3 beds |
show details | |

|
#3
SE 430th St
Enumclaw, WA 98022
|
2,030 sq. feet
|
2 baths 4 beds |
show details | |

|
#4
Prairie Ridge Dr E
Bonney Lake, WA 98391
|
1,188 sq. feet
|
2 baths 3 beds |
show details | |

|
#5
Park Ave
Buckley, WA 98321
|
1,088 sq. feet
|
1 baths 2 beds |
show details | |

|
#6
Greenbelt Dr E
Bonney Lake, WA 98391
|
1,478 sq. feet
|
2 baths 3 beds |
show details | |

|
#7
220th Avenue Ct E
Bonney Lake, WA 98391
|
1,292 sq. feet
|
2 baths 3 beds |
show details | |

|
#8
131st St E
Bonney Lake, WA 98391
|
1,640 sq. feet
|
2 baths 3 beds |
show details | |

|
#9
100th Street Ct E
Buckley, WA 98321
|
912 sq. feet
|
1 baths 2 beds |
show details | |

|
#10
131st St E
Bonney Lake, WA 98391
|
1,224 sq. feet
|
2 baths 3 beds |
show details |
| Photo | Address | Area | Beds / Baths | Price | Details |
|---|---|---|---|---|---|

|
#11
237th Avenue Ct E
Buckley, WA 98321
|
1,512 sq. feet
|
2 baths 3 beds |
show details | |

|
#12
SE 416th St
Enumclaw, WA 98022
|
1,420 sq. feet
|
1 baths 2 beds |
show details | |

|
#13
225th Ave E
Orting, WA 98360
|
1,536 sq. feet
|
1 baths 2 beds |
show details | |

|
#14
261st Avenue Ct E
Buckley, WA 98321
|
1,909 sq. feet
|
2 baths 3 beds |
show details | |

|
#15
Chinook Ave
Enumclaw, WA 98022
|
970 sq. feet
|
1 baths 3 beds |
show details | |

|
#16
Sergeant St N
Buckley, WA 98321
|
2,052 sq. feet
|
1 baths 3 beds |
show details | |

|
#17
Neilson Ave
Enumclaw, WA 98022
|
860 sq. feet
|
1 baths 2 beds |
show details | |

|
#18
252nd Ave E
Buckley, WA 98321
|
1,676 sq. feet
|
2 baths 3 beds |
show details | |

|
#19
SE 430th St
Enumclaw, WA 98022
|
1,740 sq. feet
|
1 baths 3 beds |
show details | |

|
#20
Karen Ave
Buckley, WA 98321
|
1,360 sq. feet
|
2 baths 3 beds |
show details |
| Photo | Address | Area | Beds / Baths | Price | Details |
|---|---|---|---|---|---|

|
#21
146th St E
Buckley, WA 98321
|
1,958 sq. feet
|
1 baths 3 beds |
show details | |

|
#22
Enumclaw Franklin Rd SE
Enumclaw, WA 98022
|
910 sq. feet
|
1 baths 3 beds |
show details | |

|
#23
274th Ave E
Buckley, WA 98321
|
2,090 sq. feet
|
2 baths 5 beds |
show details | |

|
#24
158th St E
Buckley, WA 98321
|
- sq. feet
|
- baths - beds |
show details | |

|
#25
224th Ave E
Buckley, WA 98321
|
- sq. feet
|
- baths - beds |
show details | |

|
#26
216th Ave E
Bonney Lake, WA 98391
|
- sq. feet
|
- baths - beds |
show details | |

|
#27
Bondgard Ave E
Enumclaw, WA 98022
|
- sq. feet
|
- baths - beds |
show details | |

|
#28
Ryan Rd Apt B
Buckley, WA 98321
|
- sq. feet
|
- baths - beds |
show details | |

|
#29
Prairie Ridge Dr E
Bonney Lake, WA 98391
|
- sq. feet
|
- baths - beds |
show details | |

|
#30
Anadoll Ave
Enumclaw, WA 98022
|
- sq. feet
|
- baths - beds |
show details |
| Photo | Address | Area | Beds / Baths | Price | Details |
|---|---|---|---|---|---|

|
#31
112th St E
Buckley, WA 98321
|
- sq. feet
|
- baths - beds |
show details | |

|
#32
Becky Ave E
Enumclaw, WA 98022
|
- sq. feet
|
- baths - beds |
show details | |

|
#33
Martin Way
Enumclaw, WA 98022
|
- sq. feet
|
- baths - beds |
show details | |

|
#34
300th Ave SE
Enumclaw, WA 98022
|
- sq. feet
|
- baths - beds |
show details | |

|
#35
Christianson Ave
Enumclaw, WA 98022
|
- sq. feet
|
- baths - beds |
show details | |

|
#36
96th St E
Buckley, WA 98321
|
- sq. feet
|
- baths - beds |
show details | |

|
#37
Douglas Fir Dr
Enumclaw, WA 98022
|
- sq. feet
|
- baths - beds |
show details | |

|
#38
Spruce Dr
Enumclaw, WA 98022
|
- sq. feet
|
- baths - beds |
show details | |

|
#39
State Route 410 E # 61
Buckley, WA 98321
|
4,000 sq. feet
|
- baths - beds |
show details | |

|
#40
Charwila Ln Apt C
Enumclaw, WA 98022
|
- sq. feet
|
- baths - beds |
show details |
| Photo | Address | Area | Beds / Baths | Price | Details |
|---|---|---|---|---|---|

|
#41
Boyle St
Enumclaw, WA 98022
|
- sq. feet
|
- baths - beds |
show details | |

|
#42
244th Ave SE
Enumclaw, WA 98022
|
- sq. feet
|
- baths - beds |
show details | |

|
#43
Smith Dr
Enumclaw, WA 98022
|
- sq. feet
|
- baths - beds |
show details | |

|
#44
190th St E
Orting, WA 98360
|
- sq. feet
|
- baths - beds |
show details | |

|
#45
276th Ave E
Buckley, WA 98321
|
- sq. feet
|
- baths - beds |
show details | |

|
Check over 1 million property listings on Foreclosure.com!
|
browse all offers | |||

Household type by relationship:
Households: 777,280- In family households: 649,436 (139,627 male householders, 62,547 female householders)
146,885 spouses, 231,575 children (211,778 natural, 5,857 adopted, 13,940 stepchildren), 15,084 grandchildren, 7,520 brothers or sisters, 6,616 parents, foster children, 10,189 other relatives, 24,313 non-relatives
- In nonfamily households: 127,844 (47,852 male householders (34,710 living alone)), 49,892 female householders (40,467 living alone)), 30,100 nonrelatives
- In group quarters: 17,945 (8,874 institutionalized population)
126,863 married couples with children.
46,663 single-parent households (11,601 men, 35,062 women).
97.5% of residents of Mount Rainier speak English at home.
1.0% of residents speak Spanish at home (100% speak English very well).
1.5% of residents speak other Indo-European language at home (77% speak English very well, 23% speak English well).
Foreign born population: 92 (2.8%)
(78.3% of them are naturalized citizens)
| Here: | 5.3 |
| State: | 6.5 |
| Here: | 5.1 |
| State: | 3.9 |

- Bedrooms in owner-occupied houses and condos in Mount Rainier, Washington
- 0no bedroom
- 481 bedroom
- 1752 bedrooms
- 3713 bedrooms
- 844 bedrooms
- 25+ bedrooms

- Bedrooms in renter-occupied apartments in Mount Rainier, Washington
- 19no bedroom
- 141 bedroom
- 652 bedrooms
- 313 bedrooms
- 164 bedrooms
- 05+ bedrooms

- Cars and other vehicles available in Mount Rainier in owner-occupied houses/condos
- 30no vehicle
- 1231 vehicle
- 2702 vehicles
- 1443 vehicles
- 694 vehicles
- 445+ vehicles

- Cars and other vehicles available in Mount Rainier in renter-occupied apartments
- 0no vehicle
- 751 vehicle
- 522 vehicles
- 63 vehicles
- 124 vehicles
- 05+ vehicles

- Rooms in owner-occupied houses in Mount Rainier, Washington
- 01 room
- 272 rooms
- 193 rooms
- 844 rooms
- 1765 rooms
- 1236 rooms
- 1097 rooms
- 818 rooms
- 619+ rooms

- Rooms in renter-occupied apartments in Mount Rainier, Washington
- 101 room
- 02 rooms
- 203 rooms
- 174 rooms
- 485 rooms
- 306 rooms
- 207 rooms
- 08 rooms
- 09+ rooms


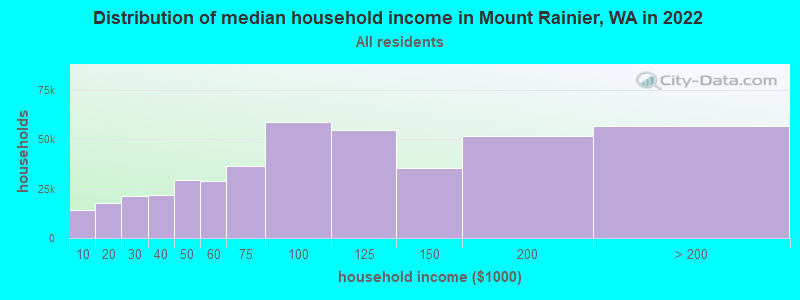
Mount Rainier, WA household income distribution

- 13,960Less than $10,000
- 17,480$10,000 to $19,999
- 21,376$20,000 to $29,999
- 21,908$30,000 to $39,999
- 29,444$40,000 to $49,999
- 28,577$50,000 to $59,999
- 36,549$60,000 to $74,999
- 58,606$75,000 to $99,999
- 54,346$100,000 to $124,999
- 35,530$125,000 to $149,999
- 51,455$150,000 to $199,999
- 56,494$200,000 or more
Percentage of workers working in this county: 58.6%
Number of people working at home: 256 (15.0% of all workers)
Travel time to work (commute)
- Less than 5 minutes: 50
- 5 to 9 minutes: 35
- 10 to 14 minutes: 51
- 15 to 19 minutes: 61
- 20 to 24 minutes: 133
- 25 to 29 minutes: 46
- 30 to 34 minutes: 226
- 35 to 39 minutes: 50
- 40 to 44 minutes: 23
- 45 to 59 minutes: 148
- 60 to 89 minutes: 248
- 90 or more minutes: 91
Means of transportation to work:
- Drove a car alone: 855 (70.4%)
- Carpooled: 276 (22.7%)
- Walked: 31 (2.6%)
- Worked at home: 53 (4.4%)


- Year of entry for the foreign-born population in Mount Rainier, Washington
- 71995 to March 2000
- 81990 to 1994
- 01985 to 1989
- 01980 to 1984
- 21975 to 1979
- 01970 to 1974
- 01965 to 1969
- 34Before 1965
Most common places of birth for foreign-born residents (%):
| Mount Rainier: | 25.5% (13) |
| Washington: | 1.0% (6,393) |
| Mount Rainier: | 15.7% (8) |
| Washington: | 0.7% (4,092) |
| Mount Rainier: | 13.7% (7) |
| Washington: | 3.3% (20,321) |
| Mount Rainier: | 13.7% (7) |
| Washington: | 3.4% (21,167) |
| Mount Rainier: | 11.8% (6) |
| Washington: | 1.2% (7,645) |
| Mount Rainier: | 7.8% (4) |
| Washington: | 0.6% (3,795) |
| Mount Rainier: | 7.8% (4) |
| Washington: | 7.7% (47,568) |
| Mount Rainier: | 3.9% (2) |
| Washington: | 0.2% (1,014) |
Place of birth for U.S.-born residents:
- This state: 1,688
- Other state: 717
- Northeast: 69
- Midwest: 218
- South: 130
- West: 300
55% of Mount Rainier residents lived in the same house 5 years ago.
Out of people who lived in different houses, 49% lived in this county.
Out of people who lived in different counties, 88% lived in Washington.
Education attainment for males 25 years and older:
- No schooling: 0
- Nursery to 4th grade: 0
- 5th and 6th grade: 1
- 7th and 8th grade: 32
- 9th grade: 12
- 10th grade: 18
- 11th grade: 31
- 12th grade, no diploma: 65
- High school graduate (or equivalency): 342
- Less than 1 year of college: 85
- Some college more than 1 year, no degree: 131
- Associate degree: 63
- Bachelor's degree: 68
- Master's degree: 21
- Professional school degree: 3
- Doctorate degree: 14

Education attainment for females 25 years and older:
- No schooling: 0
- Nursery to 4th grade: 0
- 5th and 6th grade: 6
- 7th and 8th grade: 17
- 9th grade: 3
- 10th grade: 6
- 11th grade: 24
- 12th grade, no diploma: 22
- High school graduate (or equivalency): 242
- Less than 1 year of college: 150
- Some college more than 1 year, no degree: 104
- Associate degree: 104
- Bachelor's degree: 39
- Master's degree: 19
- Professional school degree: 15
- Doctorate degree: 0


Housing units in structures:
- One, detached: 728
- One, attached: 8
- Two: 4
- 5 to 9: 6
- 10 to 19: 3
- Mobile homes: 263
- Boats, RVs, vans, etc.: 6
Median worth of mobile homes: $344,605

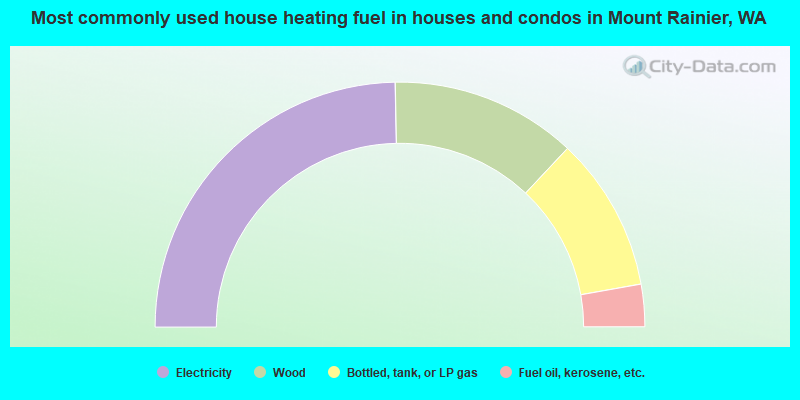
- 49.4%Electricity
- 24.6%Wood
- 20.4%Bottled, tank, or LP gas
- 5.6%Fuel oil, kerosene, etc.
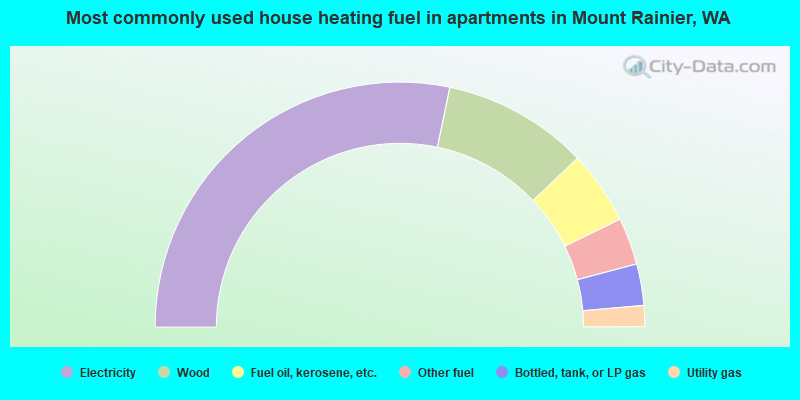
- 56.6%Electricity
- 19.3%Wood
- 9.7%Fuel oil, kerosene, etc.
- 6.2%Other fuel
- 5.5%Bottled, tank, or LP gas
- 2.8%Utility gas
Private vs. public school enrollment:
| Here: | 5.5% |
| Washington: | 9.2% |
| Here: | 8.1% |
| Washington: | 7.0% |
| Here: | 0.0% |
| Washington: | 15.7% |


