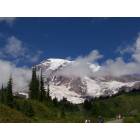
Mount Rainier, Washington
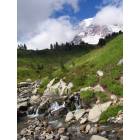
Mount Rainier: Mt. Rainier Aug '08
Mount Rainier: Mt. Rainier Aug '08
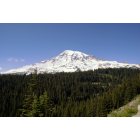
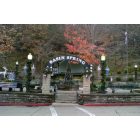
Mount Rainier: Mount Rainier
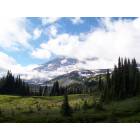
Mount Rainier: Mt. Rainier Aug '08
Mount Rainier: Mt. Rainier Aug '08
Mount Rainier
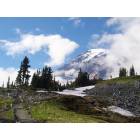
Mount Rainier: Mt. Rainier Aug '08
Mount Rainier: Mt. Rainier Aug '08
Mount Rainier: Mt. Rainier Aug '08
- add
your
Submit your own pictures of this place and show them to the world
- OSM Map
- General Map
- Google Map
- MSN Map

| Males: 1,454 | |
| Females: 1,269 |
| Median resident age: | 38.3 years |
| Washington median age: | 35.3 years |
Zip code: 98323
| Mount Rainier: | $113,098 |
| WA: | $91,306 |
Estimated per capita income in 2022: $43,885 (it was $20,413 in 2000)
Mount Rainier CCD income, earnings, and wages data
Estimated median house or condo value in 2022: $566,469 (it was $151,900 in 2000)
| Mount Rainier: | $566,469 |
| WA: | $569,500 |
Mean prices in 2022: all housing units: $571,140; detached houses: $606,667; townhouses or other attached units: $534,248; in 2-unit structures: $606,121; in 3-to-4-unit structures: $262,548; in 5-or-more-unit structures: $407,089; mobile homes: $200,236; occupied boats, rvs, vans, etc.: $40,477
Detailed information about poverty and poor residents in Mount Rainier, WA


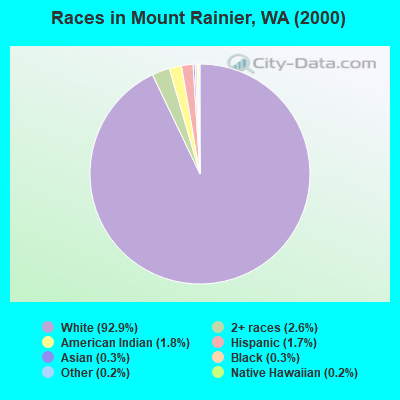
- 2,30292.9%White alone
- 642.6%Two or more races
- 451.8%American Indian alone
- 421.7%Hispanic
- 70.3%Black alone
- 80.3%Asian alone
- 40.2%Native Hawaiian and Other
Pacific Islander alone - 50.2%Other race alone
Races in Mount Rainier detailed stats: ancestries, foreign born residents, place of birth
 Recent articles from our blog. Our writers, many of them Ph.D. graduates or candidates, create easy-to-read articles on a wide variety of topics.
Current Local Time: PST time zone
Land area: 736.5 square miles.
Population density: 3.7 people per square mile (very low).

| Mount Rainier CCD: | 1.4% ($2,160) |
| Washington: | 1.2% ($1,915) |
Nearest city with pop. 50,000+: Enumclaw Plateau, WA (15.6 miles  , pop. 53,853).
Nearest city with pop. 200,000+: East Seattle, WA (43.0 miles , pop. 480,100).
Nearest city with pop. 1,000,000+: Los Angeles, CA (913.9 miles , pop. 3,694,820).
Nearest cities:
), )Latitude: 47.04 N, Longitude: 121.81 W
Area code commonly used in this area: 360

Mount Rainier tourist attractions:
| Here: | 5.5% |
| Washington: | 4.6% |
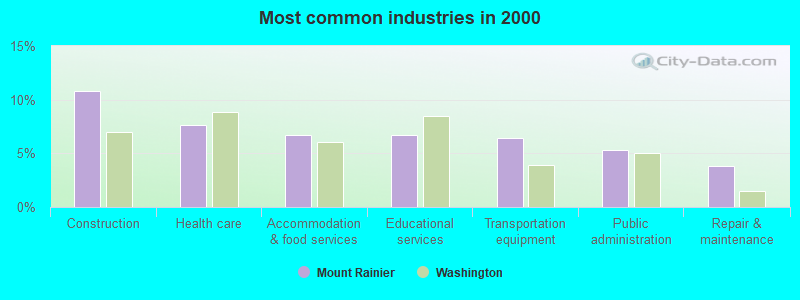
- Construction (10.8%)
- Health care (7.6%)
- Accommodation & food services (6.7%)
- Educational services (6.7%)
- Transportation equipment (6.4%)
- Public administration (5.3%)
- Repair & maintenance (3.8%)
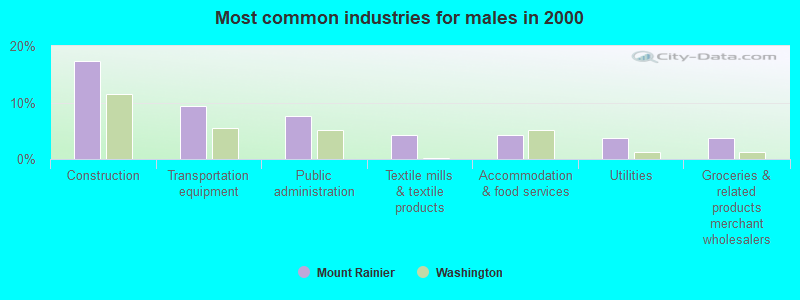
- Construction (17.4%)
- Transportation equipment (9.3%)
- Public administration (7.6%)
- Textile mills & textile products (4.2%)
- Accommodation & food services (4.2%)
- Utilities (3.8%)
- Groceries & related products merchant wholesalers (3.8%)
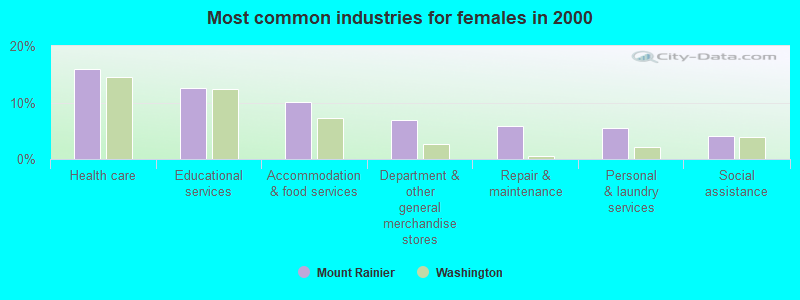
- Health care (16.0%)
- Educational services (12.5%)
- Accommodation & food services (10.1%)
- Department & other general merchandise stores (6.8%)
- Repair & maintenance (5.9%)
- Personal & laundry services (5.5%)
- Social assistance (4.0%)
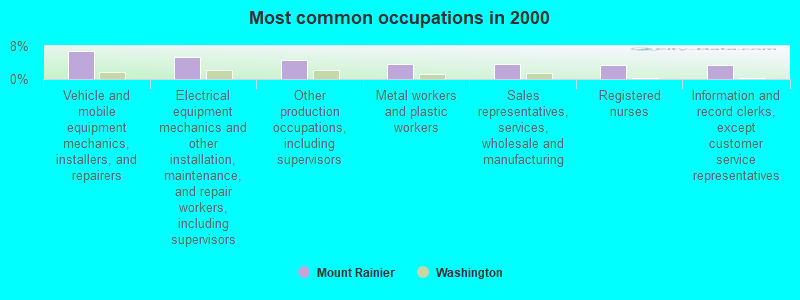
- Vehicle and mobile equipment mechanics, installers, and repairers (6.8%)
- Electrical equipment mechanics and other installation, maintenance, and repair workers, including supervisors (5.4%)
- Other production occupations, including supervisors (4.5%)
- Metal workers and plastic workers (3.6%)
- Sales representatives, services, wholesale and manufacturing (3.5%)
- Registered nurses (3.5%)
- Information and record clerks, except customer service representatives (3.4%)
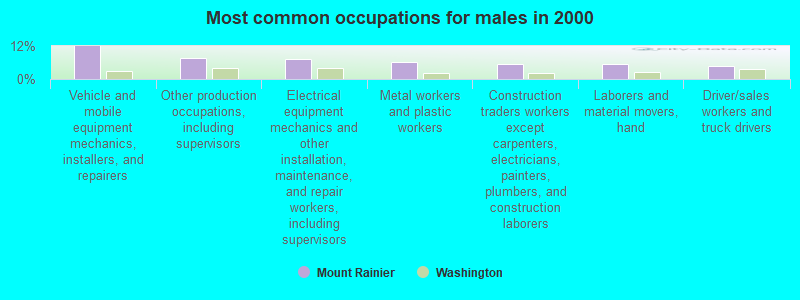
- Vehicle and mobile equipment mechanics, installers, and repairers (11.8%)
- Other production occupations, including supervisors (7.8%)
- Electrical equipment mechanics and other installation, maintenance, and repair workers, including supervisors (7.4%)
- Metal workers and plastic workers (6.3%)
- Construction traders workers except carpenters, electricians, painters, plumbers, and construction laborers (5.6%)
- Laborers and material movers, hand (5.6%)
- Driver/sales workers and truck drivers (4.9%)
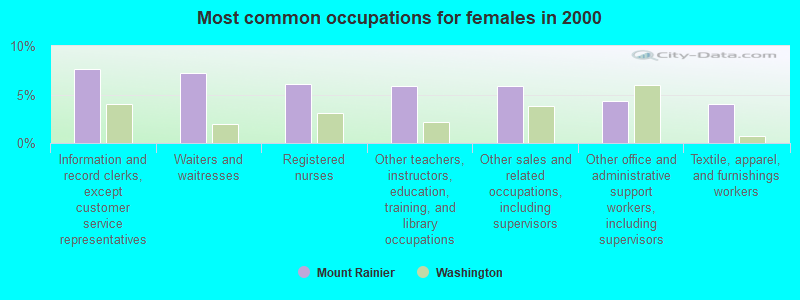
- Information and record clerks, except customer service representatives (7.6%)
- Waiters and waitresses (7.2%)
- Registered nurses (6.1%)
- Other teachers, instructors, education, training, and library occupations (5.9%)
- Other sales and related occupations, including supervisors (5.9%)
- Other office and administrative support workers, including supervisors (4.4%)
- Textile, apparel, and furnishings workers (4.0%)
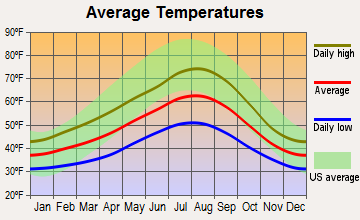
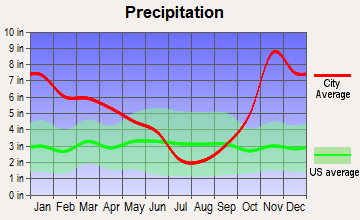
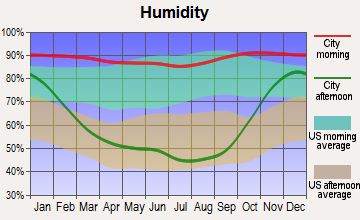
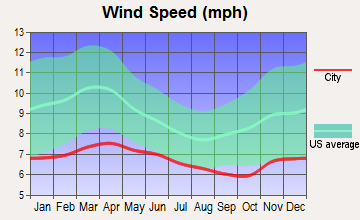
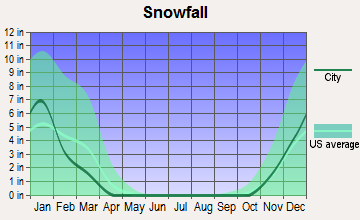
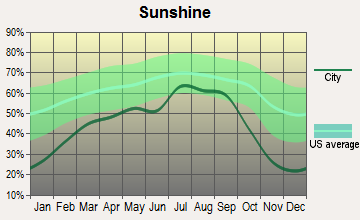
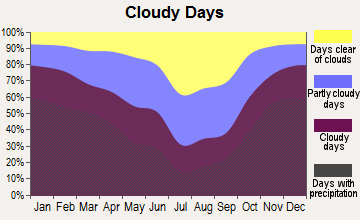
Average climate in Mount Rainier, Washington
Based on data reported by over 4,000 weather stations
(lower is better)
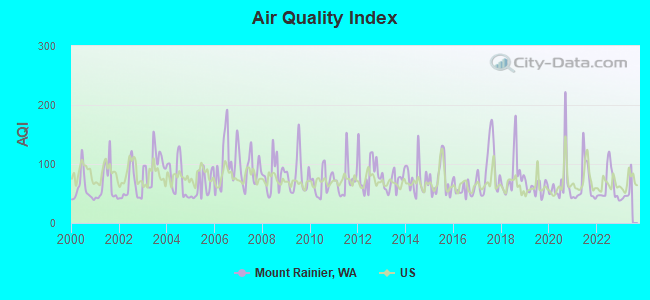
Air Quality Index (AQI) level in 2022 was 62.7. This is about average.
| City: | 62.7 |
| U.S.: | 72.6 |
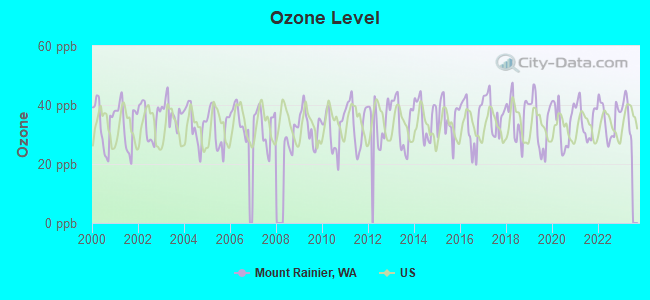
Ozone [ppb] level in 2022 was 35.1. This is about average. Closest monitor was 5.6 miles away from the city center.
| City: | 35.1 |
| U.S.: | 33.3 |
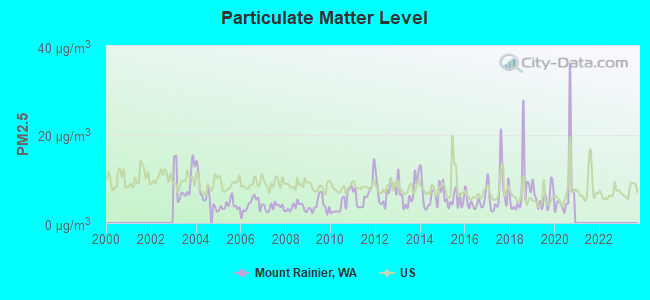
Particulate Matter (PM2.5) [µg/m3] level in 2020 was 7.40. This is about average. Closest monitor was 9.0 miles away from the city center.
| City: | 7.40 |
| U.S.: | 8.11 |
Earthquake activity:
Mount Rainier-area historical earthquake activity is significantly above Washington state average. It is 1430% greater than the overall U.S. average.On 4/13/1949 at 19:55:42, a magnitude 7.0 (7.0 UK, Class: Major, Intensity: VIII - XII) earthquake occurred 35.3 miles away from the city center, causing $80,000,000 total damage
On 2/28/2001 at 18:54:32, a magnitude 6.8 (6.5 MB, 6.6 MS, 6.8 MW, Class: Strong, Intensity: VII - IX) earthquake occurred 36.2 miles away from Mount Rainier center, causing $2,000,000,000 total damage and $305,000,000 insured losses
On 2/28/2001 at 18:54:32, a magnitude 6.8 (6.8 MD, Depth: 32.2 mi) earthquake occurred 43.6 miles away from Mount Rainier center
On 4/29/1965 at 15:28:43, a magnitude 6.6 (6.6 UK) earthquake occurred 30.9 miles away from Mount Rainier center, causing $28,000,000 total damage
On 7/3/1999 at 01:43:54, a magnitude 5.8 (5.4 MB, 5.5 MS, 5.8 MW, 5.3 ME, Depth: 25.2 mi, Class: Moderate, Intensity: VI - VII) earthquake occurred 66.9 miles away from Mount Rainier center
On 2/14/1981 at 06:09:27, a magnitude 5.5 (5.1 MB, 4.8 MS, 5.5 ML) earthquake occurred 42.3 miles away from Mount Rainier center
Magnitude types: body-wave magnitude (MB), duration magnitude (MD), energy magnitude (ME), local magnitude (ML), surface-wave magnitude (MS), moment magnitude (MW)
Natural disasters:
The number of natural disasters in Pierce County (21) is greater than the US average (15).Major Disasters (Presidential) Declared: 20
Emergencies Declared: 1
Causes of natural disasters: Floods: 13, Storms: 10, Mudslides: 5, Landslides: 4, Winter Storms: 4, Earthquakes: 2, Heavy Rains: 2, Winds: 2, Hurricane: 1, Volcanic Eruption: 1, Other: 1 (Note: some incidents may be assigned to more than one category).
Hospitals and medical centers near Mount Rainier:
Colleges/universities with over 2000 students nearest to Mount Rainier:
- Pierce College at Puyallup (about 23 miles; Puyallup, WA; Full-time enrollment: 2,529)
- Green River Community College (about 26 miles; Auburn, WA; FT enrollment: 7,425)
- Pacific Lutheran University (about 31 miles; Tacoma, WA; FT enrollment: 3,548)
- University of Washington-Tacoma Campus (about 33 miles; Tacoma, WA; FT enrollment: 3,788)
- Bates Technical College (about 34 miles; Tacoma, WA; FT enrollment: 4,929)
- Highline Community College (about 34 miles; Des Moines, WA; FT enrollment: 6,074)
- Clover Park Technical College (about 34 miles; Lakewood, WA; FT enrollment: 4,185)
Points of interest:
Notable locations in Mount Rainier: Sand Flats (A), Silver Springs Campground (B), Sun Top Viewpoint (C), Tahoma Vista (D), Cougar Rock Campground (E), Dry Creek Campground (F), Crystal Mountain Ski Resort (G), Alta Crystal Chalets (H), Mowich Lake Entrance (I), Camp Curtis (J), Camp Muir (K), Camp Schurman (L), Golden Gate (M), Lake James Patrol Cabin (N), Sunrise Lodge (O), Seattle University Lodge (P), The Dalles Recreation Area (Q), Carbon River Ranger Station (R), Carbon River Entrance (S), Camp Sheppard Boy Scout Camp (T). Display/hide their locations on the map
Lakes and reservoirs: Shriner Lake (A), Green Lake (B), Kenworthy Lake (C), Reese Lake (D), Clover Lake (E), Miners Lakes (F), Greenwater Lakes (G), Bear Lake (H). Display/hide their locations on the map
Streams, rivers, and creeks: Bear Creek (A), Beaver Creek (B), Buck Creek (C), Burns Creek (D), Byron Creek (E), Camp Creek (F), Canyon Creek (G), Cataract Creek (H), Cayada Creek (I). Display/hide their locations on the map
Parks in Mount Rainier include: Stevens-Van Trump Historical Monument (1), Mount Rainier National Park (2), Marine Memorial Airplane Crash Monument (3), Aurora Park (4), Klapatche Park (5), Sunset Park (6). Display/hide their locations on the map
| This place: | 2.7 people |
| Washington: | 2.5 people |
| This place: | 74.2% |
| Whole state: | 64.4% |
| This place: | 8.0% |
| Whole state: | 7.7% |
Likely homosexual households (counted as self-reported same-sex unmarried-partner households)
- Lesbian couples: 0.4% of all households
- Gay men: 0.2% of all households
| This place: | 6.1% |
| Whole state: | 10.6% |
| This place: | 1.0% |
| Whole state: | 4.6% |
People in group quarters in Mount Rainier in 2010:
- 36 people in workers' group living quarters and job corps centers
- 4 people in group homes intended for adults
- 4 people in other noninstitutional facilities
For population 15 years and over in Mount Rainier:
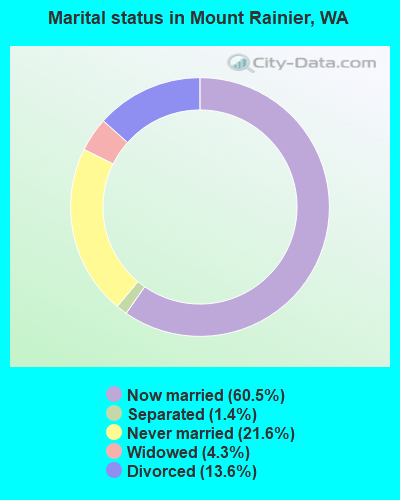
- Never married: 21.6%
- Now married: 60.5%
- Separated: 1.4%
- Widowed: 4.3%
- Divorced: 13.6%
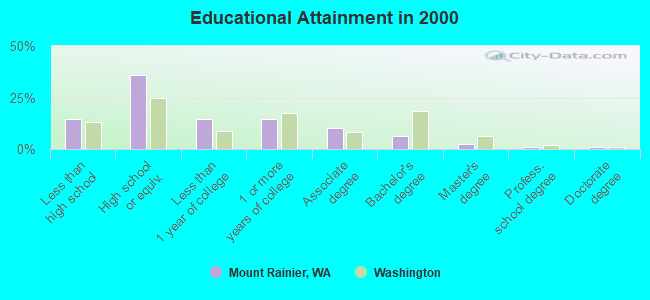
For population 25 years and over in Mount Rainier:
- High school or higher: 85.5%
- Bachelor's degree or higher: 10.9%
- Graduate or professional degree: 4.4%
- Unemployed: 2.7%
- Mean travel time to work (commute): 38.3 minutes
| Here: | 8.3 |
| Washington average: | 11.3 |
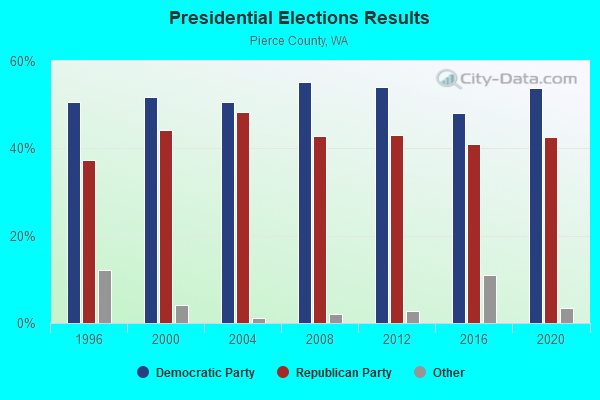
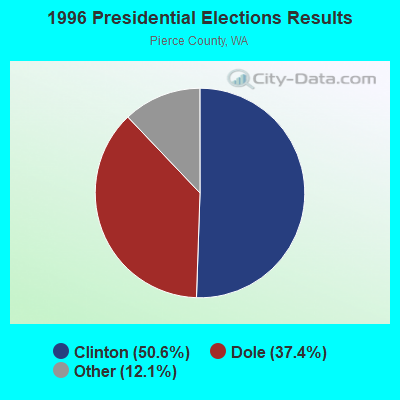
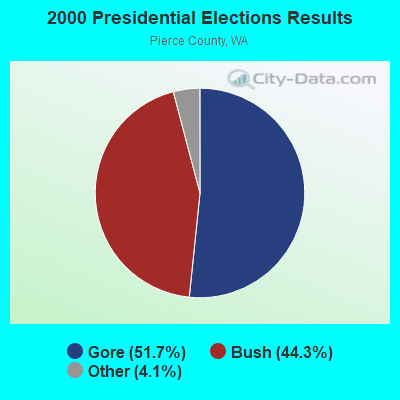
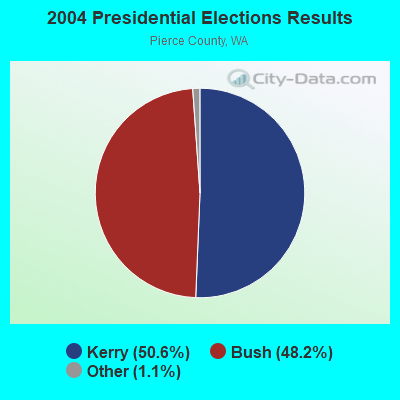
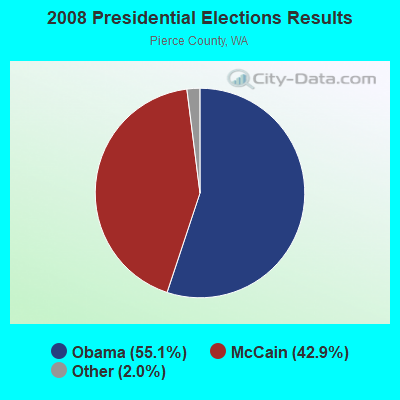
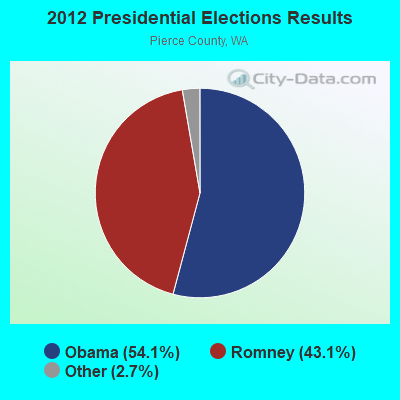
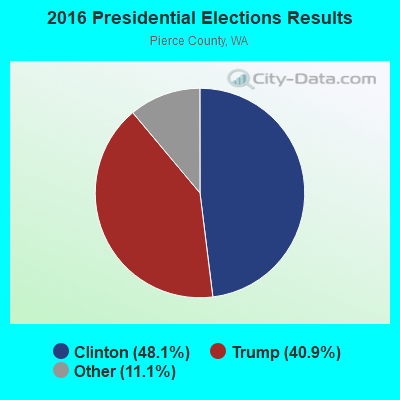
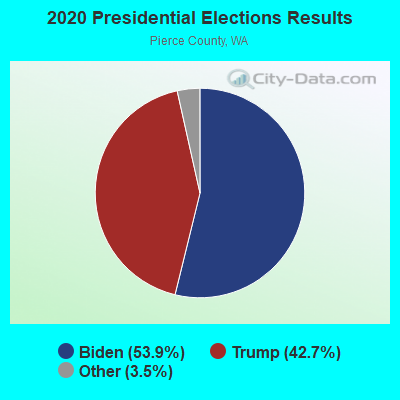
Graphs represent county-level data. Detailed 2008 Election Results
Religion statistics for Mount Rainier, WA (based on Pierce County data)
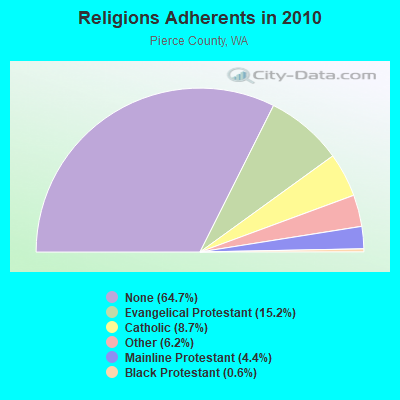
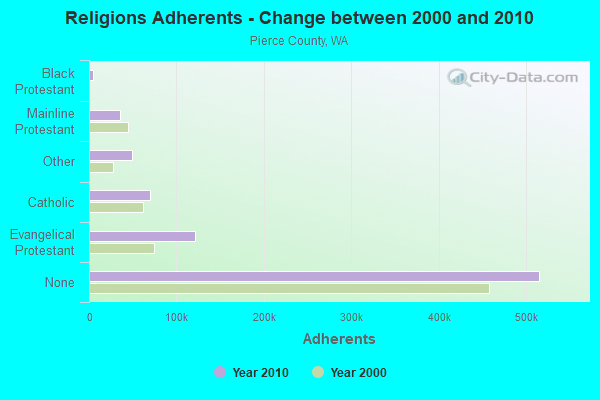
| Religion | Adherents | Congregations |
|---|---|---|
| Evangelical Protestant | 121,041 | 365 |
| Catholic | 69,558 | 26 |
| Other | 49,446 | 109 |
| Mainline Protestant | 34,906 | 123 |
| Black Protestant | 4,817 | 17 |
| Orthodox | 605 | 4 |
| None | 514,852 | - |
Food Environment Statistics:
| Pierce County: | 1.71 / 10,000 pop. |
| Washington: | 2.06 / 10,000 pop. |
| Here: | 0.17 / 10,000 pop. |
| Washington: | 0.19 / 10,000 pop. |
| Pierce County: | 1.36 / 10,000 pop. |
| Washington: | 1.18 / 10,000 pop. |
| Here: | 1.97 / 10,000 pop. |
| Washington: | 2.67 / 10,000 pop. |
| Pierce County: | 6.61 / 10,000 pop. |
| State: | 8.26 / 10,000 pop. |
| This county: | 8.4% |
| Washington: | 7.7% |
| This county: | 29.3% |
| Washington: | 25.7% |
| This county: | 14.1% |
| State: | 13.9% |
8.45% of this county's 2021 resident taxpayers lived in other counties in 2020 ($69,857 average adjusted gross income)
| Here: | 8.45% |
| Washington average: | 7.53% |
0.15% of residents moved from foreign countries ($1,028 average AGI)
Pierce County: 0.15% Washington average: 0.05%
Top counties from which taxpayers relocated into this county between 2020 and 2021:
| from King County, WA | |
| from Thurston County, WA | |
| from Kitsap County, WA |
8.36% of this county's 2020 resident taxpayers moved to other counties in 2021 ($66,301 average adjusted gross income)
| Here: | 8.36% |
| Washington average: | 7.40% |
0.12% of residents moved to foreign countries ($853 average AGI)
Pierce County: 0.12% Washington average: 0.04%
Top counties to which taxpayers relocated from this county between 2020 and 2021:
| to King County, WA | |
| to Thurston County, WA | |
| to Kitsap County, WA |
Strongest AM radio stations in Mount Rainier:
- KJR (950 AM; 50 kW; SEATTLE, WA)
- KIRO (710 AM; 50 kW; SEATTLE, WA; Owner: ENTERCOM SEATTLE LICENSE, LLC)
- KTTH (770 AM; 50 kW; SEATTLE, WA; Owner: ENTERCOM SEATTLE LICENSE, LLC)
- KGNW (820 AM; 50 kW; BURIEN-SEATTLE, WA; Owner: INSPIRATION MEDIA, INC.)
- KIXI (880 AM; 50 kW; MERCER ISLAND/SEATTL, WA; Owner: BELLEVUE RADIO, INC.)
- KYCW (1090 AM; 50 kW; SEATTLE, WA; Owner: INFINITY RADIO SUBSIDIARY OPERATIONS INC.)
- KNWX (1210 AM; 28 kW; AUBURN-FEDERAL WAY, WA; Owner: ENTERCOM SEATTLE LICENSE, LLC)
- KOMO (1000 AM; 50 kW; SEATTLE, WA; Owner: FISHER BROADCASTING - SEATTLE RADIO, L.L.C.)
- KKOL (1300 AM; 50 kW; SEATTLE, WA; Owner: INSPIRATION MEDIA, INC.)
- KHHO (850 AM; 10 kW; TACOMA, WA; Owner: ACKERLEY MEDIA GROUP, INC.)
- KRKO (1380 AM; 50 kW; EVERETT, WA; Owner: S-R BROADCASTING, CO.)
- KRIZ (1420 AM; 10 kW; RENTON, WA; Owner: KRIZ BROADCASTING, INC.)
- KZIZ (1560 AM; 5 kW; SUMNER, WA; Owner: KRIZ BROADCASTING, INC.)
Strongest FM radio stations in Mount Rainier:
- K201EX (88.1 FM; GREENWATER, WA; Owner: CALVARY CHAPEL OF TWIN FALLS, INC.)
- KZOK-FM (102.5 FM; SEATTLE, WA; Owner: INFINITY RADIO SUBSIDIARY OPERATIONS INC.)
- KMPS-FM (94.1 FM; SEATTLE, WA; Owner: INFINITY RADIO SUBSIDIARY OPERATIONS INC.)
- KBKS (106.1 FM; TACOMA, WA; Owner: INFINITY RADIO SUBSIDIARY OPERATIONS INC.)
- KING-FM (98.1 FM; SEATTLE, WA; Owner: CLASSIC RADIO, INC.)
- KLSY-FM (92.5 FM; BELLEVUE, WA; Owner: BELLEVUE RADIO INC.)
- KPLU-FM (88.5 FM; TACOMA, WA; Owner: PACIFIC LUTHERAN UNIVERSITY, INC.)
- KWJZ (98.9 FM; SEATTLE, WA; Owner: ORCA RADIO, INC.)
- KBSG-FM (97.3 FM; TACOMA, WA; Owner: ENTERCOM SEATTLE LICENSE, LLC)
- KMTT (103.7 FM; TACOMA, WA; Owner: ENTERCOM SEATTLE LICENSE, LLC)
- KNDD (107.7 FM; SEATTLE, WA; Owner: ENTERCOM SEATTLE LICENSE, LLC)
- KYPT (96.5 FM; SEATTLE, WA; Owner: INFINITY RADIO SUBSIDIARY OPERATIONS INC.)
- KXXO (96.1 FM; OLYMPIA, WA; Owner: 3 CITIES, INC.)
- KQBZ (100.7 FM; SEATTLE, WA; Owner: ENTERCOM SEATTLE LICENSE, LLC)
- KISW (99.9 FM; SEATTLE, WA; Owner: ENTERCOM SEATTLE LICENSE, LLC)
- KJR-FM (95.7 FM; SEATTLE, WA; Owner: ACKERLEY MEDIA GROUP, INC.)
- KUBE (93.3 FM; SEATTLE, WA; Owner: ACKERLEY MEDIA GROUP, INC.)
- KPLZ-FM (101.5 FM; SEATTLE, WA; Owner: FISHER BROADCASTING - SEATTLE RADIO, L.L.C.)
- KNHC (89.5 FM; SEATTLE, WA; Owner: SEATTLE PUBLIC SCHOOLS)
- KPQ-FM (102.1 FM; WENATCHEE, WA; Owner: WESCOAST BROADCASTING COMPANY)
TV broadcast stations around Mount Rainier:
- K25CH (Channel 25; NORTH BEND, WA; Owner: TRIBUNE TELEVISION HOLDINGS, INC.)
- KHCV (Channel 45; SEATTLE, WA; Owner: NORTH PACIFIC INTERNATIONAL TELEVISION, INC.)
- KWPX (Channel 33; BELLEVUE, WA; Owner: PAXSON COMMUNICATIONS LICENSE COMPANY, LLC)
- KWDK (Channel 56; TACOMA, WA; Owner: PUGET SOUND EDUCATIONAL TV, INC.)
FCC Registered Broadcast Land Mobile Towers:
1- MOBILE UNITS, Lat: 46.950556 Lon: -121.812361, Call Sign: WQWR930,
Assigned Frequencies: 156.060 MHz, 154.160 MHz, 155.370 MHz, Grant Date: 11/03/2015, Expiration Date: 11/03/2025, Certifier: Tim Lenk, Registrant: Stantec, 4100 194th St. Sw Suite 400, Lynnwood, WA 98036, Phone: (206) 667-0547, Fax: (206) 667-0554, Email:
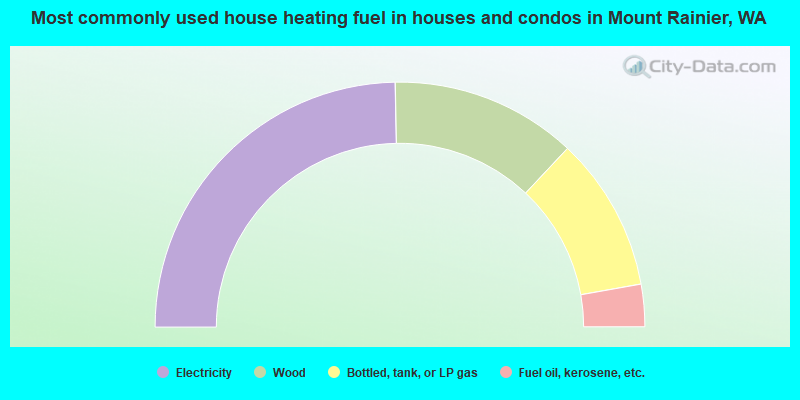
- 49.4%Electricity
- 24.6%Wood
- 20.4%Bottled, tank, or LP gas
- 5.6%Fuel oil, kerosene, etc.
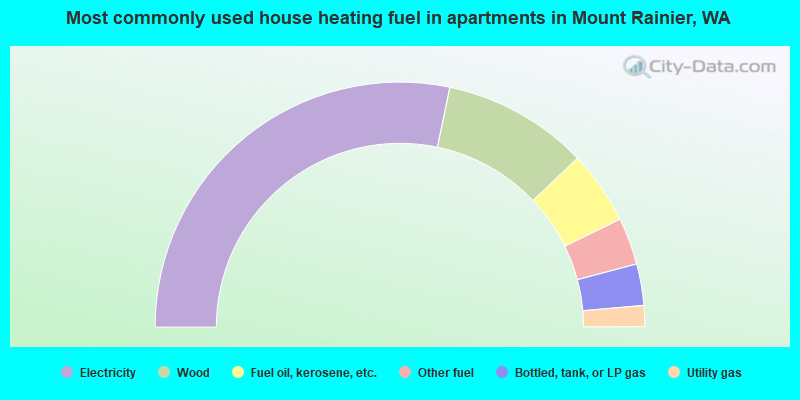
- 56.6%Electricity
- 19.3%Wood
- 9.7%Fuel oil, kerosene, etc.
- 6.2%Other fuel
- 5.5%Bottled, tank, or LP gas
- 2.8%Utility gas
Mount Rainier compared to Washington state average:
- Unemployed percentage significantly below state average.
- Black race population percentage significantly below state average.
- Hispanic race population percentage significantly below state average.
- Median age above state average.
- Foreign-born population percentage significantly below state average.
- Renting percentage below state average.
- Length of stay since moving in significantly above state average.
- Number of rooms per house significantly below state average.
- House age significantly below state average.
- Institutionalized population percentage significantly above state average.
- Number of college students below state average.
- Percentage of population with a bachelor's degree or higher significantly below state average.