Millington, MD (Maryland) Houses and Residents
| Millington: | $221,806 |
| Maryland: | $398,100 |
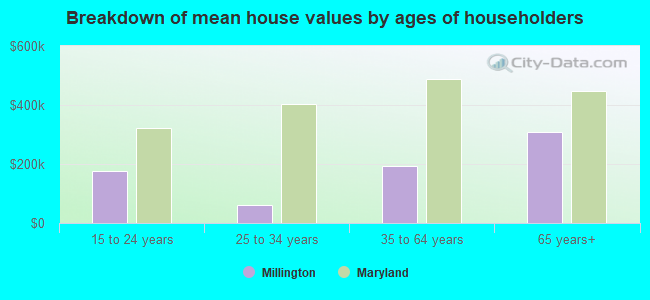
Mean price in 2022:
Detached houses: $224,227
Here: $224,227 State: $526,819 Townhouses or other attached units: $164,067
Here: $164,067 State: $328,305
Total population: 623 (Urban population: 0, Rural population: 388 (all nonfarm))
Houses: 307 (257 occupied: 201 owner occupied, 59 renter occupied)
| % of renters here: | 23% |
| State: | 32% |
Housing density: 955 houses/condos per square mile
Median price asked for vacant for-sale houses and condos in 2022: $243,448.
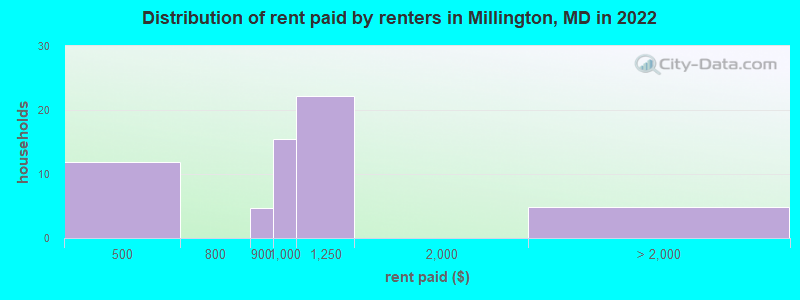
Median contract rent in 2022: $957 (lower quartile is $819, upper quartile is $1,118)
Median rent asked for vacant for-rent units in 2022: $3,371
Median gross rent in Millington, MD in 2022: $1,266
Housing units in Millington with a mortgage: 152 (4 second mortgage, 0 home equity loan, 2 both second mortgage and home equity loan)
Houses without a mortgage: 0
Median household income for houses/condos with a mortgage: $59,387
Median household income for apartments without a mortgage: $28,233
Median monthly housing costs: $1,300
Compare current foreclosures near Millington, MD:
| Photo | Address | Area | Beds / Baths | Price | Details |
|---|---|---|---|---|---|

|
#1
Sudlersville Rd
Sudlersville, MD 21668
|
1,657 sq. feet
|
2 baths 3 beds |
$415,000
|
show details |

|
#2
Waterview Ln
Chestertown, MD 21620
|
2,153 sq. feet
|
2 baths 2 beds |
$310,000
|
show details |

|
#3
E North St
Smyrna, DE 19977
|
1,189 sq. feet
|
1 baths 4 beds |
show details | |

|
#4
Swamp Rd
Worton, MD 21678
|
760 sq. feet
|
1 baths 2 beds |
show details | |

|
#5
Marvel Road
Marydel, MD 21649
|
2,475 sq. feet
|
2 baths 4 beds |
show details | |

|
#6
Carnoustie Rd
Dover, DE 19904
|
1,664 sq. feet
|
2 baths 4 beds |
show details | |

|
#7
Montclair Ave
Smyrna, DE 19977
|
1,447 sq. feet
|
2 baths 3 beds |
show details | |

|
#8
Garrisons Lake Blvd
Smyrna, DE 19977
|
1,722 sq. feet
|
2 baths 3 beds |
show details | |

|
#9
Liborio Ln
Smyrna, DE 19977
|
1,428 sq. feet
|
2 baths 3 beds |
show details | |

|
#10
Apoorva Ln
Smyrna, DE 19977
|
3,300 sq. feet
|
2 baths 4 beds |
show details |
| Photo | Address | Area | Beds / Baths | Price | Details |
|---|---|---|---|---|---|

|
#11
Paul Dr
Smyrna, DE 19977
|
1,581 sq. feet
|
1 baths 4 beds |
show details | |

|
#12
Kenton Rd
Dover, DE 19904
|
928 sq. feet
|
1 baths 2 beds |
show details | |

|
#13
Forrest Ave
Dover, DE 19904
|
1,176 sq. feet
|
1 baths 3 beds |
show details | |

|
#14
Sheridan Ln
Smyrna, DE 19977
|
2,968 sq. feet
|
3 baths 4 beds |
show details | |

|
#15
Boxwood Dr
Smyrna, DE 19977
|
2,088 sq. feet
|
2 baths 3 beds |
show details | |

|
#16
W South St
Smyrna, DE 19977
|
2,177 sq. feet
|
2 baths 3 beds |
show details | |

|
#17
Arctic Ln
Smyrna, DE 19977
|
1,684 sq. feet
|
3 baths 3 beds |
show details | |

|
#18
Sheffield Dr
Dover, DE 19901
|
1,572 sq. feet
|
2 baths 3 beds |
show details | |

|
#19
Salerno Dr
Smyrna, DE 19977
|
1,200 sq. feet
|
2 baths 3 beds |
show details | |

|
#20
Carlisle Dr
Dover, DE 19904
|
1,852 sq. feet
|
2 baths 3 beds |
show details |
| Photo | Address | Area | Beds / Baths | Price | Details |
|---|---|---|---|---|---|

|
#21
Nugent Loop
Smyrna, DE 19977
|
1,708 sq. feet
|
2 baths 4 beds |
show details | |

|
#22
Midessa Ct
Dover, DE 19904
|
2,404 sq. feet
|
2 baths 3 beds |
show details | |

|
#23
Red Maple Rd
Smyrna, DE 19977
|
2,557 sq. feet
|
1 baths 3 beds |
show details | |

|
#24
Rons Way
Smyrna, DE 19977
|
1,232 sq. feet
|
2 baths 3 beds |
show details | |

|
#25
Tucket Cir
Dover, DE 19904
|
2,100 sq. feet
|
2 baths 4 beds |
show details | |

|
#26
Pebble Creek Dr
Smyrna, DE 19977
|
4,002 sq. feet
|
2 baths 3 beds |
show details | |

|
#27
Main St
Betterton, MD 21610
|
1,932 sq. feet
|
1 baths - beds |
show details | |

|
#28
Greenwich Dr
Dover, DE 19901
|
1,578 sq. feet
|
2 baths 3 beds |
show details | |

|
#29
E Frazier St
Smyrna, DE 19977
|
1,222 sq. feet
|
1 baths 3 beds |
show details | |

|
#30
White Rabbit Dr
Smyrna, DE 19977
|
1,462 sq. feet
|
2 baths 3 beds |
show details |
| Photo | Address | Area | Beds / Baths | Price | Details |
|---|---|---|---|---|---|

|
#31
Sequoia Dr
Smyrna, DE 19977
|
1,738 sq. feet
|
2 baths 3 beds |
show details | |

|
#32
E Braeburn Dr
Smyrna, DE 19977
|
2,384 sq. feet
|
2 baths 4 beds |
show details | |

|
#33
Sorrell Cir
Smyrna, DE 19977
|
1,413 sq. feet
|
2 baths 2 beds |
show details | |

|
#34
Cannon Mill Dr
Dover, DE 19904
|
1,619 sq. feet
|
2 baths 4 beds |
show details | |

|
#35
Cedarbrook Dr
Smyrna, DE 19977
|
1,061 sq. feet
|
1 baths 2 beds |
show details | |

|
#36
Alonzo Dr
Dover, DE 19904
|
1,548 sq. feet
|
1 baths 3 beds |
show details | |

|
#37
Ann Ave
Dover, DE 19904
|
1,512 sq. feet
|
2 baths 3 beds |
show details | |

|
#38
Heritage Dr
Dover, DE 19904
|
1,980 sq. feet
|
2 baths 3 beds |
show details | |

|
#39
Lamplighter Ln
Dover, DE 19904
|
1,188 sq. feet
|
1 baths 3 beds |
show details | |

|
#40
Woodrow Ct
Dover, DE 19904
|
1,801 sq. feet
|
2 baths 3 beds |
show details |
| Photo | Address | Area | Beds / Baths | Price | Details |
|---|---|---|---|---|---|

|
#41
Woodmill Dr
Dover, DE 19904
|
1,415 sq. feet
|
2 baths 3 beds |
show details | |

|
#42
Wharton Rd
Goldsboro, MD 21636
|
2,400 sq. feet
|
1 baths - beds |
show details | |

|
#43
Gillespie Ave
Middletown, DE 19709
|
- sq. feet
|
2 baths 3 beds |
show details | |

|
#44
Barcelona St
Townsend, DE 19734
|
- sq. feet
|
2 baths 4 beds |
show details | |

|
#45
Lakeside Dr
Middletown, DE 19709
|
- sq. feet
|
2 baths 4 beds |
show details | |

|
#46
Upland Ln
Centreville, MD 21617
|
4,948 sq. feet
|
3 baths - beds |
show details | |

|
#47
Palisade Cir
Middletown, DE 19709
|
- sq. feet
|
3 baths 3 beds |
show details | |

|
#48
Union Church Rd
Townsend, DE 19734
|
- sq. feet
|
2 baths 3 beds |
show details | |

|
#49
Christine Ln
Clayton, DE 19938
|
- sq. feet
|
3 baths 5 beds |
show details | |

|
Check over 1 million property listings on Foreclosure.com!
|
browse all offers | |||

Latest news about housing in Millington, MD collected exclusively by city-data.com from local newspapers, TV, and radio stations

 | Eastern Shore VA Healthcare (1 reply) |
| Question about living DE or living in MD? (3 replies) |

Median year apartment built: 1961
Household type by relationship:
Households: 623- Male householders: 133 (52 living alone), Female householders: 122 (27 living alone)
105 spouses (105 opposite-sex spouses), 19 unmarried partners, (19 opposite-sex unmarried partners), 195 children (189 natural, 0 adopted, 6 stepchildren), 11 grandchildren, 7 brothers or sisters, 9 parents, 0 foster children, 6 other relatives, 16 non-relatives
Size of family households: 55 2-persons, 40 3-persons, 44 4-persons, 26 5-persons, 1 6-persons.
Size of nonfamily households: 82 1-person, 7 2-persons, 2 3-persons.
100 married couples with children.
47 single-parent households (0 men, 47 women).
81.4% of residents of Millington speak English at home.
17.6% of residents speak Spanish at home (50% speak English very well, 23% speak English well, 27% speak English not well).
Foreign born population: 40 (6.4%)
(25.0% of them are naturalized citizens)
| Here: | 6.8 |
| State: | 7.3 |
| Here: | 5.0 |
| State: | 4.2 |
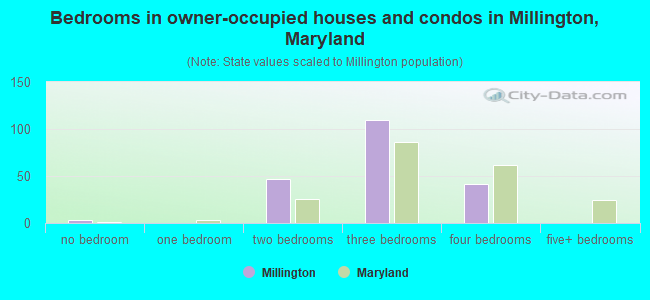
- Bedrooms in owner-occupied houses and condos in Millington, Maryland
- 3no bedroom
- 01 bedroom
- 472 bedrooms
- 1103 bedrooms
- 424 bedrooms
- 05+ bedrooms
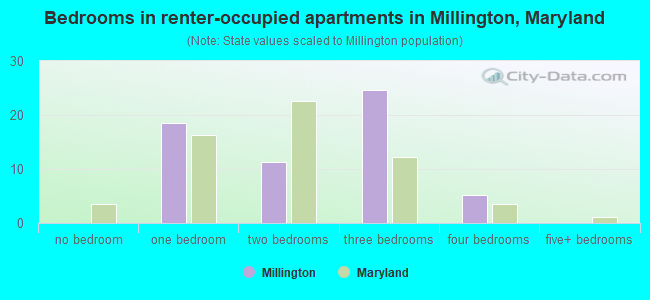
- Bedrooms in renter-occupied apartments in Millington, Maryland
- 0no bedroom
- 181 bedroom
- 112 bedrooms
- 253 bedrooms
- 54 bedrooms
- 05+ bedrooms
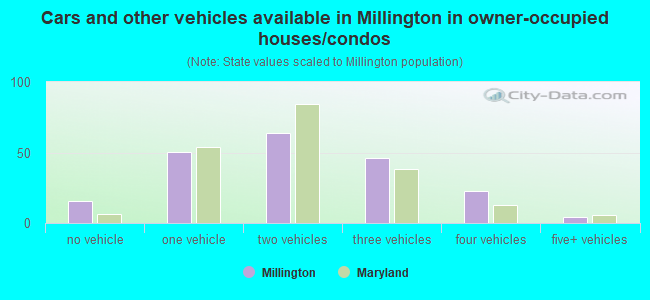
- Cars and other vehicles available in Millington in owner-occupied houses/condos
- 15no vehicle
- 501 vehicle
- 642 vehicles
- 463 vehicles
- 234 vehicles
- 45+ vehicles
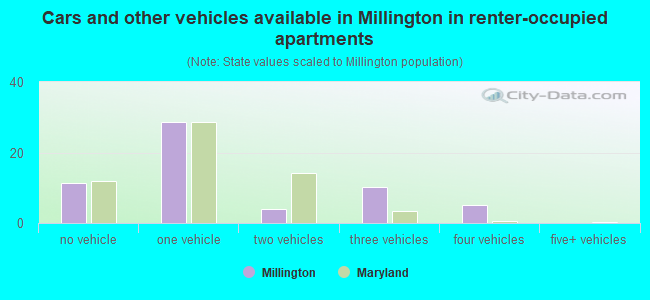
- Cars and other vehicles available in Millington in renter-occupied apartments
- 11no vehicle
- 291 vehicle
- 42 vehicles
- 103 vehicles
- 54 vehicles
- 05+ vehicles
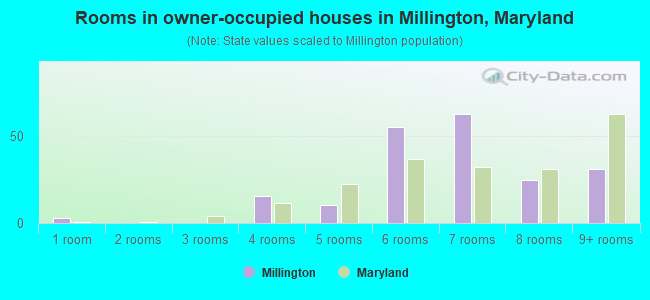
- Rooms in owner-occupied houses in Millington, Maryland
- 31 room
- 02 rooms
- 03 rooms
- 154 rooms
- 105 rooms
- 556 rooms
- 637 rooms
- 258 rooms
- 319+ rooms
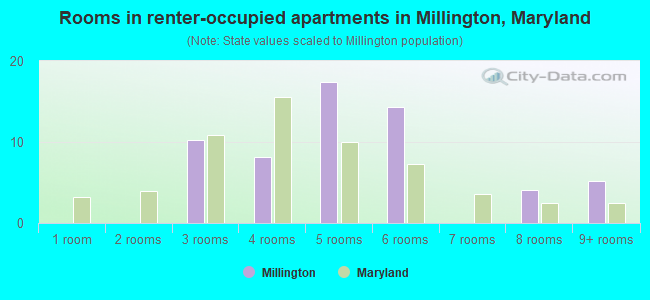
- Rooms in renter-occupied apartments in Millington, Maryland
- 01 room
- 02 rooms
- 103 rooms
- 84 rooms
- 175 rooms
- 146 rooms
- 07 rooms
- 48 rooms
- 59+ rooms
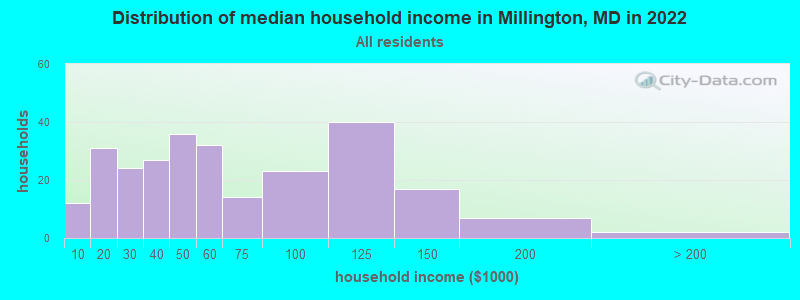
Millington, MD household income distribution

- 12Less than $10,000
- 31$10,000 to $19,999
- 24$20,000 to $29,999
- 27$30,000 to $39,999
- 36$40,000 to $49,999
- 32$50,000 to $59,999
- 14$60,000 to $74,999
- 23$75,000 to $99,999
- 40$100,000 to $124,999
- 17$125,000 to $149,999
- 7$150,000 to $199,999
- 2$200,000 or more
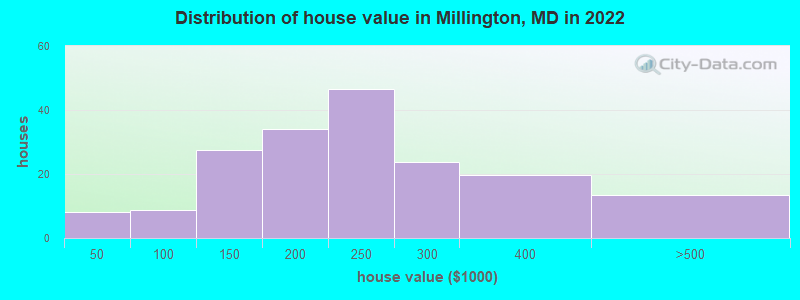
Home value of owner - occupied houses in 2022 in Millington, MD
-
- 7$20,000 to $24,999
- 0$25,000 to $29,999
- 8$80,000 to $89,999
- 13$100,000 to $124,999
- 13$125,000 to $149,999
- 17$150,000 to $174,999
- 16$175,000 to $199,999
- 46$200,000 to $249,999
- 23$250,000 to $299,999
- 19$300,000 to $399,999
- 13$400,000 to $499,999
Rent paid by renters in 2022 in Millington, MD
-
- 5$400 to $449
- 6$450 to $499
- 4$800 to $899
- 15$900 to $999
- 22$1,000 to $1,249
- 4$2,000 to $2,499
Percentage of workers working in this county: 59.5%
Number of people working at home: 18 (5.6% of all workers)
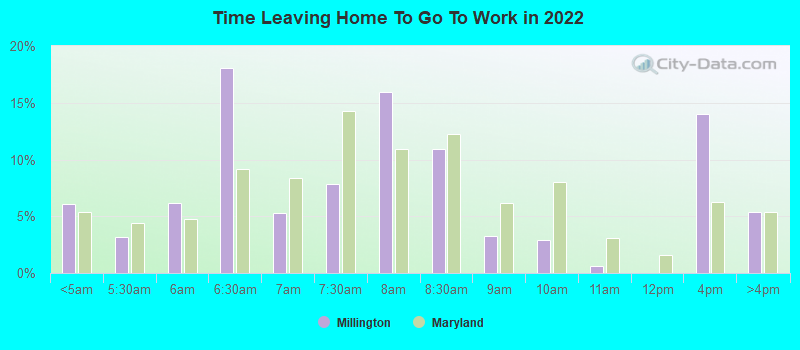
Travel time to work (commute)
- Less than 5 minutes: 22
- 5 to 9 minutes: 4
- 10 to 14 minutes: 30
- 15 to 19 minutes: 54
- 20 to 24 minutes: 58
- 25 to 29 minutes: 52
- 30 to 34 minutes: 23
- 35 to 39 minutes: 19
- 40 to 44 minutes: 7
- 45 to 59 minutes: 9
- 60 to 89 minutes: 15
- 90 or more minutes: 0
Means of transportation to work:
- Drove a car alone: 139 (70.2%)
- Carpooled: 37 (18.7%)
- Bus or trolley bus: 4 (2.0%)
- Walked: 9 (4.5%)
- Worked at home: 9 (4.5%)
- Unemployment by race in 2022
- Unemployment rate for White non-Hispanic residents
- 1.8%Males
- 5.5%Females
- Unemployment rate for Black residents
- 14.9%Males
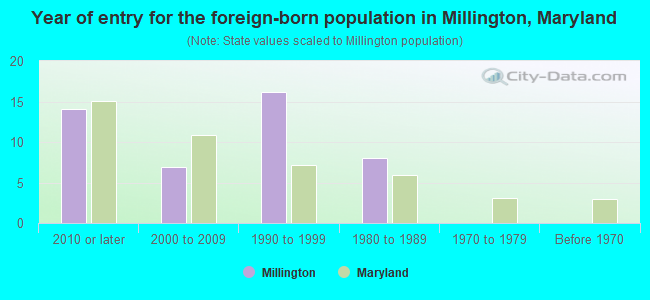
- Year of entry for the foreign-born population in Millington, Maryland
- 142010 or later
- 72000 to 2009
- 161990 to 1999
- 81980 to 1989
- 01970 to 1979
- 0Before 1970
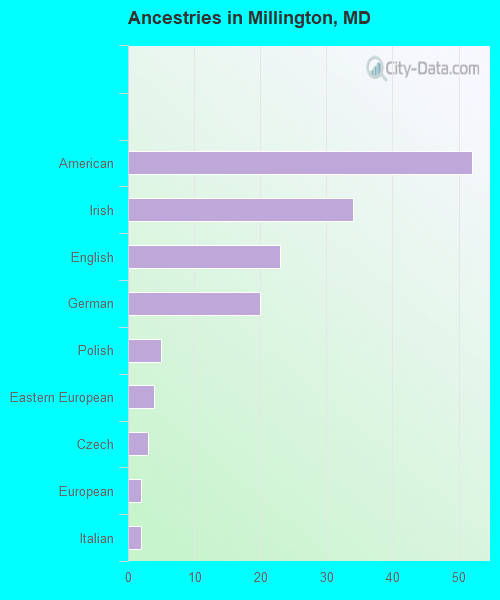
First ancestries reported:
- American: 52 (15.1%)
- Irish: 34 (9.9%)
- English: 23 (6.7%)
- German: 20 (5.8%)
- Polish: 5 (1.5%)
- Eastern European: 4 (1.2%)
- Czech: 3 (0.9%)
- European: 2 (0.6%)
- Italian: 2 (0.6%)
Most common places of birth for foreign-born residents (%):
| Millington: | 72.5% (29) |
| Maryland: | 3.5% (34,065) |
| Millington: | 25.0% (10) |
| Maryland: | 4.4% (42,350) |
Place of birth for U.S.-born residents:
- This state: 399
- Other state: 179
- Northeast: 65
- Midwest: 0
- South: 98
- West: 14
84.8% of Millington residents lived in the same house 1 years ago.
Out of people who lived in different houses, 39.5% lived in this county.
Out of people who lived in different counties, 83.3% lived in Maryland.
| Millington: | 84.8% |
| State average: | 88.5% |
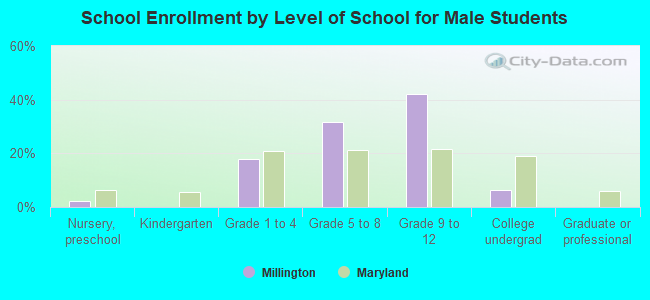
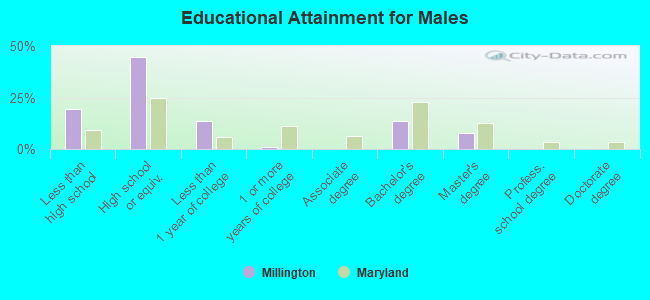
Education attainment for males 25 years and older:
- No schooling: 3
- Nursery to 4th grade: 0
- 5th and 6th grade: 0
- 7th and 8th grade: 8
- 9th grade: 17
- 10th grade: 0
- 11th grade: 0
- 12th grade, no diploma: 6
- High school graduate (or equivalency): 79
- Less than 1 year of college: 24
- Some college more than 1 year, no degree: 2
- Associate degree: 0
- Bachelor's degree: 24
- Master's degree: 14
- Professional school degree: 0
- Doctorate degree: 0
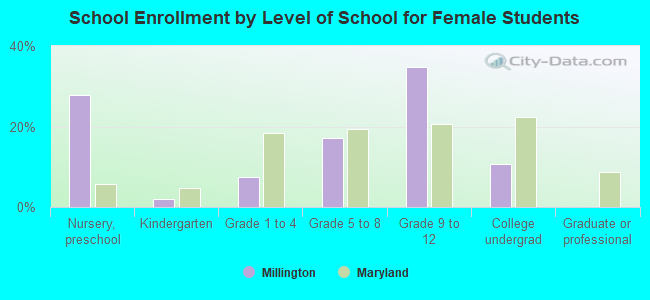
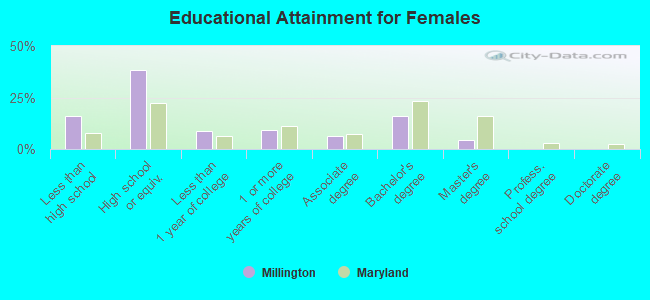
Education attainment for females 25 years and older:
- No schooling: 12
- Nursery to 4th grade: 0
- 5th and 6th grade: 0
- 7th and 8th grade: 5
- 9th grade: 0
- 10th grade: 1
- 11th grade: 15
- 12th grade, no diploma: 0
- High school graduate (or equivalency): 78
- Less than 1 year of college: 18
- Some college more than 1 year, no degree: 19
- Associate degree: 13
- Bachelor's degree: 33
- Master's degree: 9
- Professional school degree: 0
- Doctorate degree: 0


Housing units in structures:
- One, detached: 275
- One, attached: 7
- Two: 2
- 3 or 4: 8
- 5 to 9: 15
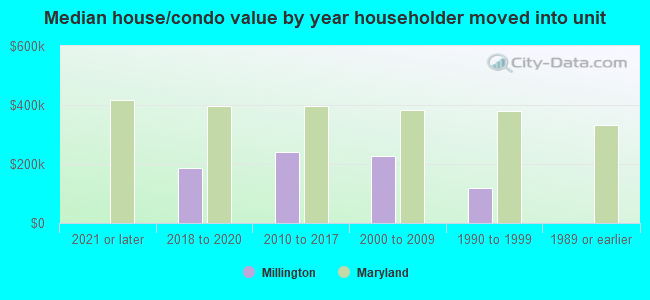
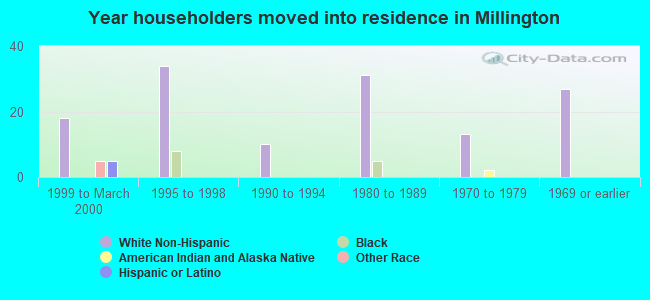
House/condo owner moved in on average 11 years ago
Renter moved in on average 2 years ago
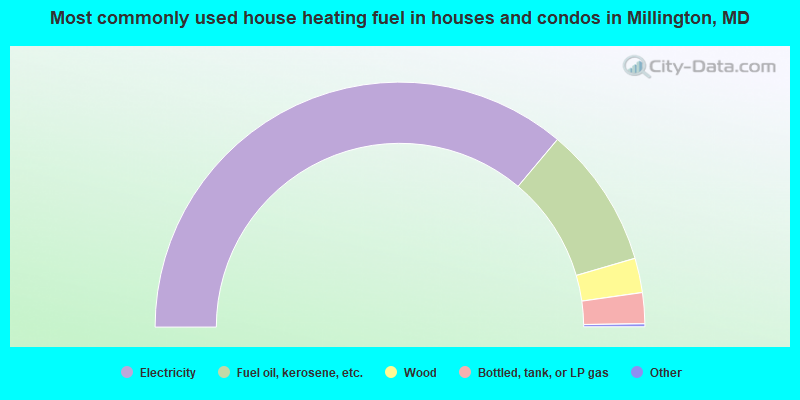
- 72.6%Electricity
- 18.8%Fuel oil, kerosene, etc.
- 4.6%Wood
- 4.1%Bottled, tank, or LP gas
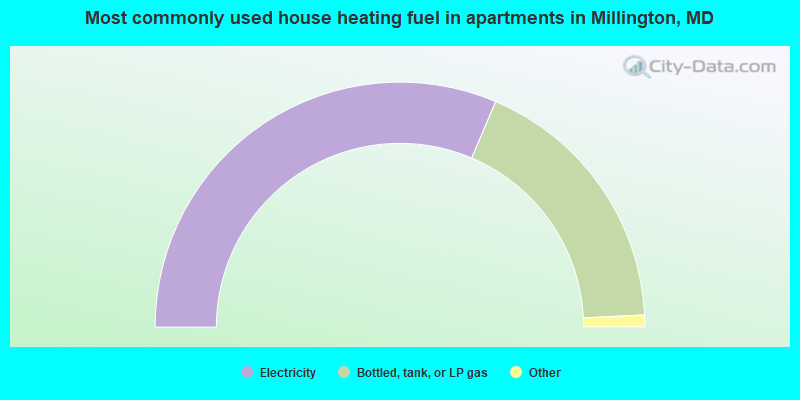
- 63.8%Electricity
- 36.2%Bottled, tank, or LP gas
Private vs. public school enrollment:
| Here: | 6.9% |
| Maryland: | 15.2% |
| Here: | 3.5% |
| Maryland: | 14.4% |
| Here: | 0.0% |
| Maryland: | 20.2% |