The median household income in Millington, MD in 2022 was $49,218, which was 93.0% less than the median annual income of $94,991 across the entire state of Maryland. Compared to the median income of $45,893 in 2000 this represents an increase of 6.8%. The per capita income in 2022 was $26,336, which means an increase of 23.1% compared to 2000 when it was $20,240.
Whole page based on the data from 2000 / 2022 when the population of Millington, Maryland was 416 / 623
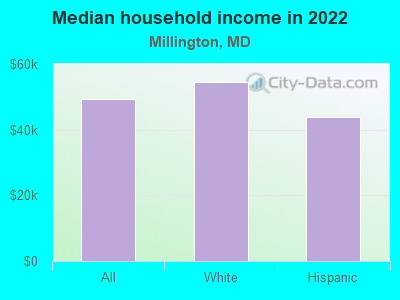
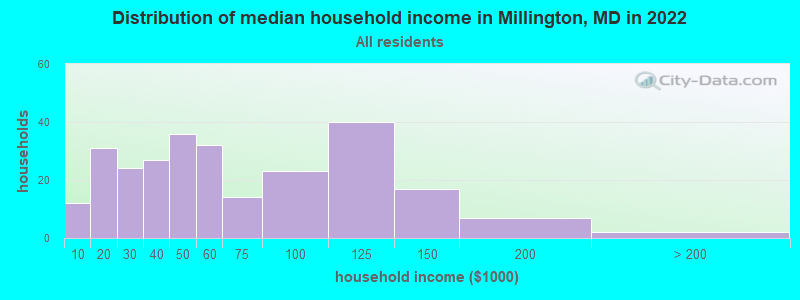
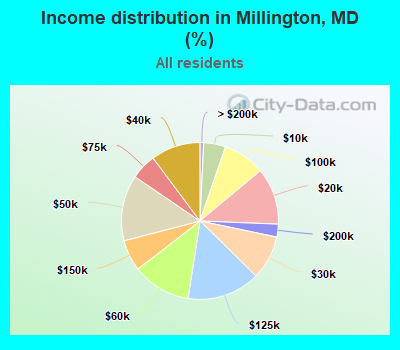
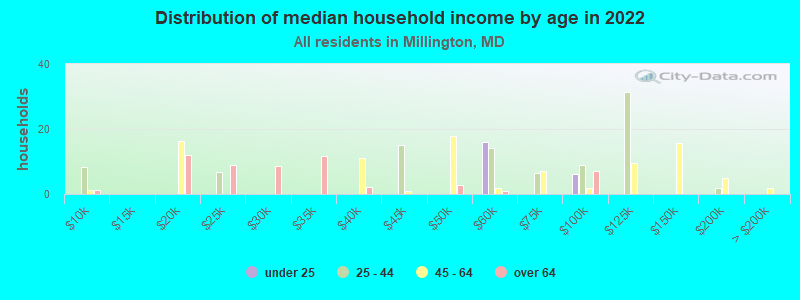
Income statistics for all residents
Median household income in Millington, MD in 2022:
Millington:
$49,218
Maryland:
$94,991
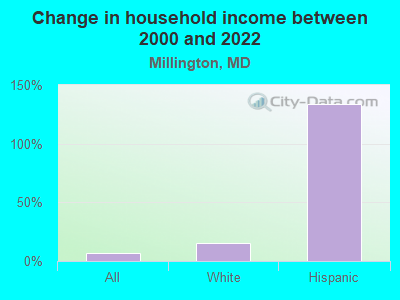
Change in median household income between 2000 and 2022:
Millington, Maryland:
+7.2%
Maryland:
+79.7%
Number of households with income < $10k:
Millington:
4.5% (12)
State:
4.8% (114,450)
Number of households with income $10k - 20k:
Millington:
11.7% (31)
Maryland:
5.0% (117,883)
Number of households with income $20k - 30k:
Millington:
9.1% (24)
State:
5.2% (123,350)
Number of households with income $30k - 40k:
Millington:
10.2% (27)
State:
5.6% (134,104)
Number of households with income $40k - 50k:
Millington:
13.6% (36)
State:
5.6% (132,932)
Number of households with income $50k - 60k:
Millington:
12.1% (32)
State:
5.6% (132,707)
Number of households with income $60k - 75k:
Millington:
5.3% (14)
State:
7.9% (188,335)
Number of households with income $75k - 100k:
Millington:
8.7% (23)
State:
12.5% (297,873)
Number of households with income $100k - 125k:
Millington:
15.1% (40)
State:
10.5% (250,497)
Number of households with income $125k - 150k:
Millington:
6.4% (17)
Maryland:
8.1% (193,208)
Number of households with income $150k - 200k:
Millington:
2.6% (7)
State:
11.6% (274,905)
Number of households with income > $200k:
Millington:
0.8% (2)
Maryland:
17.5% (415,740)
Aggregate household income in Millington in 2022: $16,583,517
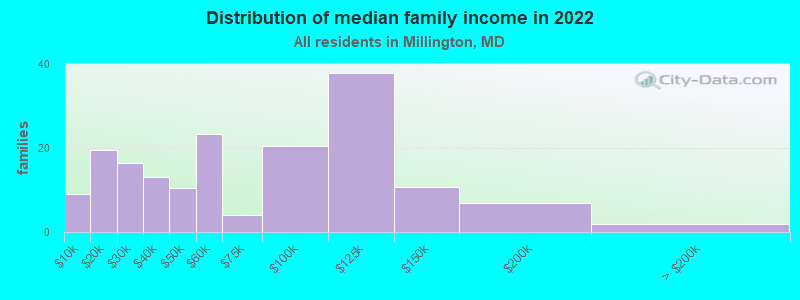
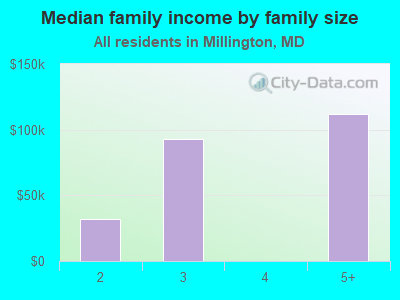
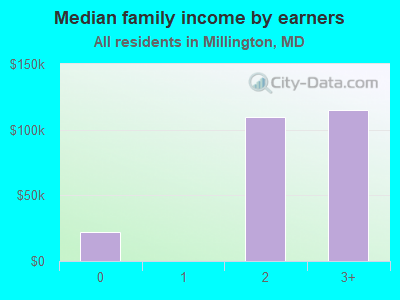
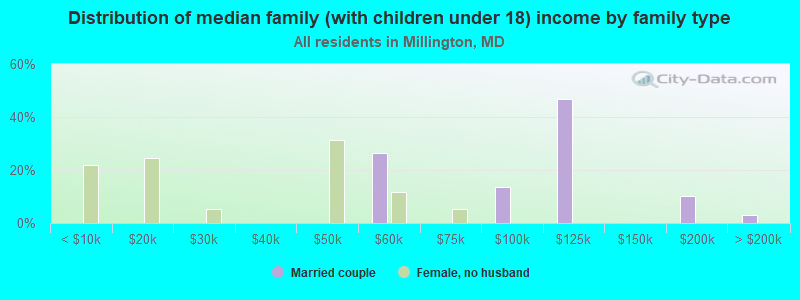
Median family income in Millington in 2022:
Millington:
$57,997
State:
$117,294
Number of families with income < $10k:
Millington:
5.2% (9)
State:
2.7% (41,433)
Number of families with income $10k - 20k:
Millington:
11.3% (20)
Maryland:
2.6% (40,126)
Number of families with income $20k - 30k:
Millington:
9.5% (16)
State:
3.4% (52,891)
Number of families with income $30k - 40k:
Millington:
7.5% (13)
Maryland:
4.5% (70,252)
Number of families with income $40k - 50k:
Millington:
6.0% (10)
Maryland:
4.8% (74,112)
Number of families with income $50k - 60k:
Millington:
13.4% (23)
State:
5.0% (77,590)
Number of families with income $60k - 75k:
Millington:
2.4% (4)
State:
7.1% (109,924)
Number of families with income $75k - 100k:
Millington:
11.7% (20)
State:
12.0% (185,255)
Number of families with income $100k - 125k:
Millington:
21.8% (38)
State:
11.2% (173,203)
Number of families with income $125k - 150k:
Millington:
6.2% (11)
Maryland:
9.3% (143,453)
Number of families with income $150k - 200k:
Millington:
3.9% (7)
Maryland:
14.2% (218,861)
Number of families with income > $200k:
Millington:
1.2% (2)
State:
23.2% (359,182)
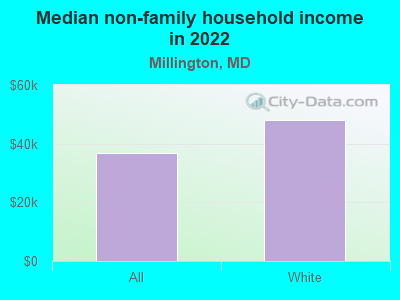
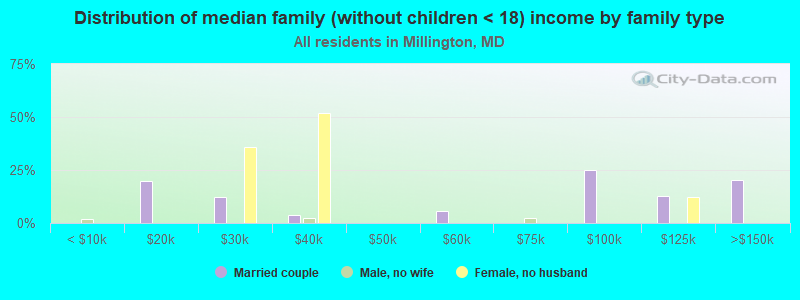
Median non-family income in Millington in 2022:
Millington:
$36,875
State:
$57,179
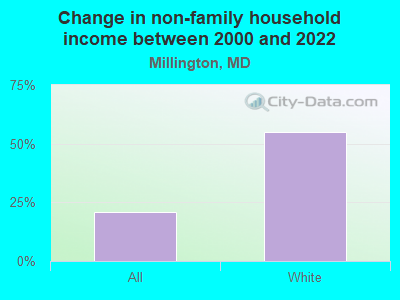
Change in median non-family income between 2000 and 2022:
Millington, Maryland:
+20.9%
State:
+75.1%
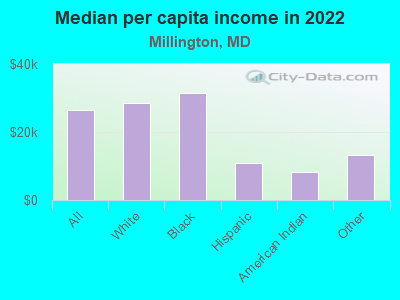
Median per capita income in Millington in 2022:
Millington:
$26,337
State:
$49,236
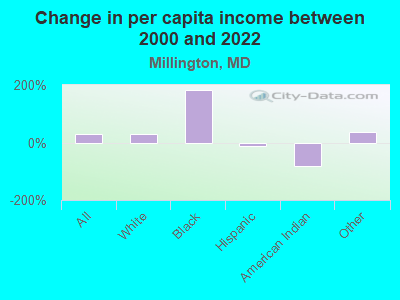
Change in median per capita income between 2000 and 2022:
Millington, Maryland:
+30.1%
Maryland:
+92.2%
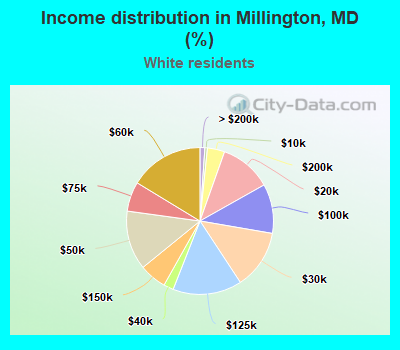
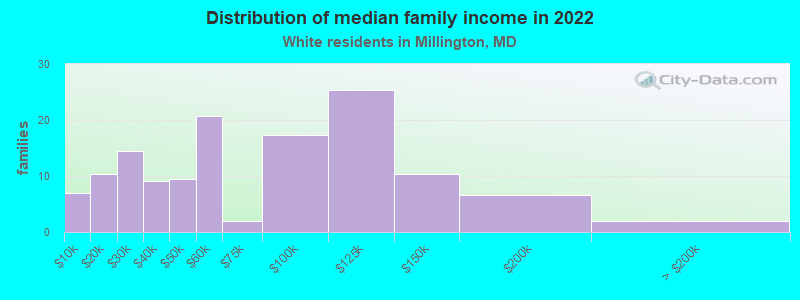
Income statistics for White residents
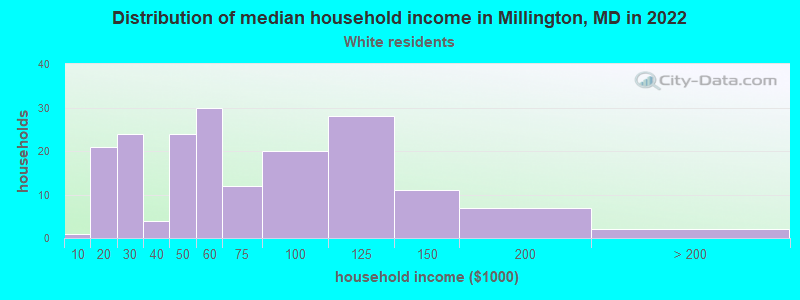
Median household income in Millington, MD in 2022:
Millington:
$54,451
Maryland:
$107,160
Change in median household income between 2000 and 2022:
Millington, Maryland:
+15.1%
Maryland:
+85.3%
Number of households with income < $10k:
Millington:
0.5% (1)
State:
3.7% (47,387)
Number of households with income $10k - 20k:
Millington:
11.4% (21)
Maryland:
4.1% (52,102)
Number of households with income $20k - 30k:
Millington:
13.0% (24)
State:
4.6% (58,758)
Number of households with income $30k - 40k:
Millington:
2.2% (4)
State:
4.7% (59,745)
Number of households with income $40k - 50k:
Millington:
13.0% (24)
State:
5.0% (62,576)
Number of households with income $50k - 60k:
Millington:
16.3% (30)
State:
5.1% (64,484)
Number of households with income $60k - 75k:
Millington:
6.5% (12)
Maryland:
7.7% (97,019)
Number of households with income $75k - 100k:
Millington:
10.9% (20)
State:
11.8% (149,205)
Number of households with income $100k - 125k:
Millington:
15.2% (28)
State:
10.6% (134,231)
Number of households with income $125k - 150k:
Millington:
6.0% (11)
State:
8.8% (111,081)
Number of households with income $150k - 200k:
Millington:
3.8% (7)
State:
12.9% (162,966)
Number of households with income > $200k:
Millington:
1.1% (2)
State:
20.9% (264,377)
Aggregate household income in Millington in 2022: $12,310,585
Median family income in Millington in 2022:
Millington:
$58,527
Maryland:
$134,708
Number of families with income < $10k:
Millington:
5.2% (7)
Maryland:
1.6% (13,064)
Number of families with income $10k - 20k:
Millington:
7.7% (10)
State:
2.0% (16,048)
Number of families with income $20k - 30k:
Millington:
10.8% (15)
Maryland:
2.2% (18,018)
Number of families with income $30k - 40k:
Millington:
6.8% (9)
State:
3.3% (26,886)
Number of families with income $40k - 50k:
Millington:
7.1% (10)
State:
3.6% (29,194)
Number of families with income $50k - 60k:
Millington:
15.4% (21)
Maryland:
4.1% (33,120)
Number of families with income $60k - 75k:
Millington:
1.5% (2)
State:
6.6% (53,501)
Number of families with income $75k - 100k:
Millington:
12.9% (17)
State:
11.3% (91,779)
Number of families with income $100k - 125k:
Millington:
18.8% (25)
State:
11.3% (91,483)
Number of families with income $125k - 150k:
Millington:
7.6% (10)
State:
9.9% (80,832)
Number of families with income $150k - 200k:
Millington:
4.9% (7)
State:
16.0% (130,295)
Number of families with income > $200k:
Millington:
1.4% (2)
State:
28.1% (228,324)
Median non-family income in Millington in 2022:
Millington:
$48,069
State:
$61,991
Change in median non-family income between 2000 and 2022:
Millington, Maryland:
+55.1%
State:
+76.8%
Median per capita income in Millington in 2022:
Millington:
$28,611
State:
$59,750
Change in median per capita income between 2000 and 2022:
Millington, Maryland:
+29.9%
State:
+104.5%
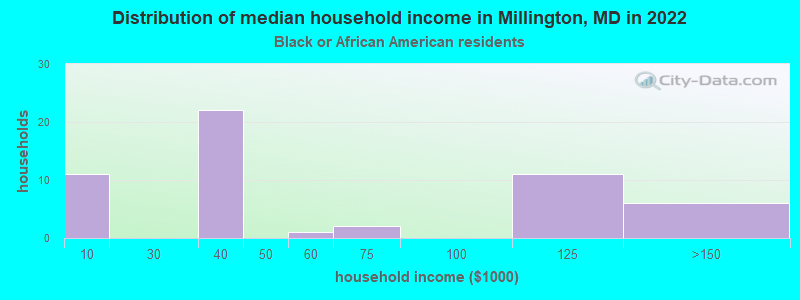
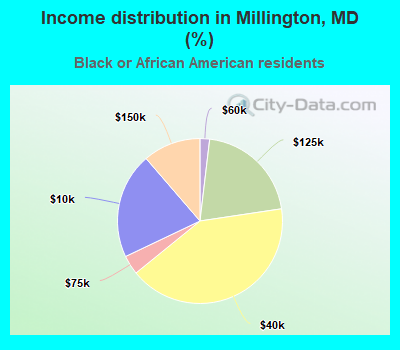
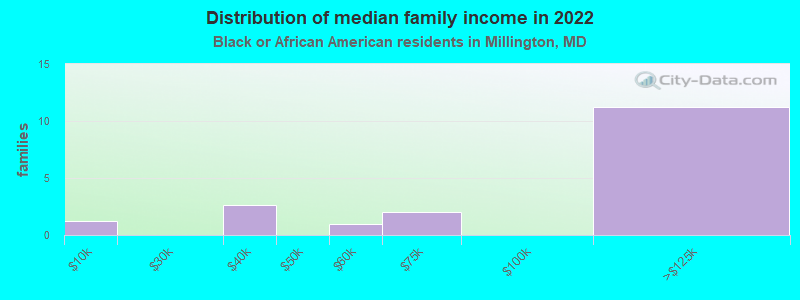
Income statistics for Black or African American residents
Number of households with income < $10k:
Millington:
20.8% (11)
State:
7.0% (50,093)
Number of households with income $10k - 20k:
Millington:
0.0% (0)
Maryland:
7.2% (51,849)
Number of households with income $20k - 30k:
Millington:
0.0% (0)
State:
5.8% (41,510)
Number of households with income $30k - 40k:
Millington:
41.5% (22)
State:
6.9% (49,466)
Number of households with income $40k - 50k:
Millington:
0.0% (0)
State:
6.6% (47,557)
Number of households with income $50k - 60k:
Millington:
1.9% (1)
State:
6.2% (44,818)
Number of households with income $60k - 75k:
Millington:
3.8% (2)
State:
8.6% (61,728)
Number of households with income $75k - 100k:
Millington:
0.0% (0)
Maryland:
13.2% (95,107)
Number of households with income $100k - 125k:
Millington:
20.8% (11)
Maryland:
10.2% (73,579)
Number of households with income $125k - 150k:
Millington:
11.3% (6)
Maryland:
7.2% (51,970)
Number of households with income $150k - 200k:
Millington:
0.0% (0)
Maryland:
9.4% (67,623)
Number of households with income > $200k:
Millington:
0.0% (0)
State:
11.7% (83,862)
Aggregate household income in Millington in 2022: $3,009,256
Median family income in Millington in 2022:
Millington:
$102,427
Maryland:
$96,241
Number of families with income < $10k:
Millington:
6.7% (1)
State:
4.5% (19,574)
Number of families with income $30k - 40k:
Millington:
14.4% (3)
Maryland:
6.1% (26,770)
Number of families with income $50k - 60k:
Millington:
5.5% (1)
Maryland:
5.9% (25,636)
Number of families with income $60k - 75k:
Millington:
11.2% (2)
State:
8.0% (35,163)
Number of families with income $100k - 125k:
Millington:
62.2% (11)
State:
11.4% (49,778)
Median per capita income in Millington in 2022:
Millington:
$31,486
State:
$40,756
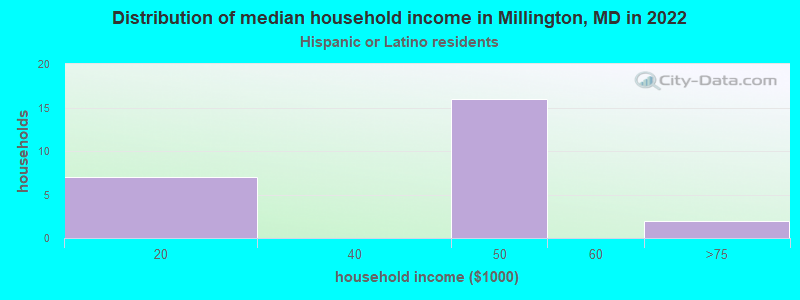
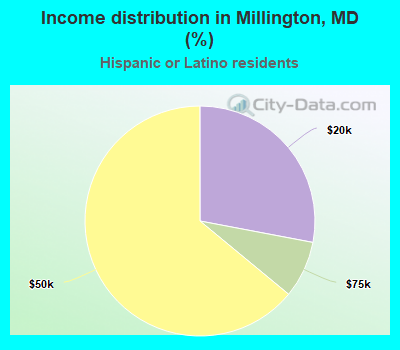
Income statistics for Hispanic or Latino residents
Median household income in Millington, MD in 2022:
Millington:
$43,806
State:
$82,138
Change in median household income between 2000 and 2022:
Millington, Maryland:
+133.6%
State:
+70.2%
Number of households with income < $10k:
Millington:
0.0% (0)
State:
3.7% (6,871)
Number of households with income $10k - 20k:
Millington:
28.0% (7)
State:
2.9% (5,465)
Number of households with income $20k - 30k:
Millington:
0.0% (0)
State:
5.9% (11,012)
Number of households with income $30k - 40k:
Millington:
0.0% (0)
State:
7.9% (14,668)
Number of households with income $40k - 50k:
Millington:
64.0% (16)
State:
7.6% (14,074)
Number of households with income $50k - 60k:
Millington:
0.0% (0)
State:
7.6% (14,166)
Number of households with income $60k - 75k:
Millington:
8.0% (2)
State:
9.9% (18,486)
Number of households with income $75k - 100k:
Millington:
0.0% (0)
Maryland:
16.1% (30,032)
Number of households with income $100k - 125k:
Millington:
0.0% (0)
State:
9.4% (17,432)
Number of households with income $125k - 150k:
Millington:
0.0% (0)
Maryland:
7.5% (13,963)
Number of households with income $150k - 200k:
Millington:
0.0% (0)
State:
10.1% (18,750)
Number of households with income > $200k:
Millington:
0.0% (0)
Maryland:
11.4% (21,133)
Aggregate household income in Millington in 2022: $1,089,518
Median per capita income in Millington in 2022:
Millington:
$10,819
Maryland:
$29,024
Change in median per capita income between 2000 and 2022:: -11.7%
Millington, Maryland:
-11.7%
State:
+79.2%
Income statistics for American Indian and Alaska Native residents
Aggregate household income in Millington in 2022: $207,850
Median per capita income in Millington in 2022:
Millington:
$8,119
State:
$35,089
Change in median per capita income between 2000 and 2022:: -80.2%
Millington, Maryland:
-80.2%
State:
+56.2%
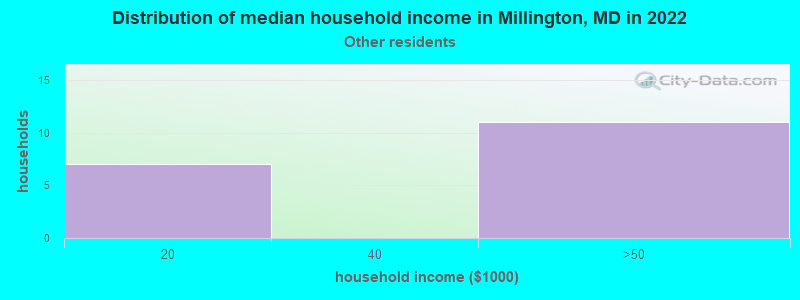
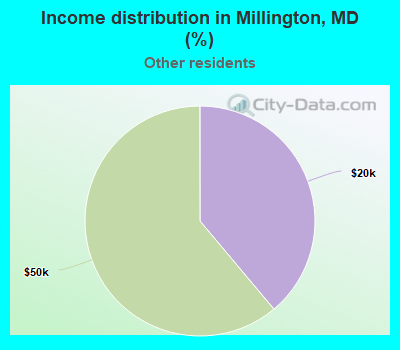
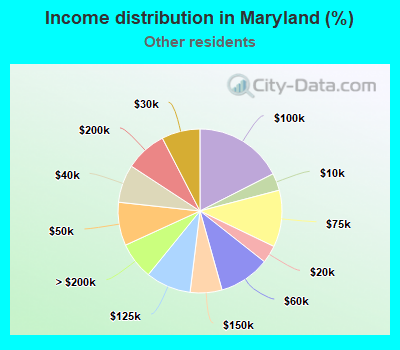
Income statistics for other residents
Number of households with income < $10k:
Millington:
0.0% (0)
State:
3.4% (3,746)
Number of households with income $10k - 20k:
Millington:
38.9% (7)
State:
3.5% (3,842)
Number of households with income $20k - 30k:
Millington:
0.0% (0)
State:
7.6% (8,343)
Number of households with income $30k - 40k:
Millington:
0.0% (0)
State:
7.5% (8,251)
Number of households with income $40k - 50k:
Millington:
61.1% (11)
State:
8.6% (9,414)
Number of households with income $50k - 60k:
Millington:
0.0% (0)
Maryland:
10.0% (11,048)
Number of households with income $60k - 75k:
Millington:
0.0% (0)
Maryland:
11.2% (12,339)
Number of households with income $75k - 100k:
Millington:
0.0% (0)
Maryland:
17.5% (19,277)
Number of households with income $100k - 125k:
Millington:
0.0% (0)
State:
8.9% (9,813)
Number of households with income $125k - 150k:
Millington:
0.0% (0)
State:
6.3% (6,907)
Number of households with income $150k - 200k:
Millington:
0.0% (0)
State:
8.2% (9,023)
Number of households with income > $200k:
Millington:
0.0% (0)
State:
7.3% (8,036)
Aggregate household income in Millington in 2022: $1,188,680
Median per capita income in Millington in 2022:
Millington:
$13,099
Maryland:
$24,415
Change in median per capita income between 2000 and 2022:
Millington, Maryland:
+38.5%
State:
+73.6%
Discuss Millington, Maryland (MD) on our hugely popular Maryland forum.