Middletown, DE (Delaware) Houses and Residents
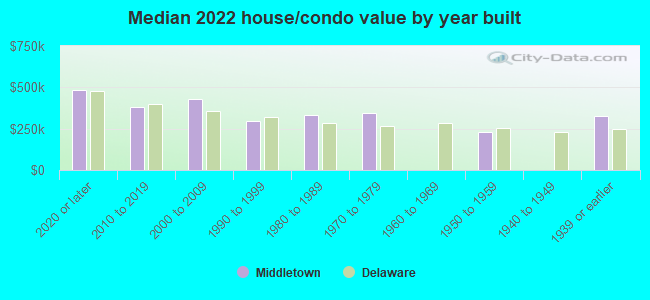
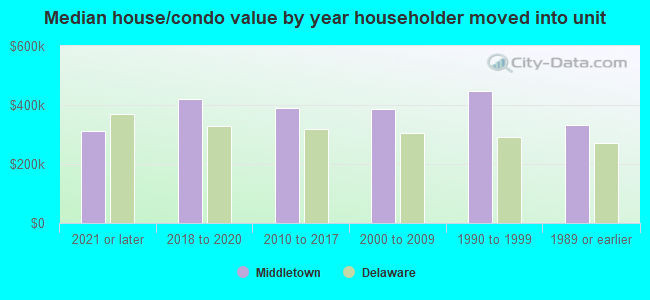
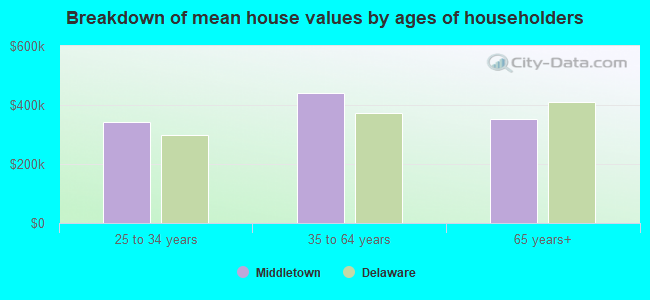
| Middletown: | $385,838 |
| Delaware: | $337,200 |
Total population: 19,910 (Urban population: 5,721 (all inside urban clusters), Rural population: 510 (all nonfarm))
Houses: 8,737 (8,548 occupied: 6,285 owner occupied, 2,294 renter occupied)
| % of renters here: | 27% |
| State: | 26% |
Housing density: 1,365 houses/condos per square mile
Median price asked for vacant for-sale houses and condos in 2022: $1,144,318.
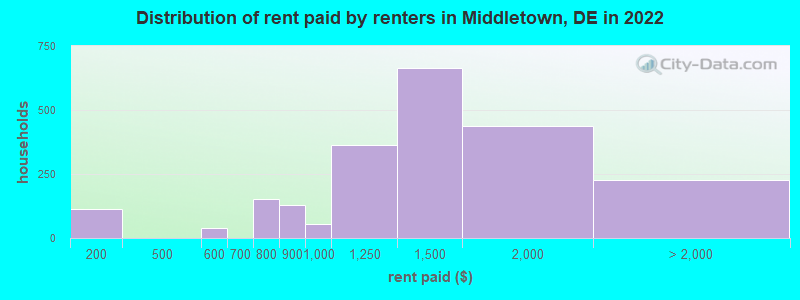
Median contract rent in 2022: $1,301 (lower quartile is $1,026, upper quartile is $1,511)
Median rent asked for vacant for-rent units in 2022: $3,421
Median gross rent in Middletown, DE in 2022: $1,431
Housing units in Middletown with a mortgage: 4,687 (339 second mortgage, 0 home equity loan, 225 both second mortgage and home equity loan)
Houses without a mortgage: 22
Median household income for houses/condos with a mortgage: $116,006
Median household income for apartments without a mortgage: $103,690
Median monthly housing costs: $1,592
Compare current foreclosures in Middletown, DE:
| Photo | Address | Area | Beds / Baths | Price | Details |
|---|---|---|---|---|---|

|
#1
Saint Augustine Rd
Middletown, DE 19709
|
1,125 sq. feet
|
2 baths 3 beds |
show details | |

|
#2
Rossini Ln
Middletown, DE 19709
|
- sq. feet
|
2 baths 3 beds |
show details | |

|
#3
W Harvest Ln
Middletown, DE 19709
|
- sq. feet
|
2 baths 3 beds |
show details | |

|
#4
W Sarazen Dr
Middletown, DE 19709
|
- sq. feet
|
2 baths 3 beds |
show details | |

|
#5
Bobolink Ct
Middletown, DE 19709
|
- sq. feet
|
2 baths 4 beds |
show details | |

|
#6
Middlesex Dr
Middletown, DE 19709
|
- sq. feet
|
3 baths 4 beds |
show details | |

|
#7
Lorewood Grove Rd
Middletown, DE 19709
|
- sq. feet
|
1 baths 3 beds |
show details | |

|
#8
Omeara Ct
Middletown, DE 19709
|
- sq. feet
|
2 baths 4 beds |
show details | |

|
#9
Chancellorsville Cir
Middletown, DE 19709
|
- sq. feet
|
2 baths 4 beds |
show details | |

|
#10
Gillespie Ave
Middletown, DE 19709
|
- sq. feet
|
2 baths 3 beds |
show details |
| Photo | Address | Area | Beds / Baths | Price | Details |
|---|---|---|---|---|---|

|
#11
Marian Dr
Middletown, DE 19709
|
- sq. feet
|
2 baths 2 beds |
show details | |

|
#12
Marldale Dr
Middletown, DE 19709
|
- sq. feet
|
2 baths 3 beds |
show details | |

|
#13
W Windmill Way
Middletown, DE 19709
|
- sq. feet
|
1 baths 3 beds |
show details | |

|
#14
Macleren Dr
Middletown, DE 19709
|
- sq. feet
|
1 baths 2 beds |
show details | |

|
#15
Tennyson Ct
Middletown, DE 19709
|
- sq. feet
|
2 baths 4 beds |
show details | |

|
#16
Flower Hall Dr
Middletown, DE 19709
|
- sq. feet
|
2 baths 4 beds |
show details | |

|
#17
Boxwood Ln
Middletown, DE 19709
|
- sq. feet
|
2 baths 3 beds |
show details | |

|
#18
Gloucester Blvd
Middletown, DE 19709
|
- sq. feet
|
4 baths 4 beds |
show details | |

|
#19
W Minglewood Dr
Middletown, DE 19709
|
- sq. feet
|
2 baths 4 beds |
show details | |

|
#20
Mallard Way
Middletown, DE 19709
|
- sq. feet
|
2 baths 4 beds |
show details |
| Photo | Address | Area | Beds / Baths | Price | Details |
|---|---|---|---|---|---|

|
#21
Lakeside Dr
Middletown, DE 19709
|
- sq. feet
|
2 baths 4 beds |
show details | |

|
#22
Old State Rd
Middletown, DE 19709
|
- sq. feet
|
2 baths 4 beds |
show details | |

|
#23
Vincent Cir
Middletown, DE 19709
|
- sq. feet
|
2 baths 3 beds |
show details | |

|
#24
Marian Dr
Middletown, DE 19709
|
- sq. feet
|
1 baths 3 beds |
show details | |

|
#25
Autumn Ct
Middletown, DE 19709
|
- sq. feet
|
2 baths 4 beds |
show details | |

|
#26
Academy Ln
Middletown, DE 19709
|
- sq. feet
|
2 baths 3 beds |
show details | |

|
#27
Dawn Dr
Middletown, DE 19709
|
- sq. feet
|
2 baths 4 beds |
show details | |

|
#28
Ponderosa Dr
Middletown, DE 19709
|
- sq. feet
|
1 baths 3 beds |
show details | |

|
#29
Palisade Cir
Middletown, DE 19709
|
- sq. feet
|
3 baths 3 beds |
show details | |

|
#30
Sweet Hollow Way
Middletown, DE 19709
|
- sq. feet
|
2 baths 4 beds |
show details |
| Photo | Address | Area | Beds / Baths | Price | Details |
|---|---|---|---|---|---|

|
#31
Toftrees Dr
Middletown, DE 19709
|
- sq. feet
|
- baths - beds |
show details | |

|
#32
Zachary Ln
Middletown, DE 19709
|
- sq. feet
|
- baths - beds |
show details | |

|
#33
Carrick Ct
Middletown, DE 19709
|
- sq. feet
|
- baths - beds |
show details | |

|
#34
Elizabeth St
Middletown, DE 19709
|
- sq. feet
|
- baths - beds |
show details | |

|
#35
Acasta Dr
Middletown, DE 19709
|
- sq. feet
|
- baths - beds |
show details | |

|
#36
Patriot Dr # A
Middletown, DE 19709
|
- sq. feet
|
- baths - beds |
show details | |

|
#37
Lissicasey Loop
Middletown, DE 19709
|
- sq. feet
|
- baths - beds |
show details | |

|
#38
Goodwick Dr
Middletown, DE 19709
|
- sq. feet
|
- baths - beds |
show details | |

|
#39
Proust Pl
Middletown, DE 19709
|
- sq. feet
|
- baths - beds |
show details | |

|
#40
S Ridge Ave
Middletown, DE 19709
|
- sq. feet
|
- baths - beds |
show details |
| Photo | Address | Area | Beds / Baths | Price | Details |
|---|---|---|---|---|---|

|
#41
Neverland Dr
Middletown, DE 19709
|
- sq. feet
|
- baths - beds |
show details | |

|
#42
Acasta Dr
Middletown, DE 19709
|
- sq. feet
|
- baths - beds |
show details | |

|
#43
Andrea Dr
Middletown, DE 19709
|
- sq. feet
|
- baths - beds |
show details | |

|
#44
Sugar Pine Dr
Middletown, DE 19709
|
- sq. feet
|
- baths - beds |
show details | |

|
#45
Boyds Corner Rd
Middletown, DE 19709
|
- sq. feet
|
- baths - beds |
show details | |

|
#46
Tiger Lily Dr
Middletown, DE 19709
|
- sq. feet
|
- baths - beds |
show details | |

|
#47
Silky Dogwood Ln
Middletown, DE 19709
|
- sq. feet
|
- baths - beds |
show details | |

|
#48
Sweet Birch Dr
Middletown, DE 19709
|
- sq. feet
|
- baths - beds |
show details | |

|
#49
Lissicasey Loop
Middletown, DE 19709
|
- sq. feet
|
- baths - beds |
show details | |

|
Check over 1 million property listings on Foreclosure.com!
|
browse all offers | |||

Latest news about housing in Middletown, DE collected exclusively by city-data.com from local newspapers, TV, and radio stations

 | Middletown Homes for Rent? (3 replies) |
| Estates at St. Anne's- LC Homes (0 replies) |
| Silver Maple Farm - Middletown (55+) (0 replies) |
| Things 2 do near KHov 4 Seasons Baymont Farms Middletown (8 replies) |
| Retirement from NYC to Middletown, DE (25 replies) |
| Looking to Relocate to Middletown, but cannot find apartments!!!! (2 replies) |

Median year apartment built: 2006
Household type by relationship:
Households: 23,776- Male householders: 3,344 (329 living alone), Female householders: 5,172 (1,767 living alone)
4,225 spouses (4,184 opposite-sex spouses), 500 unmarried partners, (481 opposite-sex unmarried partners), 8,345 children (8,049 natural, 86 adopted, 208 stepchildren), 278 grandchildren, 187 brothers or sisters, 725 parents, 0 foster children, 343 other relatives, 550 non-relatives
- In group quarters: 102
Size of family households: 1,974 2-persons, 1,711 3-persons, 1,968 4-persons, 210 5-persons, 52 6-persons, 267 7-or-more-persons.
Size of nonfamily households: 2,147 1-person, 367 2-persons, 14 3-persons.
4,035 married couples with children.
2,044 single-parent households (266 men, 1,778 women).
85.9% of residents of Middletown speak English at home.
5.8% of residents speak Spanish at home (67% speak English very well, 19% speak English well, 13% speak English not well, 1% don't speak English at all).
5.4% of residents speak other Indo-European language at home (66% speak English very well, 26% speak English well, 8% speak English not well).
1.2% of residents speak Asian or Pacific Island language at home (84% speak English very well, 16% speak English well).
2.5% of residents speak other language at home (100% speak English very well).
Foreign born population: 3,033 (12.8%)
(81.4% of them are naturalized citizens)
| Here: | 7.4 |
| State: | 6.9 |
| Here: | 4.2 |
| State: | 4.4 |
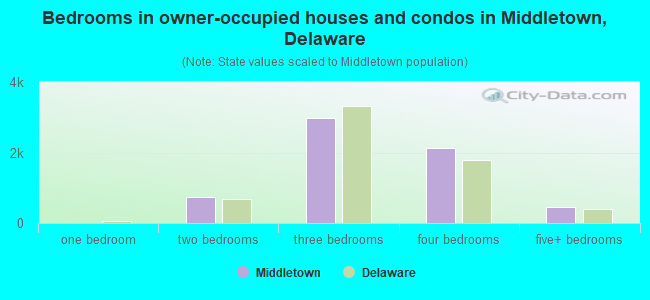
- Bedrooms in owner-occupied houses and condos in Middletown, Delaware
- 0no bedroom
- 01 bedroom
- 7282 bedrooms
- 2,9893 bedrooms
- 2,1234 bedrooms
- 4465+ bedrooms
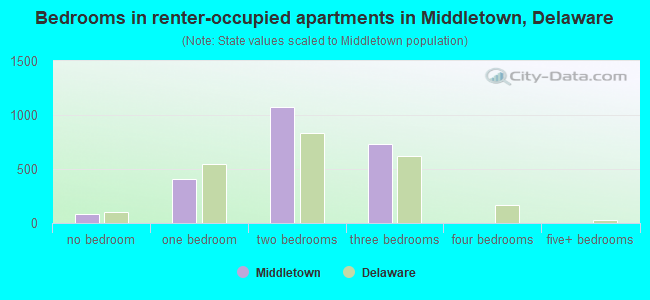
- Bedrooms in renter-occupied apartments in Middletown, Delaware
- 81no bedroom
- 4041 bedroom
- 1,0782 bedrooms
- 7303 bedrooms
- 14 bedrooms
- 05+ bedrooms
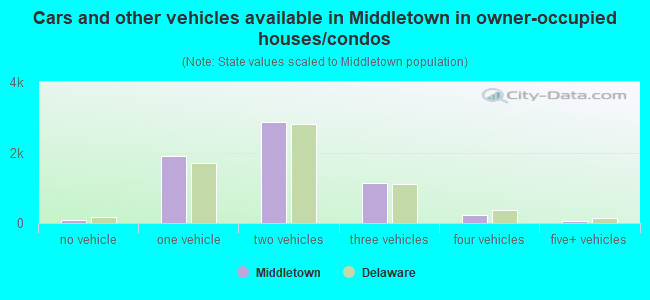
- Cars and other vehicles available in Middletown in owner-occupied houses/condos
- 88no vehicle
- 1,9061 vehicle
- 2,8702 vehicles
- 1,1363 vehicles
- 2314 vehicles
- 555+ vehicles
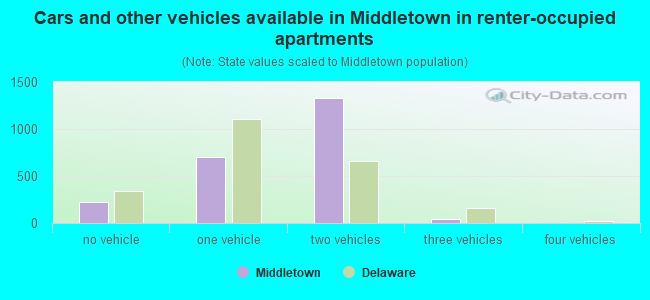
- Cars and other vehicles available in Middletown in renter-occupied apartments
- 220no vehicle
- 7061 vehicle
- 1,3262 vehicles
- 423 vehicles
- 04 vehicles
- 05+ vehicles
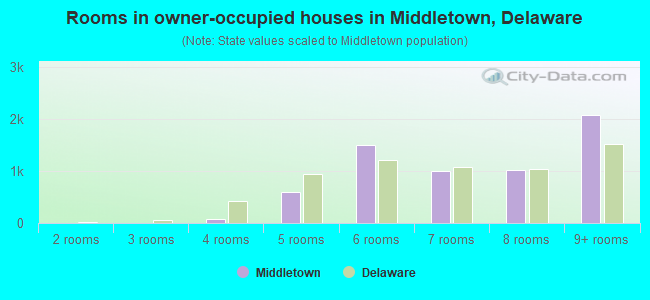
- Rooms in owner-occupied houses in Middletown, Delaware
- 01 room
- 02 rooms
- 03 rooms
- 804 rooms
- 5885 rooms
- 1,5086 rooms
- 1,0097 rooms
- 1,0188 rooms
- 2,0829+ rooms
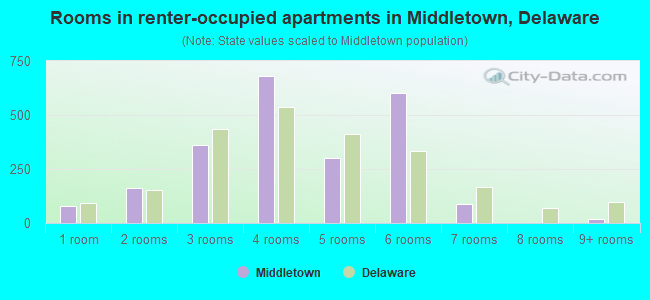
- Rooms in renter-occupied apartments in Middletown, Delaware
- 811 room
- 1642 rooms
- 3623 rooms
- 6794 rooms
- 3015 rooms
- 6006 rooms
- 887 rooms
- 08 rooms
- 209+ rooms
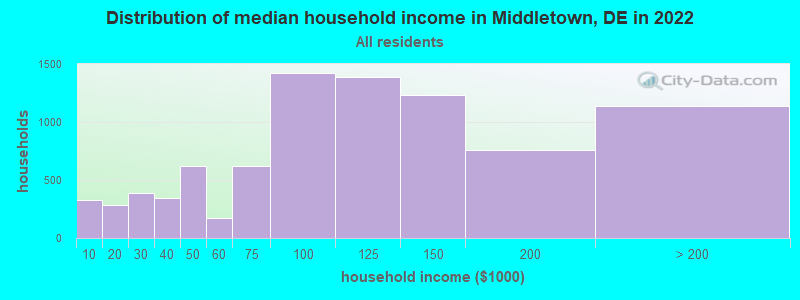
Middletown, DE household income distribution

- 326Less than $10,000
- 285$10,000 to $19,999
- 388$20,000 to $29,999
- 344$30,000 to $39,999
- 619$40,000 to $49,999
- 174$50,000 to $59,999
- 624$60,000 to $74,999
- 1,419$75,000 to $99,999
- 1,389$100,000 to $124,999
- 1,232$125,000 to $149,999
- 755$150,000 to $199,999
- 1,134$200,000 or more
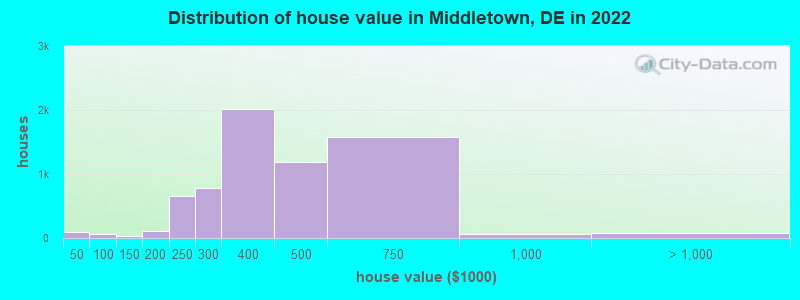
Home value of owner - occupied houses in 2022 in Middletown, DE
-
- 57$10,000 to $14,999
- 33$15,000 to $19,999
- 10$50,000 to $59,999
- 49$70,000 to $79,999
- 32$100,000 to $124,999
- 18$150,000 to $174,999
- 93$175,000 to $199,999
- 653$200,000 to $249,999
- 786$250,000 to $299,999
- 2,018$300,000 to $399,999
- 1,182$400,000 to $499,999
- 1,578$500,000 to $749,999
- 67$750,000 to $999,999
- 77$2,000,000 or more
Rent paid by renters in 2022 in Middletown, DE
-
- 111$100 to $149
- 37$500 to $549
- 150$750 to $799
- 128$800 to $899
- 53$900 to $999
- 362$1,000 to $1,249
- 664$1,250 to $1,499
- 437$1,500 to $1,999
- 60$2,000 to $2,499
- 165No cash rent
Percentage of workers working in this county: 74.0%
Number of people working at home: 1,747 (15.3% of all workers)

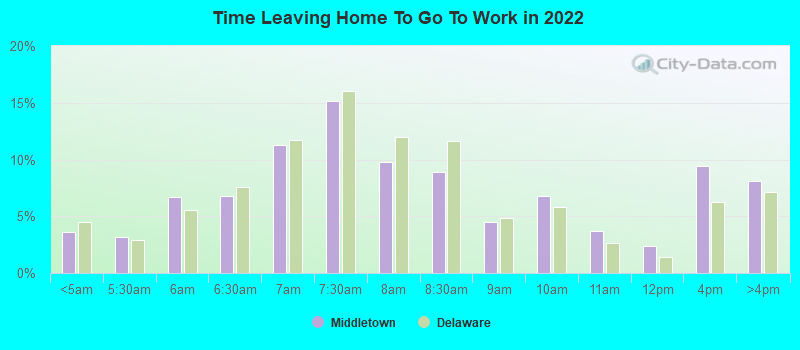
Travel time to work (commute)
- Less than 5 minutes: 387
- 5 to 9 minutes: 597
- 10 to 14 minutes: 978
- 15 to 19 minutes: 777
- 20 to 24 minutes: 997
- 25 to 29 minutes: 1,406
- 30 to 34 minutes: 1,710
- 35 to 39 minutes: 463
- 40 to 44 minutes: 730
- 45 to 59 minutes: 719
- 60 to 89 minutes: 590
- 90 or more minutes: 144
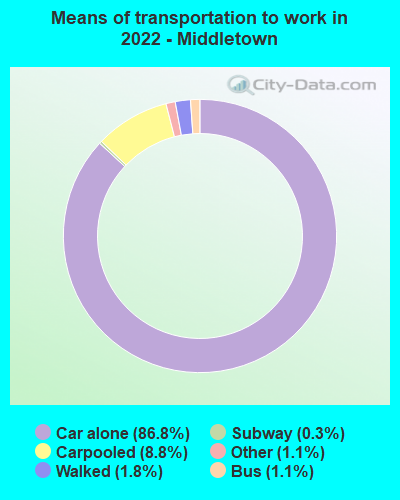
Means of transportation to work:
- Drove a car alone: 9,402 (74.4%)
- Carpooled: 897 (7.1%)
- Bus: 111 (0.9%)
- Long-distance train or commuter rail: 23 (0.2%)
- Taxi: 112 (0.9%)
- Bicycle: 13 (0.1%)
- Walked: 199 (1.6%)
- Worked at home: 1,747 (13.8%)
- Unemployment by race in 2022
- Unemployment rate for White non-Hispanic residents
- 2.3%Males
- 3.2%Females
- Unemployment rate for Black residents
- 7.8%Males
- 6.9%Females
- Unemployment rate for Asian residents
- 9.7%Males
- 7.6%Females
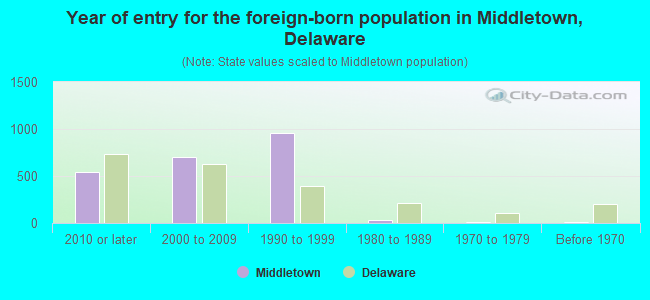
- Year of entry for the foreign-born population in Middletown, Delaware
- 5472010 or later
- 6992000 to 2009
- 9571990 to 1999
- 371980 to 1989
- 111970 to 1979
- 14Before 1970
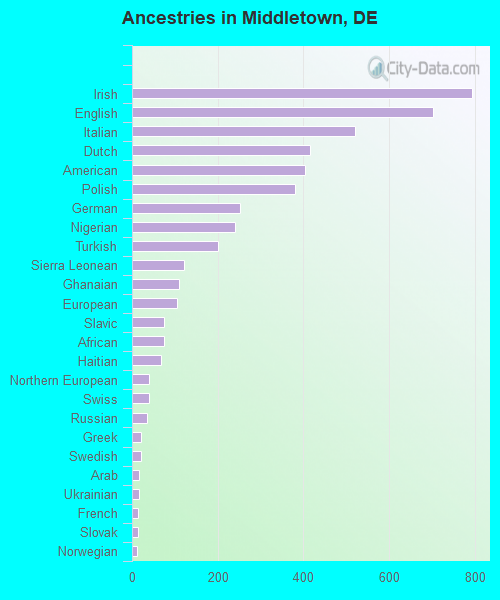
First ancestries reported:
- Irish: 794 (7.8%)
- English: 704 (6.9%)
- Italian: 521 (5.1%)
- Dutch: 415 (4.1%)
- American: 403 (4.0%)
- Polish: 381 (3.7%)
- German: 252 (2.5%)
- Nigerian: 240 (2.4%)
- Turkish: 202 (2.0%)
- Sierra Leonean: 122 (1.2%)
- Ghanaian: 110 (1.1%)
- European: 106 (1.0%)
- Slavic: 74 (0.7%)
- African: 74 (0.7%)
- Haitian: 68 (0.7%)
- Northern European: 39 (0.4%)
- Swiss: 39 (0.4%)
- Russian: 36 (0.4%)
- Greek: 21 (0.2%)
- Swedish: 20 (0.2%)
- Arab: 16 (0.2%)
- Ukrainian: 16 (0.2%)
- French: 14 (0.1%)
- Slovak: 13 (0.1%)
- Norwegian: 11 (0.1%)
- French Canadian: 10 (0.10%)
- Pennsylvania German: 10 (0.10%)
- Lithuanian: 8 (0.08%)
Most common places of birth for foreign-born residents (%):
| Middletown: | 13.0% (393) |
| Delaware: | 3.1% (2,996) |
| Middletown: | 11.7% (352) |
| Delaware: | 11.6% (11,288) |
| Middletown: | 10.4% (312) |
| Delaware: | 1.1% (1,084) |
| Middletown: | 10.0% (300) |
| Delaware: | 1.6% (1,518) |
| Middletown: | 9.9% (297) |
| Delaware: | 15.3% (14,887) |
| Middletown: | 6.7% (203) |
| Delaware: | 1.1% (1,064) |
| Middletown: | 5.5% (166) |
| Delaware: | 1.6% (1,557) |
| Middletown: | 3.1% (92) |
| Delaware: | 3.0% (2,919) |
| Middletown: | 2.9% (87) |
| Delaware: | 0.2% (174) |
| Middletown: | 2.2% (67) |
| Delaware: | 3.8% (3,686) |
| Middletown: | 2.0% (60) |
| Delaware: | 0.2% (162) |
| Middletown: | 2.0% (59) |
| Delaware: | 1.4% (1,373) |
| Middletown: | 1.9% (58) |
| Delaware: | 0.7% (713) |
| Middletown: | 1.9% (56) |
| Delaware: | 0.5% (445) |
| Middletown: | 1.7% (50) |
| Delaware: | 3.2% (3,065) |
| Middletown: | 1.7% (50) |
| Delaware: | 0.4% (399) |
Place of birth for U.S.-born residents:
- This state: 8,388
- Other state: 12,073
- Northeast: 8,205
- Midwest: 738
- South: 2,800
- West: 319
87.9% of Middletown residents lived in the same house 1 years ago.
Out of people who lived in different houses, 22.3% lived in this county.
Out of people who lived in different counties, 10.7% lived in Delaware.
| Middletown: | 87.9% |
| State average: | 89.2% |
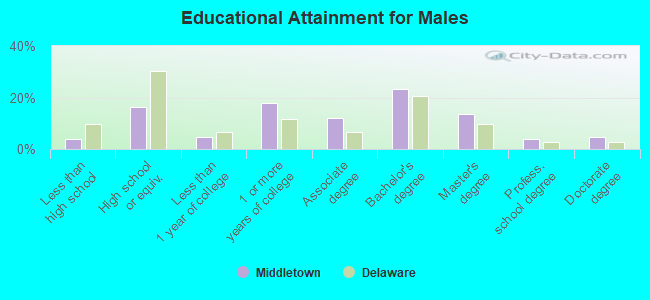
Education attainment for males 25 years and older:
- No schooling: 31
- Nursery to 4th grade: 0
- 5th and 6th grade: 66
- 7th and 8th grade: 0
- 9th grade: 8
- 10th grade: 16
- 11th grade: 41
- 12th grade, no diploma: 101
- High school graduate (or equivalency): 1,050
- Less than 1 year of college: 306
- Some college more than 1 year, no degree: 1,159
- Associate degree: 772
- Bachelor's degree: 1,516
- Master's degree: 870
- Professional school degree: 242
- Doctorate degree: 302
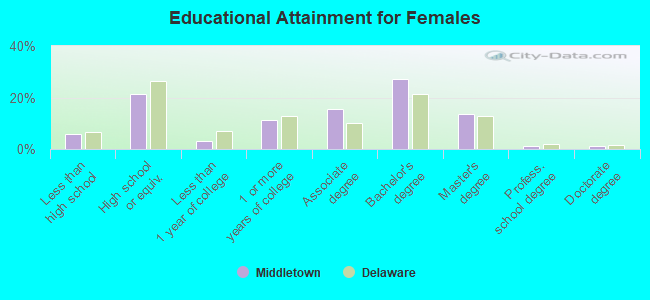
Education attainment for females 25 years and older:
- No schooling: 208
- Nursery to 4th grade: 31
- 5th and 6th grade: 61
- 7th and 8th grade: 8
- 9th grade: 0
- 10th grade: 0
- 11th grade: 172
- 12th grade, no diploma: 43
- High school graduate (or equivalency): 1,901
- Less than 1 year of college: 279
- Some college more than 1 year, no degree: 1,005
- Associate degree: 1,386
- Bachelor's degree: 2,415
- Master's degree: 1,206
- Professional school degree: 95
- Doctorate degree: 118


Housing units in structures:
- One, detached: 4,094
- One, attached: 2,993
- Two: 50
- 3 or 4: 331
- 5 to 9: 495
- 10 to 19: 431
- 20 to 49: 125
- 50 or more: 192
- Mobile homes: 24
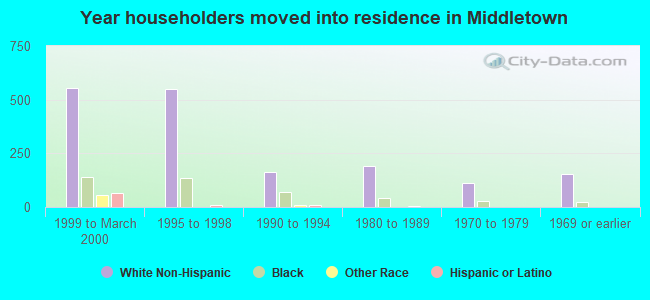
House/condo owner moved in on average 10 years ago
Renter moved in on average 6 years ago
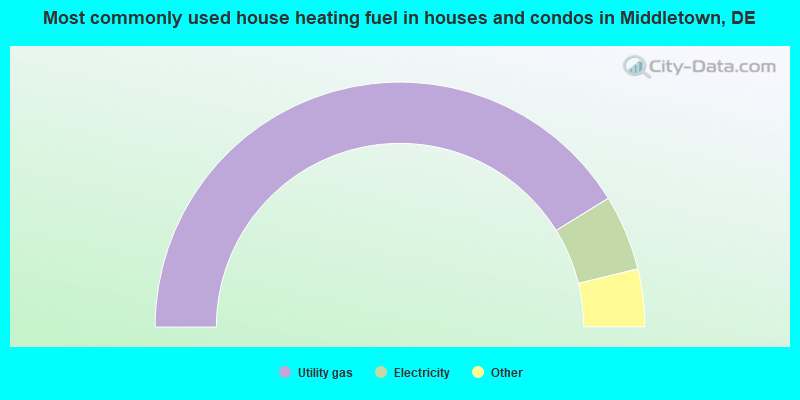
- 82.3%Utility gas
- 10.0%Electricity
- 3.9%Bottled, tank, or LP gas
- 3.1%Fuel oil, kerosene, etc.
- 0.4%No fuel used
- 0.2%Wood
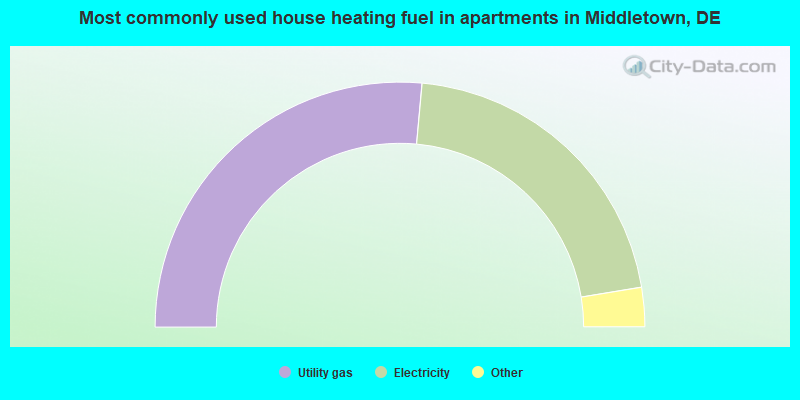
- 52.9%Utility gas
- 41.9%Electricity
- 3.6%Fuel oil, kerosene, etc.
- 1.6%Bottled, tank, or LP gas
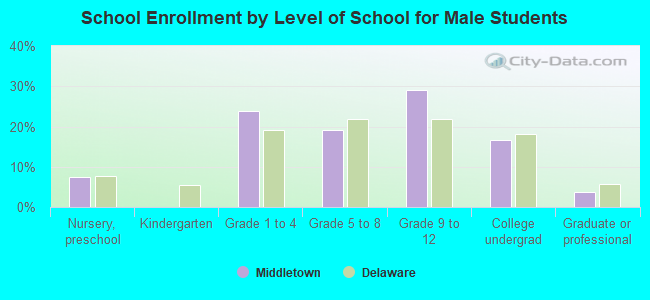
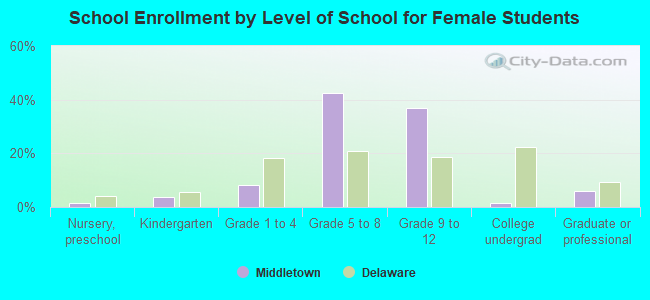
Private vs. public school enrollment:
| Here: | 4.1% |
| Delaware: | 11.5% |
| Here: | 4.7% |
| Delaware: | 12.1% |
| Here: | 11.5% |
| Delaware: | 19.2% |