Races in Middletown, Delaware (DE) Detailed Stats
Data:
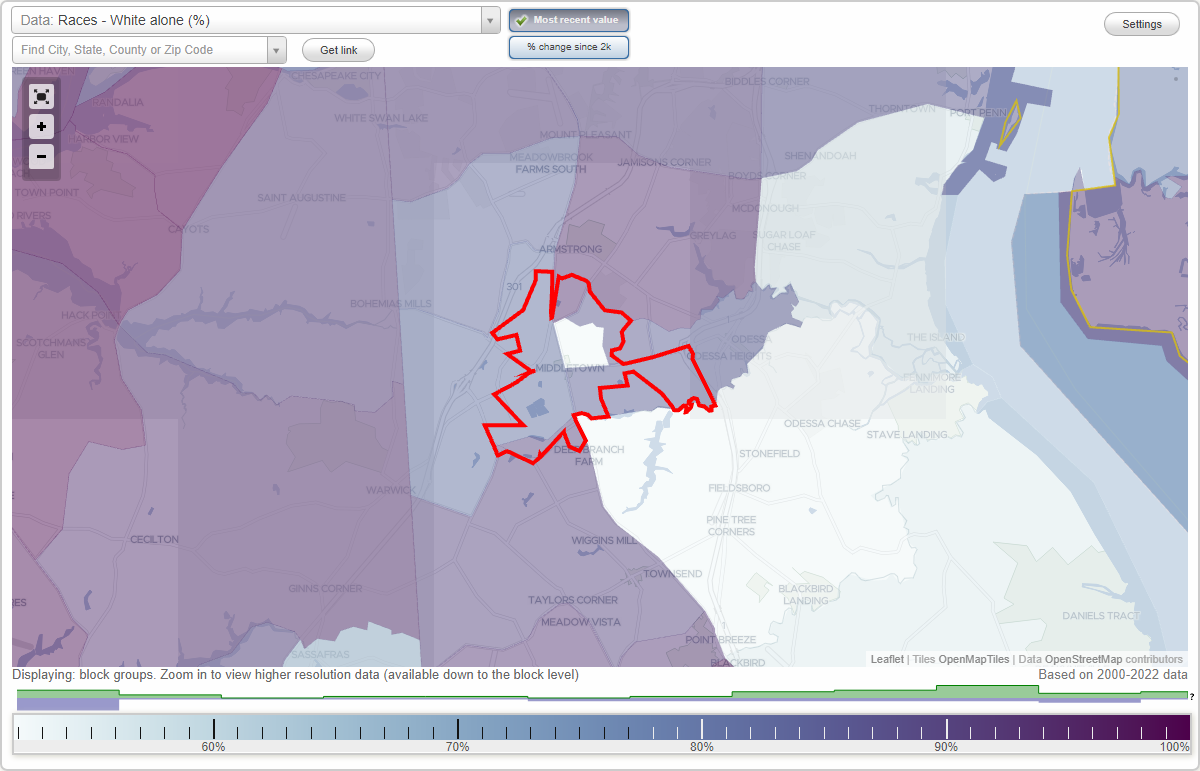
Races - White alone (%)
Races - White alone (% change since 2000)
Races - Black alone (%)
Races - Black alone (% change since 2000)
Races - American Indian alone (%)
Races - American Indian alone (% change since 2000)
Races - Asian alone (%)
Races - Asian alone (% change since 2000)
Races - Hispanic (%)
Races - Hispanic (% change since 2000)
Races - Native Hawaiian and Other Pacific Islander alone (%)
Races - Native Hawaiian and Other Pacific Islander alone (% change since 2000)
Races - Two or more races(%)
Races - Two or more races(% change since 2000)
Races - Other race alone (%)
Races - Other race alone (% change since 2000)
Racial diversity
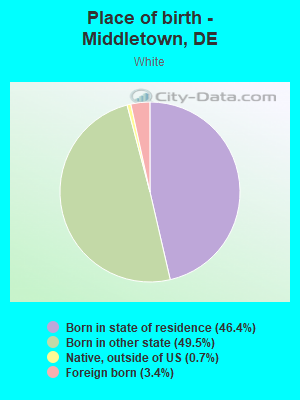
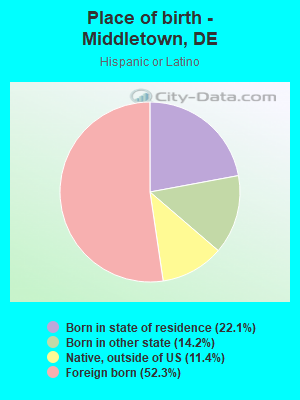
Place of birth - Born in state of residence (%)
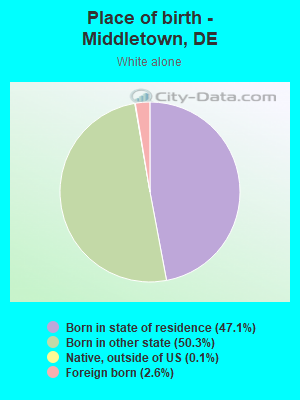
Place of birth - Born in state of residence (%) - White
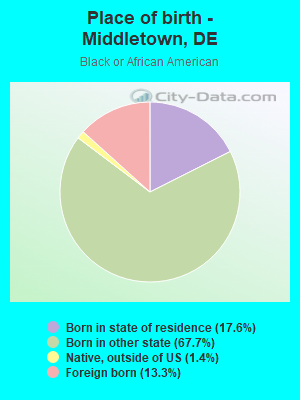
Place of birth - Born in state of residence (%) - Black or African American
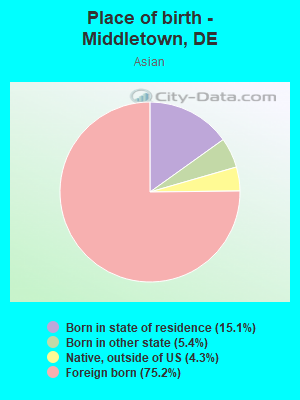
Place of birth - Born in state of residence (%) - Asian
Place of birth - Born in state of residence (%) - Hispanic or Latino
Place of birth - Born in state of residence (%) - American Indian and Alaska Native
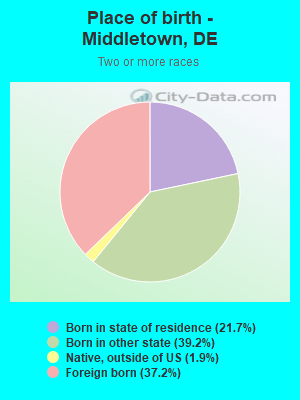
Place of birth - Born in state of residence (%) - Multirace
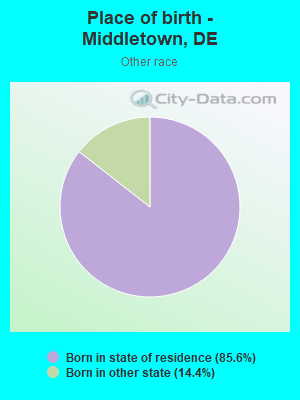
Place of birth - Born in state of residence (%) - Other Race
Place of birth - Born in other state (%)
Place of birth - Born in other state (%) - White
Place of birth - Born in other state (%) - Black or African American
Place of birth - Born in other state (%) - Asian
Place of birth - Born in other state (%) - Hispanic or Latino
Place of birth - Born in other state (%) - American Indian and Alaska Native
Place of birth - Born in other state (%) - Multirace
Place of birth - Born in other state (%) - Other Race
Place of birth - Native, outside of US (%)
Place of birth - Native, outside of US (%) - White
Place of birth - Native, outside of US (%) - Black or African American
Place of birth - Native, outside of US (%) - Asian
Place of birth - Native, outside of US (%) - Hispanic or Latino
Place of birth - Native, outside of US (%) - American Indian and Alaska Native
Place of birth - Native, outside of US (%) - Multirace
Place of birth - Native, outside of US (%) - Other Race
Place of birth - Foreign born (%)
Place of birth - Foreign born (%) - White
Place of birth - Foreign born (%) - Black or African American
Place of birth - Foreign born (%) - Asian
Place of birth - Foreign born (%) - Hispanic or Latino
Place of birth - Foreign born (%) - American Indian and Alaska Native
Place of birth - Foreign born (%) - Multirace
Place of birth - Foreign born (%) - Other Race
Residents speaking English at home (%)
Residents speaking English at home - Born in the United States (%)
Residents speaking English at home - Native, born elsewhere (%)
Residents speaking English at home - Foreign born (%)
Residents speaking Spanish at home (%)
Residents speaking Spanish at home - Born in the United States (%)
Residents speaking Spanish at home - Native, born elsewhere (%)
Residents speaking Spanish at home - Foreign born (%)
Residents speaking other language at home (%)
Residents speaking other language at home - Born in the United States (%)
Residents speaking other language at home - Native, born elsewhere (%)
Residents speaking other language at home - Foreign born (%)
Marital status - Never married (%)
Marital status - Now married (%)
Marital status - Separated (%)
Marital status - Widowed (%)
Marital status - Divorced (%)
Ancestries Reported - Arab (%)
Ancestries Reported - Czech (%)
Ancestries Reported - Danish (%)
Ancestries Reported - Dutch (%)
Ancestries Reported - English (%)
Ancestries Reported - French (%)
Ancestries Reported - French Canadian (%)
Ancestries Reported - German (%)
Ancestries Reported - Greek (%)
Ancestries Reported - Hungarian (%)
Ancestries Reported - Irish (%)
Ancestries Reported - Italian (%)
Ancestries Reported - Lithuanian (%)
Ancestries Reported - Norwegian (%)
Ancestries Reported - Polish (%)
Ancestries Reported - Portuguese (%)
Ancestries Reported - Russian (%)
Ancestries Reported - Scotch-Irish (%)
Ancestries Reported - Scottish (%)
Ancestries Reported - Slovak (%)
Ancestries Reported - Subsaharan African (%)
Ancestries Reported - Swedish (%)
Ancestries Reported - Swiss (%)
Ancestries Reported - Ukrainian (%)
Ancestries Reported - United States (%)
Ancestries Reported - Welsh (%)
Ancestries Reported - West Indian (%)
Ancestries Reported - Other (%)
Geographical mobility - Same house 1 year ago (%)
Geographical mobility - Same house 1 year ago (%) - White
Geographical mobility - Same house 1 year ago (%) - Black or African American
Geographical mobility - Same house 1 year ago (%) - Asian
Geographical mobility - Same house 1 year ago (%) - Hispanic or Latino
Geographical mobility - Same house 1 year ago (%) - American Indian and Alaska Native
Geographical mobility - Same house 1 year ago (%) - Multirace
Geographical mobility - Same house 1 year ago (%) - Other Race
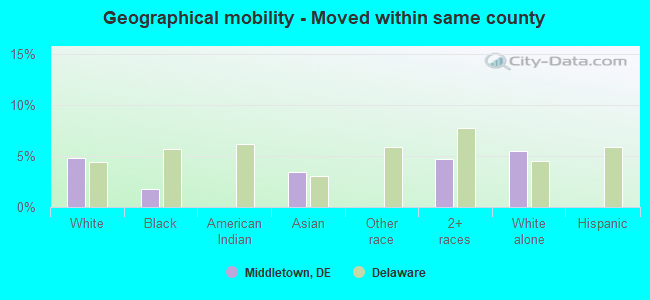
Geographical mobility - Moved within same county (%)
Geographical mobility - Moved within same county (%) - White
Geographical mobility - Moved within same county (%) - Black or African American
Geographical mobility - Moved within same county (%) - Asian
Geographical mobility - Moved within same county (%) - Hispanic or Latino
Geographical mobility - Moved within same county (%) - American Indian and Alaska Native
Geographical mobility - Moved within same county (%) - Multirace
Geographical mobility - Moved within same county (%) - Other Race
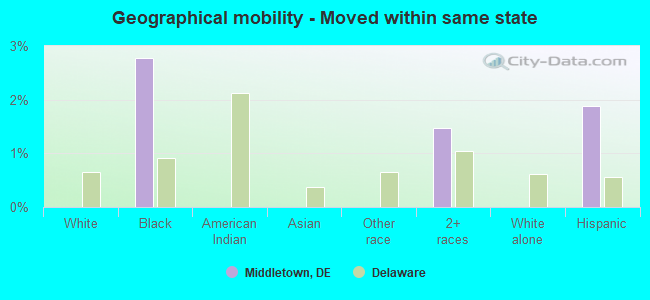
Geographical mobility - Moved from different county within same state (%)
Geographical mobility - Moved from different county within same state (%) - White
Geographical mobility - Moved from different county within same state (%) - Black or African American
Geographical mobility - Moved from different county within same state (%) - Asian
Geographical mobility - Moved from different county within same state (%) - Hispanic or Latino
Geographical mobility - Moved from different county within same state (%) - American Indian and Alaska Native
Geographical mobility - Moved from different county within same state (%) - Multirace
Geographical mobility - Moved from different county within same state (%) - Other Race
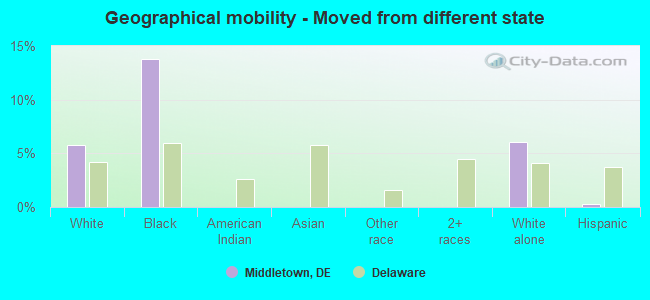
Geographical mobility - Moved from different state (%)
Geographical mobility - Moved from different state (%) - White
Geographical mobility - Moved from different state (%) - Black or African American
Geographical mobility - Moved from different state (%) - Asian
Geographical mobility - Moved from different state (%) - Hispanic or Latino
Geographical mobility - Moved from different state (%) - American Indian and Alaska Native
Geographical mobility - Moved from different state (%) - Multirace
Geographical mobility - Moved from different state (%) - Other Race
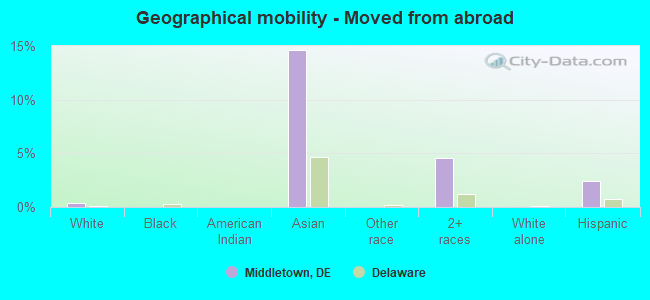
Geographical mobility - Moved from abroad (%)
Geographical mobility - Moved from abroad (%) - White
Geographical mobility - Moved from abroad (%) - Black or African American
Geographical mobility - Moved from abroad (%) - Asian
Geographical mobility - Moved from abroad (%) - Hispanic or Latino
Geographical mobility - Moved from abroad (%) - American Indian and Alaska Native
Geographical mobility - Moved from abroad (%) - Multirace
Geographical mobility - Moved from abroad (%) - Other Race
Place of birth for the foreign-born population - Ireland (%)
Place of birth for the foreign-born population - Denmark (%)
Place of birth for the foreign-born population - Norway (%)
Place of birth for the foreign-born population - Sweden (%)
Place of birth for the foreign-born population - United Kingdom (%)
Place of birth for the foreign-born population - England (%)
Place of birth for the foreign-born population - Scotland (%)
Place of birth for the foreign-born population - Other Northern Europe (%)
Place of birth for the foreign-born population - Austria (%)
Place of birth for the foreign-born population - Belgium (%)
Place of birth for the foreign-born population - France (%)
Place of birth for the foreign-born population - Germany (%)
Place of birth for the foreign-born population - Netherlands (%)
Place of birth for the foreign-born population - Switzerland (%)
Place of birth for the foreign-born population - Other Western Europe (%)
Place of birth for the foreign-born population - Greece (%)
Place of birth for the foreign-born population - Italy (%)
Place of birth for the foreign-born population - Portugal (%)
Place of birth for the foreign-born population - Spain (%)
Place of birth for the foreign-born population - Other Southern Europe (%)
Place of birth for the foreign-born population - Albania (%)
Place of birth for the foreign-born population - Belarus (%)
Place of birth for the foreign-born population - Bosnia and Herzegovina (%)
Place of birth for the foreign-born population - Bulgaria (%)
Place of birth for the foreign-born population - Croatia (%)
Place of birth for the foreign-born population - Czechoslovakia (%)
Place of birth for the foreign-born population - Hungary (%)
Place of birth for the foreign-born population - Latvia (%)
Place of birth for the foreign-born population - Lithuania (%)
Place of birth for the foreign-born population - North Macedonia (Macedonia) (%)
Place of birth for the foreign-born population - Moldova (%)
Place of birth for the foreign-born population - Poland (%)
Place of birth for the foreign-born population - Romania (%)
Place of birth for the foreign-born population - Russia (%)
Place of birth for the foreign-born population - Serbia (%)
Place of birth for the foreign-born population - Ukraine (%)
Place of birth for the foreign-born population - Other Eastern Europe (%)
Place of birth for the foreign-born population - China (%)
Place of birth for the foreign-born population - Hong Kong (%)
Place of birth for the foreign-born population - Taiwan (%)
Place of birth for the foreign-born population - Japan (%)
Place of birth for the foreign-born population - Korea (%)
Place of birth for the foreign-born population - Other Eastern Asia (%)
Place of birth for the foreign-born population - Afghanistan (%)
Place of birth for the foreign-born population - Bangladesh (%)
Place of birth for the foreign-born population - India (%)
Place of birth for the foreign-born population - Iran (%)
Place of birth for the foreign-born population - Kazakhstan (%)
Place of birth for the foreign-born population - Nepal (%)
Place of birth for the foreign-born population - Pakistan (%)
Place of birth for the foreign-born population - Sri Lanka (%)
Place of birth for the foreign-born population - Uzbekistan (%)
Place of birth for the foreign-born population - Other South Central Asia (%)
Place of birth for the foreign-born population - Burma (%)
Place of birth for the foreign-born population - Cambodia (%)
Place of birth for the foreign-born population - Indonesia (%)
Place of birth for the foreign-born population - Laos (%)
Place of birth for the foreign-born population - Malaysia (%)
Place of birth for the foreign-born population - Philippines (%)
Place of birth for the foreign-born population - Singapore (%)
Place of birth for the foreign-born population - Thailand (%)
Place of birth for the foreign-born population - Vietnam (%)
Place of birth for the foreign-born population - Other South Eastern Asia (%)
Place of birth for the foreign-born population - Armenia (%)
Place of birth for the foreign-born population - Iraq (%)
Place of birth for the foreign-born population - Israel (%)
Place of birth for the foreign-born population - Jordan (%)
Place of birth for the foreign-born population - Kuwait (%)
Place of birth for the foreign-born population - Lebanon (%)
Place of birth for the foreign-born population - Saudi Arabia (%)
Place of birth for the foreign-born population - Syria (%)
Place of birth for the foreign-born population - Turkey (%)
Place of birth for the foreign-born population - Yemen (%)
Place of birth for the foreign-born population - Other Western Asia (%)
Place of birth for the foreign-born population - Eritrea (%)
Place of birth for the foreign-born population - Ethiopia (%)
Place of birth for the foreign-born population - Kenya (%)
Place of birth for the foreign-born population - Somalia (%)
Place of birth for the foreign-born population - Uganda (%)
Place of birth for the foreign-born population - Zimbabwe (%)
Place of birth for the foreign-born population - Other Eastern Africa (%)
Place of birth for the foreign-born population - Cameroon (%)
Place of birth for the foreign-born population - Congo (%)
Place of birth for the foreign-born population - Democratic Republic of Congo (Zaire) (%)
Place of birth for the foreign-born population - Other Middle Africa (%)
Place of birth for the foreign-born population - Egypt (%)
Place of birth for the foreign-born population - Morocco (%)
Place of birth for the foreign-born population - Sudan (%)
Place of birth for the foreign-born population - Other Northern Africa (%)
Place of birth for the foreign-born population - South Africa (%)
Place of birth for the foreign-born population - Other Southern Africa (%)
Place of birth for the foreign-born population - Cabo Verde (%)
Place of birth for the foreign-born population - Ghana (%)
Place of birth for the foreign-born population - Liberia (%)
Place of birth for the foreign-born population - Nigeria (%)
Place of birth for the foreign-born population - Senegal (%)
Place of birth for the foreign-born population - Sierra Leone (%)
Place of birth for the foreign-born population - Other Western Africa (%)
Place of birth for the foreign-born population - Australia (%)
Place of birth for the foreign-born population - New Zealand (%)
Place of birth for the foreign-born population - Fiji (%)
Place of birth for the foreign-born population - Micronesia (%)
Place of birth for the foreign-born population - Bahamas (%)
Place of birth for the foreign-born population - Barbados (%)
Place of birth for the foreign-born population - Cuba (%)
Place of birth for the foreign-born population - Dominica (%)
Place of birth for the foreign-born population - Dominican Republic (%)
Place of birth for the foreign-born population - Grenada (%)
Place of birth for the foreign-born population - Haiti (%)
Place of birth for the foreign-born population - Jamaica (%)
Place of birth for the foreign-born population - St. Vincent and the Grenadines (%)
Place of birth for the foreign-born population - Trinidad and Tobago (%)
Place of birth for the foreign-born population - West Indies (%)
Place of birth for the foreign-born population - Other Caribbean (%)
Place of birth for the foreign-born population - Belize (%)
Place of birth for the foreign-born population - Costa Rica (%)
Place of birth for the foreign-born population - El Salvador (%)
Place of birth for the foreign-born population - Guatemala (%)
Place of birth for the foreign-born population - Honduras (%)
Place of birth for the foreign-born population - Mexico (%)
Place of birth for the foreign-born population - Nicaragua (%)
Place of birth for the foreign-born population - Panama (%)
Place of birth for the foreign-born population - Other Central America (%)
Place of birth for the foreign-born population - Argentina (%)
Place of birth for the foreign-born population - Bolivia (%)
Place of birth for the foreign-born population - Brazil (%)
Place of birth for the foreign-born population - Chile (%)
Place of birth for the foreign-born population - Colombia (%)
Place of birth for the foreign-born population - Ecuador (%)
Place of birth for the foreign-born population - Guyana (%)
Place of birth for the foreign-born population - Peru (%)
Place of birth for the foreign-born population - Uruguay (%)
Place of birth for the foreign-born population - Venezuela (%)
Place of birth for the foreign-born population - Other South America (%)
Place of birth for the foreign-born population - Canada (%)
Place of birth for the foreign-born population - Other Northern America (%)
Place of birth for the foreign-born population - Other (%)
Latest news about races in Middletown, DE collected exclusively by city-data.com from local newspapers, TV, and radio stations
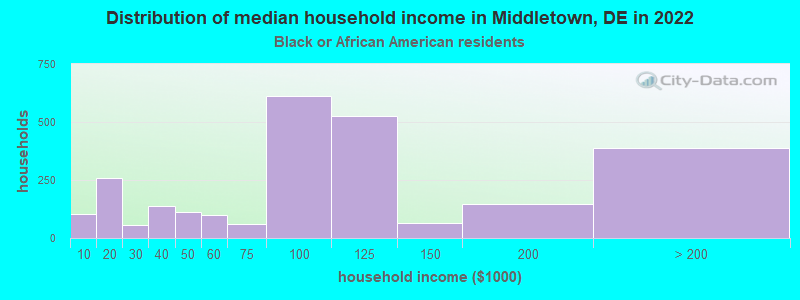
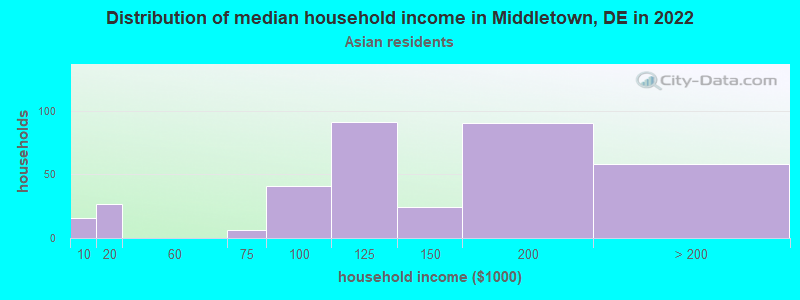
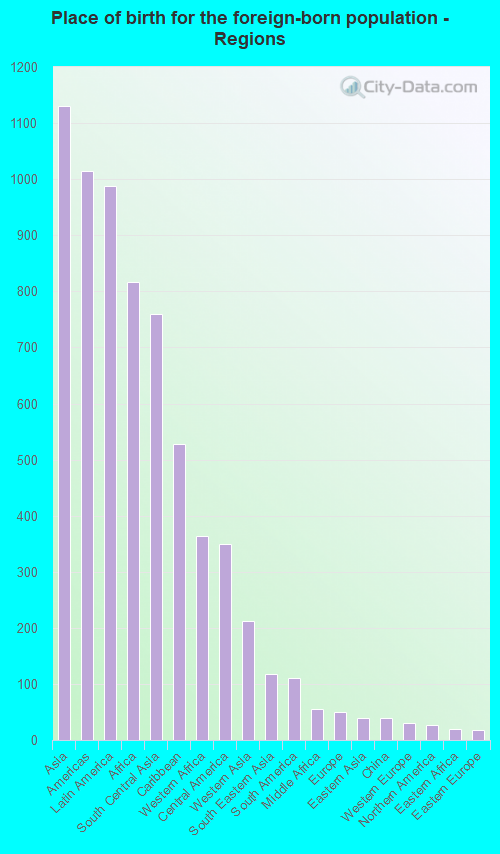
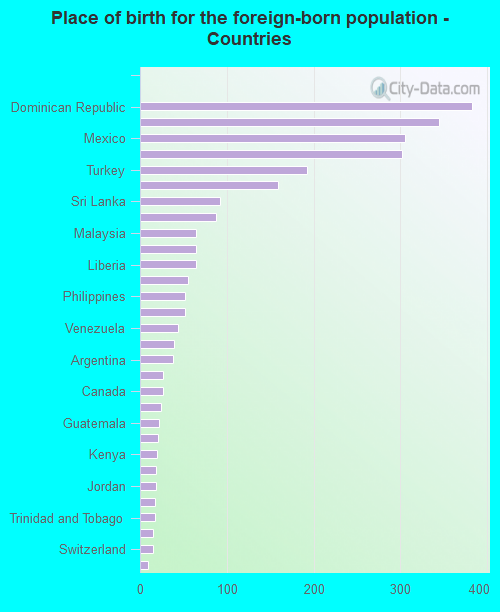
According to 2022 data, the most numerous races in Middletown, DE are White alone (12,000 residents), Black alone (7,333 residents), and Hispanic (1,589 residents). 85.7% of Middletown residents speak English at home. 12.7% of Middletown, DE residents are foreign-born (4.7% born in Asia, 4.1% born in Latin America, 3.4% born in Africa), which is 29.0% greater than the foreign-born rate of 9.0% across the entire state of Delaware.
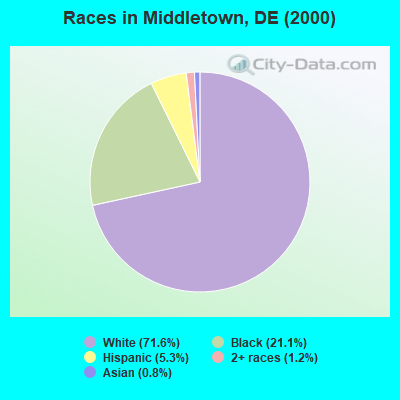
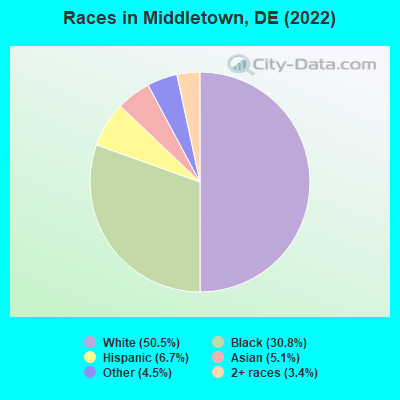
Race distribution in Middletown
2000 2022
567,973 72.5% White alone 148,435 18.9% Black alone 37,277 4.8% Hispanic 16,110 2.1% Asian alone 10,222 1.3% Two or more races 2,324 0.3% American Indian alone 1,025 0.1% Other race alone 234 0.03% Native Hawaiian and Other
599,347 58.9% White alone 220,010 21.6% Black alone 105,300 10.3% Hispanic 46,016 4.5% Two or more races 41,350 4.1% Asian alone 5,097 0.5% Other race alone 1,276 0.1% American Indian alone
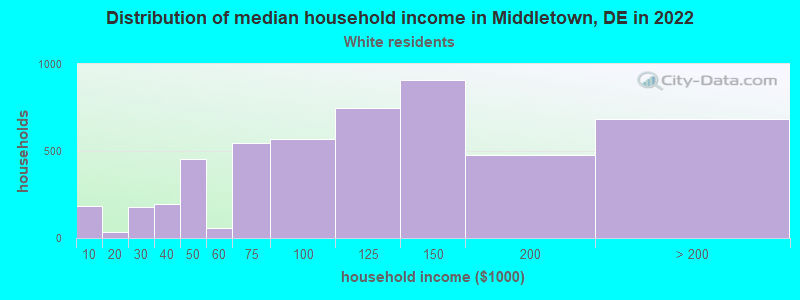
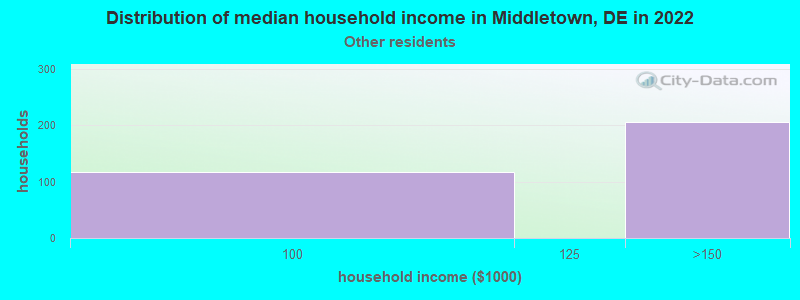
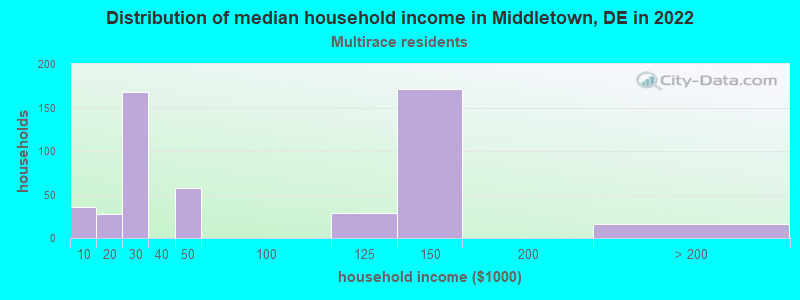
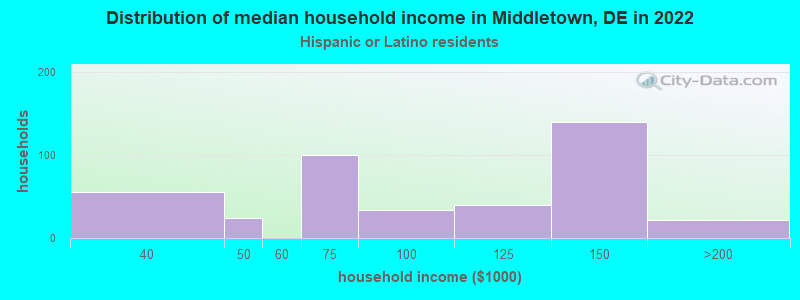
Income and house value in Middletown Median household income in 2022 $111,925 White non-Hispanic householders$93,211 Black householders$127,663 Asian householders$165,722 Some other race householders$87,658 Hispanic or Latino race householdersMedian 2022 house value $462,627 White Non-Hispanic householders$359,737 Black or African American householders $797,020 Asian householders$487,214 Some other race householders$567,408 Two or more races householders$509,532 Hispanic or Latino householders
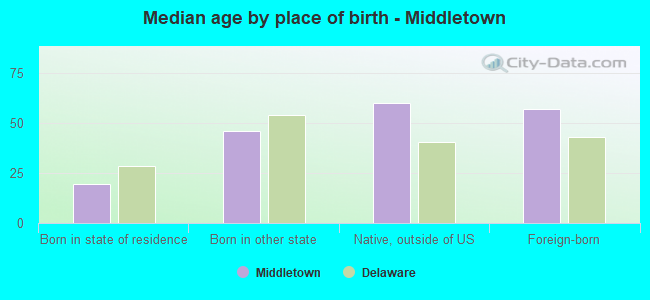
Median age by race in Middletown
38.8 Median age for White residents37.4 40.0 36.3 Median age for Black or African American residents35.3 40.8 -592,964,823.5 Median age for American Indian / Alaska Native residents-639,393,938.8 -659,673,659.0 46.6 Median age for Asian residents54.9 45.5 -666,666,666.0 Median age for Native Hawaiian / Pacific Islander residents-668,724,279.2 -670,599,802.7 14.4 Median age for Other race residents14.2 34.6 61.5 Median age for Two or more races residents40.7 81.1 38.9 Median age for White alone residents38.0 39.4 37.2 Median age for Hispanic or Latino residents32.9 46.6
Owner/renter occupied households by race in Middletown
House owners and renters - White residents 4,115 83.0% Owner occupied843 17.0% Renter occupiedHouse owners and renters - Black or African American residents 1,476 59.6% Owner occupied1,002 40.4% Renter occupiedHouse owners and renters - Asian residents 360 99.0% Owner occupied4 1.0% Renter occupiedHouse owners and renters - Other race residents 69 30.1% Owner occupied160 69.9% Renter occupiedHouse owners and renters - Two or more races residents 413 79.7% Owner occupied105 20.3% Renter occupiedHouse owners and renters - White alone residents 4,117 84.2% Owner occupied775 15.8% Renter occupiedHouse owners and renters - Hispanic or Latino residents 219 55.0% Owner occupied180 45.0% Renter occupied
Language usage in Middletown
English speakers - Total 85.7% of residents of Middletown speak English at home.
5.7% of residents speak Spanish at home 828 64.3% Speak English very well459 35.7% Speak English less than very well8.7% of residents speak other language at home 1,571 79.4% Speak English very well407 20.6% Speak English less than very well
English speakers - Born in the United States 96.7% of residents of Middletown speak English at home.
1.0% of residents speak Spanish at home 120 100.0% Speak English very well2.3% of residents speak other language at home 276 100.0% Speak English very well
English speakers - Native, born elsewhere 33.3% of residents of Middletown speak English at home.
54.7% of residents speak Spanish at home 17 9.5% Speak English very well162 90.5% Speak English less than very well11.6% of residents speak other language at home 38 100.0% Speak English very well
English speakers - Foreign-born 24.6% of residents of Middletown speak English at home.
24.6% of residents speak Spanish at home 419 55.9% Speak English very well331 44.1% Speak English less than very well51.5% of residents speak other language at home 1,236 78.7% Speak English very well335 21.3% Speak English less than very well
White (Caucasian) - Speak only English Native:
97.4% (10,918)Foreign-born:
55.9% (237)
White (Caucasian) - Speak another language Native:
2.3% (260)Foreign-born:
52.9% (224)
Black or African American - Speak only English Native:
97.5% (6,009)Foreign-born:
20.7% (207)
Black or African American - Speak another language Native:
2.5% (152)Foreign-born:
88.9% (889)
Asian - Speak only English Native:
32.7% (84)Foreign-born:
24.2% (226)
Asian - Speak another language Native:
71.7% (183)Foreign-born:
78.0% (730)
Two or more races - Speak another language Native:
12.8% (144)Foreign-born:
98.6% (746)
White alone - Speak only English Native:
98.8% (10,869)Foreign-born:
82.3% (259)
White alone - Speak another language Native:
1.2% (137)Foreign-born:
19.8% (62)
Hispanic or Latino - Speak only English Native:
33.6% (241)Foreign-born:
4.6% (38)
Hispanic or Latino - Speak another language Native:
65.7% (472)Foreign-born:
91.5% (752)
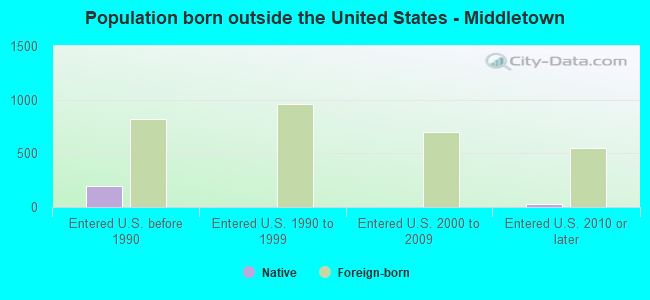
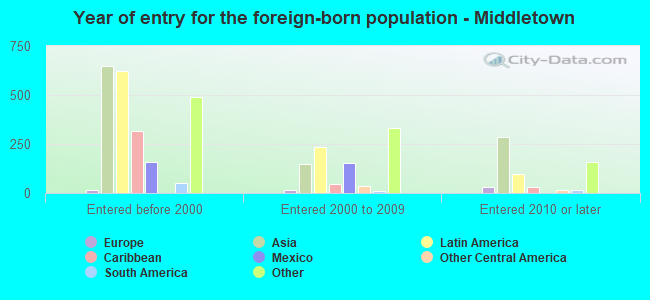
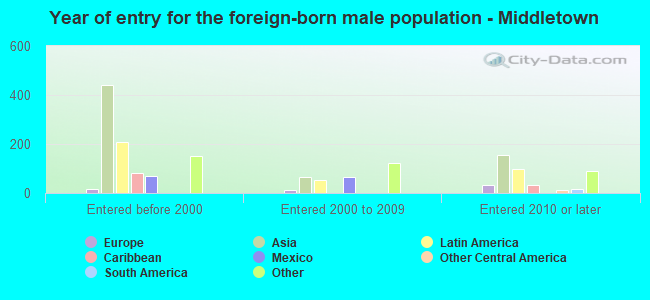
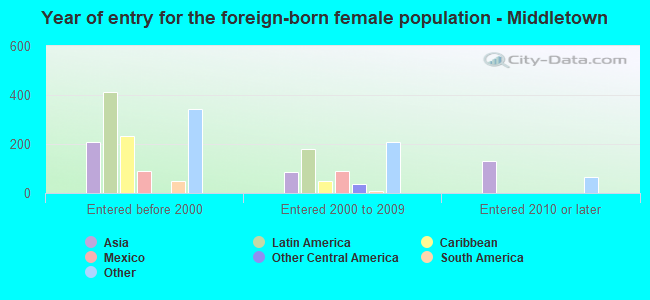
Foreign-born residents in Middletown 3,013 residents are foreign born (4.7% Asia , 4.1% Latin America , 3.4% Africa ).
This city:
12.7%Delaware:
9.8%
Marital status for residents in Middletown Marital status - White (Caucasian) population 15 years and over
Males 21.4% Never married62.0% Now married3.3% Separated1.8% Widowed11.5% DivorcedFemales 21.0% Never married53.4% Now married1.7% Separated10.1% Widowed13.8% DivorcedWomen who gave birth in the past 12 months Now married:
100.0% (209)Unmarried:
0.0% (0)
Women who did not give birth in the past 12 months Now married:
55.6% (1,433)Unmarried:
44.4% (1,144)
Marital status - Black or African American population 15 years and over
Males 47.4% Never married44.9% Now married2.2% Separated0.7% Widowed4.9% DivorcedFemales 48.4% Never married22.1% Now married2.5% Separated8.4% Widowed18.5% DivorcedWomen who did not give birth in the past 12 months Now married:
17.2% (415)Unmarried:
82.8% (2,004)
Marital status - Asian population 15 years and over
Males 16.4% Never married83.6% Now married0.0% Separated0.0% Widowed0.0% DivorcedFemales 5.0% Never married82.3% Now married0.0% Separated4.7% Widowed8.0% DivorcedWomen who gave birth in the past 12 months Now married:
100.0% (17)Unmarried:
0.0% (0)
Women who did not give birth in the past 12 months Now married:
89.0% (194)Unmarried:
11.0% (24)
Marital status - Other race population 15 years and over
Males 100.0% Never married0.0% Now married0.0% Separated0.0% Widowed0.0% DivorcedFemales 100.0% Never married0.0% Now married0.0% Separated0.0% Widowed0.0% DivorcedWomen who did not give birth in the past 12 months Now married:
0.0% (0)Unmarried:
100.0% (358)
Marital status - Two or more races population 15 years and over
Males 10.5% Never married79.3% Now married4.1% Separated0.0% Widowed6.1% DivorcedFemales 16.9% Never married56.1% Now married0.0% Separated27.0% Widowed0.0% DivorcedWomen who did not give birth in the past 12 months Now married:
36.9% (51)Unmarried:
63.1% (88)
Marital status - White alone, not Hispanic / Latino population 15 years and over
Males 20.5% Never married63.8% Now married1.4% Separated2.0% Widowed12.3% DivorcedFemales 20.9% Never married53.6% Now married0.3% Separated10.7% Widowed14.5% DivorcedWomen who gave birth in the past 12 months Now married:
100.0% (189)Unmarried:
0.0% (0)
Women who did not give birth in the past 12 months Now married:
53.7% (1,387)Unmarried:
46.3% (1,194)
Marital status - Hispanic or Latino population 15 years and over
Males 23.2% Never married56.9% Now married19.9% Separated0.0% Widowed0.0% DivorcedFemales 21.9% Never married43.1% Now married12.4% Separated22.6% Widowed0.0% DivorcedWomen who gave birth in the past 12 months Now married:
100.0% (37)Unmarried:
0.0% (0)
Women who did not give birth in the past 12 months Now married:
65.9% (151)Unmarried:
34.1% (78)
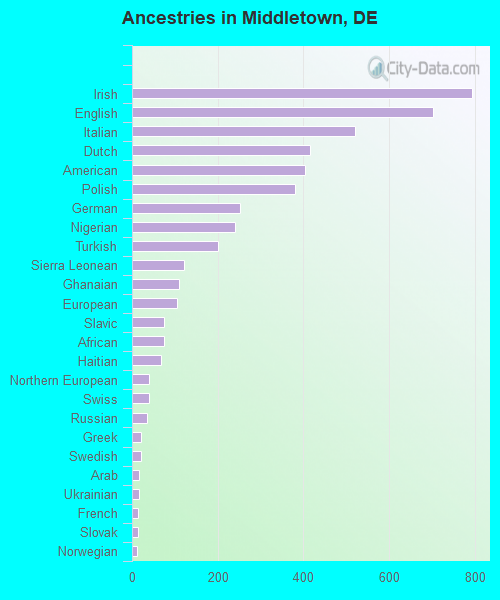
Ancestries in Middletown
794 7.8% Irish704 6.9% English521 5.1% Italian415 4.1% Dutch403 4.0% American381 3.7% Polish252 2.5% German240 2.4% Nigerian202 2.0% Turkish122 1.2% Sierra Leonean110 1.1% Ghanaian106 1.0% European74 0.7% Slavic74 0.7% African68 0.7% Haitian39 0.4% Northern European39 0.4% Swiss36 0.4% Russian21 0.2% Greek20 0.2% Swedish16 0.2% Arab16 0.2% Ukrainian14 0.1% French13 0.1% Slovak11 0.1% Norwegian10 0.10% French Canadian10 0.10% Pennsylvania German8 0.08% Lithuanian
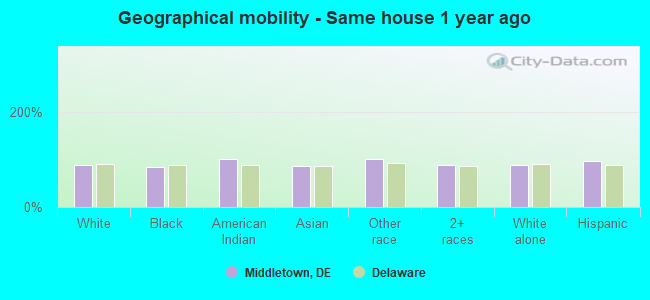
Geographical mobility in Middletown Same house 1 year ago 10,789 89.4% White (Caucasian)6,131 83.6% Black or African American26 100.0% American Indian / Alaska Native1,030 86.0% Asian970 100.0% Other race1,688 89.4% Two or more races10,471 88.9% White alone, not Hispanic / Latino1,537 96.7% Hispanic or LatinoMoved within same county 582 4.8% White / Caucasian127 1.7% Black or African American42 3.5% Asian89 4.7% Two or more races647 5.5% White alone, not Hispanic / LatinoMoved within same state 204 2.8% Black or African American28 1.5% Two or more races30 1.9% Hispanic or LatinoMoved from different state 699 5.8% White / Caucasian1,012 13.8% Black or African American713 6.1% White alone, not Hispanic / Latino5 0.3% Hispanic or LatinoMoved from abroad 41 0.3% White175 14.6% Asian86 4.6% Two or more races39 2.5% Hispanic or Latino
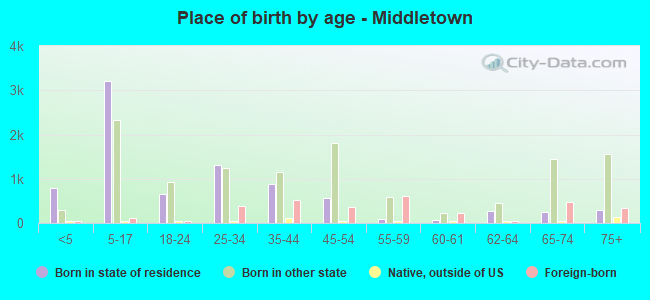
Children Nativity (place of birth) in Middletown
Children under 6 years - Living with two parents Both parents native 551 100.0% NativeBoth parents foreign-born 91 100.0% NativeOne native, one foreign-born parent 333 100.0% NativeChildren under 6 years - Living with one parent Native parent 219 100.0% NativeChildren 6 to 17 years - Living with two parents Both parents native 2,186 99.4% Native13 0.6% Foreign-bornBoth parents foreign-born 628 92.9% Native48 7.1% Foreign-bornOne native, one foreign-born parent 284 100.0% NativeChildren 6 to 17 years - Living with one parent Native parent 1,352 100.0% NativeForeign-born parent 498 53.6% Native431 46.4% Foreign-born
Grandparents responsible for own grandchildren in Middletown
Grandparents (30 to 59 years) White / Caucasian 49 82.9% Responsible for grandchildren10 17.1% Not responsible for grandchildrenAsian 41 100.0% Not responsible for grandchildrenWhite alone, not Hispanic / Latino 56 87.3% Responsible for grandchildren8 12.7% Not responsible for grandchildren
Grandparents (60 years and over) White / Caucasian 97 100.0% Not responsible for grandchildrenAsian 57 100.0% Not responsible for grandchildrenWhite alone, not Hispanic / Latino 101 100.0% Not responsible for grandchildren