Miami, FL (Florida) Houses and Residents
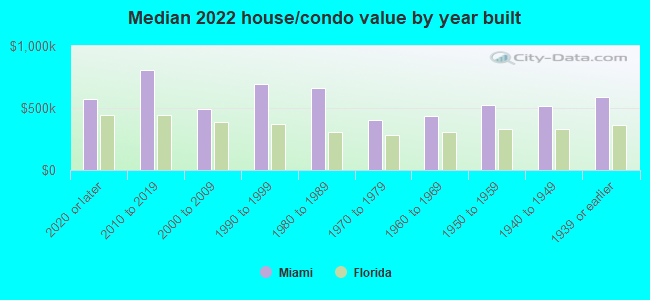
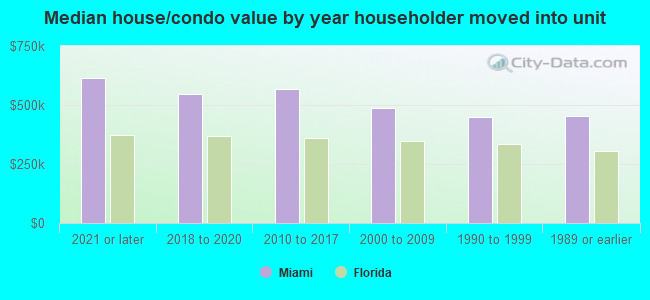
| Miami: | $535,600 |
| Florida: | $354,100 |
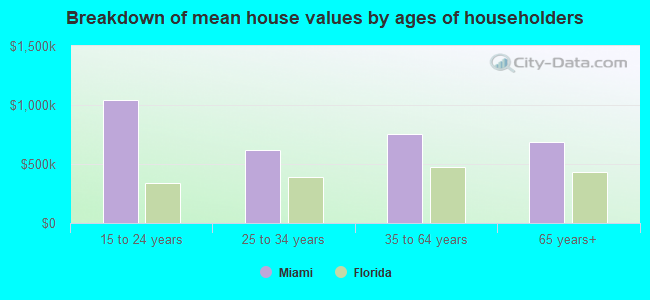
Mean price in 2022:
Detached houses: $834,023
Here: $834,023 State: $500,941 Townhouses or other attached units: $619,182
Here: $619,182 State: $370,869 In 2-unit structures: $466,400
Here: $466,400 State: $423,188 In 3-to-4-unit structures: $227,224
Here: $227,224 State: $309,944 In 5-or-more-unit structures: $631,350
Here: $631,350 State: $447,145 Mobile homes: $101,074
Here: $101,074 State: $113,202
Total population: 430,332 (Urban population: 362,563, Rural population: 0)
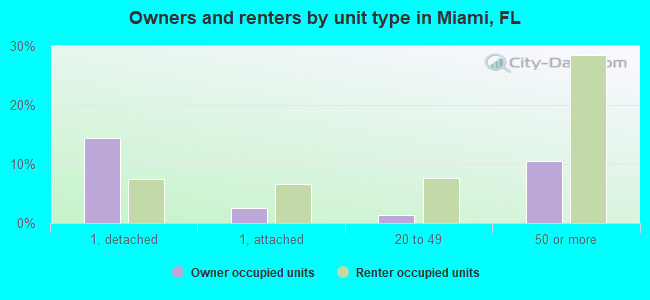
Houses: 228,213 (199,578 occupied: 60,457 owner occupied, 139,121 renter occupied)
| % of renters here: | 70% |
| State: | 33% |
Housing density: 6,397 houses/condos per square mile
Median price asked for vacant for-sale houses and condos in 2022: $726,967.
Median contract rent in 2022: $1,460 (lower quartile is $1,017, upper quartile is over $2,000)
Median rent asked for vacant for-rent units in 2022: $2,613
Median gross rent in Miami, FL in 2022: $1,580
Housing units in Miami with a mortgage: 33,264 (2,890 second mortgage, 0 home equity loan, 2,639 both second mortgage and home equity loan)
Houses without a mortgage: 703
Median household income for houses/condos with a mortgage: $125,590
Median household income for apartments without a mortgage: $69,451
Median monthly housing costs: $1,619
Compare current foreclosures in Miami, FL:
| Photo | Address | Area | Beds / Baths | Price | Details |
|---|---|---|---|---|---|

|
#1
SW 38th Ct
Miami, FL 33134
|
2,823 sq. feet
|
4 baths 6 beds |
$1,200,000
|
show details |

|
#2
NE 1st Ave Unit #2200
Miami, FL 33132
|
- sq. feet
|
2 baths 1 beds |
$715,000
|
show details |

|
#3
Fountainebleau
Miami, FL 33172
|
676 sq. feet
|
1 baths 1 beds |
show details | |

|
#4
SW 19th St
Miami, FL 33145
|
2,689 sq. feet
|
3 baths 5 beds |
show details | |

|
#5
SW 161st Ave
Miami, FL 33196
|
1,972 sq. feet
|
2 baths 3 beds |
show details | |

|
#6
NW 10th Ave
Miami, FL 33128
|
2,973 sq. feet
|
1 baths 2 beds |
show details | |

|
#7
SW 87th Pl Dr
Miami, FL 33165
|
1,545 sq. feet
|
2 baths 3 beds |
show details | |

|
#8
Sans Souci C104
Miami, FL 33181
|
1,304 sq. feet
|
2 baths 2 beds |
show details | |

|
#9
SW 117th Ct
Miami, FL 33175
|
2,047 sq. feet
|
3 baths 4 beds |
show details | |

|
#10
-2922 SW 37 Ct
Miami, FL 33134
|
2,369 sq. feet
|
3 baths 5 beds |
show details |
| Photo | Address | Area | Beds / Baths | Price | Details |
|---|---|---|---|---|---|

|
#11
NW 58th Ter
Miami, FL 33178
|
2,450 sq. feet
|
3 baths 4 beds |
show details | |

|
#12
Sw59th Pl
Miami, FL 33143
|
1,278 sq. feet
|
2 baths 4 beds |
show details | |

|
#13
NW 42nd Ave Apt 407
Miami, FL 33126
|
958 sq. feet
|
2 baths 2 beds |
show details | |

|
#14
NW 33rd Avenue Rd
Miami, FL 33147
|
912 sq. feet
|
1 baths 3 beds |
show details | |

|
#15
SW 165th Ter
Miami, FL 33157
|
2,746 sq. feet
|
2 baths 4 beds |
show details | |

|
#16
SW 89th Ave
Miami, FL 33157
|
5,612 sq. feet
|
3 baths 4 beds |
show details | |

|
#17
NW 12th Ave
Miami, FL 33168
|
1,930 sq. feet
|
1 baths 3 beds |
show details | |

|
#18
- 830 NW 23rd Ct
Miami, FL 33125
|
- sq. feet
|
4 baths 6 beds |
show details | |

|
#19
Crystal Ct
Miami, FL 33133
|
1,517 sq. feet
|
2 baths 3 beds |
show details | |

|
#20
SW 6th St
Miami, FL 33144
|
1,869 sq. feet
|
2 baths 3 beds |
show details |
| Photo | Address | Area | Beds / Baths | Price | Details |
|---|---|---|---|---|---|

|
#21
NE 127th St
Miami, FL 33161
|
3,042 sq. feet
|
6 baths 6 beds |
show details | |

|
#22
SW 107th Pl
Miami, FL 33157
|
2,196 sq. feet
|
2 baths 3 beds |
show details | |

|
#23
NW 177th Ter
Miami, FL 33169
|
1,368 sq. feet
|
2 baths 3 beds |
show details | |

|
#24
SW 142nd Ct
Miami, FL 33177
|
1,403 sq. feet
|
2 baths 3 beds |
show details | |

|
#25
SW 202nd Ter
Miami, FL 33189
|
1,668 sq. feet
|
2 baths 3 beds |
show details | |

|
#26
NE 15th Ave Apt 402
Miami, FL 33161
|
1,050 sq. feet
|
2 baths 2 beds |
show details | |

|
#27
SW 99th St
Miami, FL 33196
|
2,601 sq. feet
|
3 baths 4 beds |
show details | |

|
#28
E Country Club Dr Ph 403
Miami, FL 33180
|
1,622 sq. feet
|
2 baths 2 beds |
show details | |

|
#29
NW 14th Ct
Miami, FL 33169
|
2,262 sq. feet
|
2 baths 3 beds |
show details | |

|
#30
SW 9th St
Miami, FL 33184
|
1,877 sq. feet
|
3 baths 4 beds |
show details |
| Photo | Address | Area | Beds / Baths | Price | Details |
|---|---|---|---|---|---|

|
#31
SW 38th Ln
Miami, FL 33165
|
1,233 sq. feet
|
2 baths 2 beds |
show details | |

|
#32
NE 2nd Ave
Miami, FL 33132
|
662 sq. feet
|
1 baths 1 beds |
show details | |

|
#33
SW 3rd Ave
Miami, FL 33145
|
1,666 sq. feet
|
3 baths 3 beds |
show details | |

|
#34
NW 5th Ave
Miami, FL 33150
|
1,418 sq. feet
|
1 baths 2 beds |
show details | |

|
#35
NW 140th Ter
Miami, FL 33168
|
746 sq. feet
|
1 baths 2 beds |
show details | |

|
#36
SW 119th Ct
Miami, FL 33177
|
1,148 sq. feet
|
1 baths 2 beds |
show details | |

|
#37
NE 145th St
Miami, FL 33161
|
1,382 sq. feet
|
2 baths 4 beds |
show details | |

|
#38
Miller Dr
Miami, FL 33155
|
3,268 sq. feet
|
1 baths 2 beds |
show details | |

|
#39
SW 6th St
Miami, FL 33134
|
1,654 sq. feet
|
1 baths 2 beds |
show details | |

|
#40
NW 83rd St
Miami, FL 33150
|
1,107 sq. feet
|
1 baths 2 beds |
show details |
| Photo | Address | Area | Beds / Baths | Price | Details |
|---|---|---|---|---|---|

|
#41
NE 144th St
Miami, FL 33161
|
1,061 sq. feet
|
1 baths 2 beds |
show details | |

|
#42
NW 75th St
Miami, FL 33147
|
820 sq. feet
|
1 baths 2 beds |
show details | |

|
#43
SW 119th St
Miami, FL 33186
|
2,087 sq. feet
|
2 baths 4 beds |
show details | |

|
#44
NW 30th Ave
Miami, FL 33142
|
1,047 sq. feet
|
2 baths 3 beds |
show details | |

|
#45
SW 2nd St
Miami, FL 33144
|
1,295 sq. feet
|
1 baths 1 beds |
show details | |

|
#46
SW 132nd Circle Ct
Miami, FL 33186
|
408 sq. feet
|
1 baths 2 beds |
show details | |

|
#47
SW 103rd Pl
Miami, FL 33157
|
1,544 sq. feet
|
2 baths 3 beds |
show details | |

|
#48
SW 67th Ave
Miami, FL 33155
|
857 sq. feet
|
1 baths 2 beds |
show details | |

|
#49
SW 67th St
Miami, FL 33183
|
1,847 sq. feet
|
2 baths 3 beds |
show details | |

|
Check over 1 million property listings on Foreclosure.com!
|
browse all offers | |||

Latest news about housing in Miami, FL collected exclusively by city-data.com from local newspapers, TV, and radio stations


Median year apartment built: 1983
Household type by relationship:
Households: 449,484- Male householders: 105,456 (41,671 living alone), Female householders: 94,122 (37,708 living alone)
56,927 spouses (54,200 opposite-sex spouses), 17,511 unmarried partners, (15,983 opposite-sex unmarried partners), 93,524 children (89,632 natural, 980 adopted, 2,912 stepchildren), 9,486 grandchildren, 8,959 brothers or sisters, 12,077 parents, 608 foster children, 17,066 other relatives, 26,942 non-relatives
- In group quarters: 6,806
Size of family households: 42,730 2-persons, 25,996 3-persons, 18,637 4-persons, 7,050 5-persons, 2,431 6-persons, 1,946 7-or-more-persons.
Size of nonfamily households: 79,379 1-person, 17,079 2-persons, 3,020 3-persons, 689 4-persons, 277 5-persons, 344 7-or-more-persons.
29,122 married couples with children.
28,512 single-parent households (5,745 men, 22,767 women).
24.1% of residents of Miami speak English at home.
67.6% of residents speak Spanish at home (48% speak English very well, 16% speak English well, 19% speak English not well, 17% don't speak English at all).
6.5% of residents speak other Indo-European language at home (68% speak English very well, 19% speak English well, 11% speak English not well, 3% don't speak English at all).
1.3% of residents speak Asian or Pacific Island language at home (60% speak English very well, 18% speak English well, 21% speak English not well, 1% don't speak English at all).
0.5% of residents speak other language at home (85% speak English very well, 12% speak English well, 3% don't speak English at all).
Foreign born population: 259,723 (57.8%)
(51.2% of them are naturalized citizens)
| Here: | 4.7 |
| State: | 5.9 |
| Here: | 3.4 |
| State: | 4.2 |
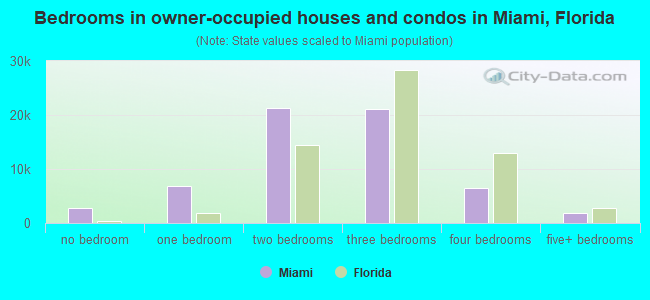
- Bedrooms in owner-occupied houses and condos in Miami, Florida
- 2,781no bedroom
- 6,8691 bedroom
- 21,2762 bedrooms
- 21,1703 bedrooms
- 6,4244 bedrooms
- 1,9375+ bedrooms
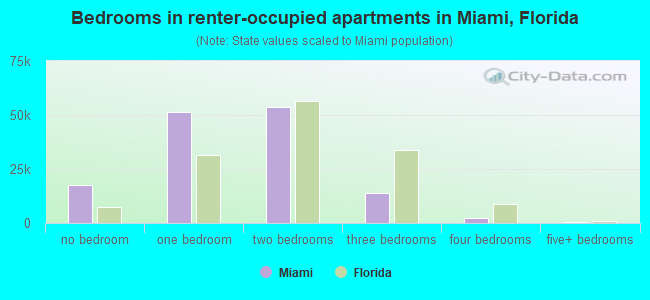
- Bedrooms in renter-occupied apartments in Miami, Florida
- 17,389no bedroom
- 51,2911 bedroom
- 53,5222 bedrooms
- 13,8753 bedrooms
- 2,4754 bedrooms
- 5695+ bedrooms
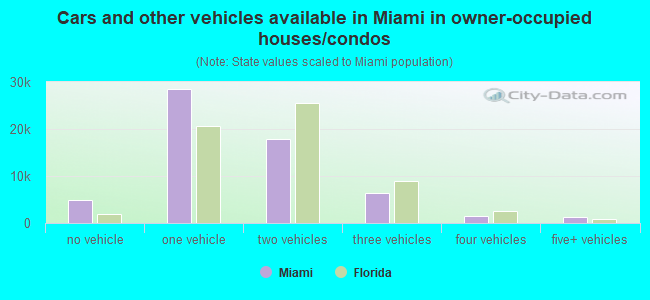
- Cars and other vehicles available in Miami in owner-occupied houses/condos
- 4,840no vehicle
- 28,5481 vehicle
- 17,8802 vehicles
- 6,4313 vehicles
- 1,3834 vehicles
- 1,3755+ vehicles
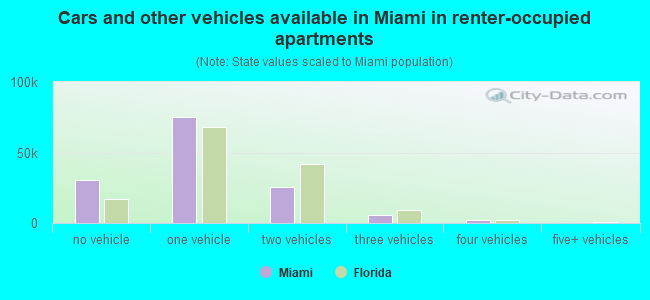
- Cars and other vehicles available in Miami in renter-occupied apartments
- 30,843no vehicle
- 74,9431 vehicle
- 25,8702 vehicles
- 5,4783 vehicles
- 1,7914 vehicles
- 1965+ vehicles
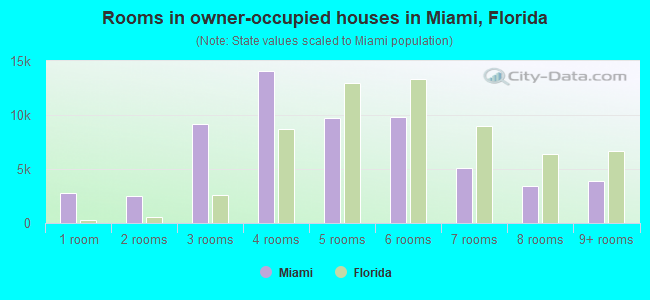
- Rooms in owner-occupied houses in Miami, Florida
- 2,7811 room
- 2,5142 rooms
- 9,1513 rooms
- 14,0394 rooms
- 9,6815 rooms
- 9,8456 rooms
- 5,1187 rooms
- 3,4228 rooms
- 3,9069+ rooms
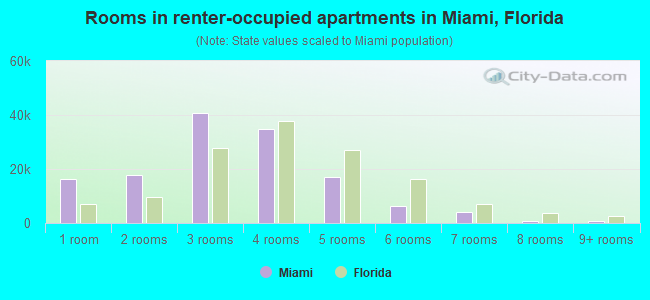
- Rooms in renter-occupied apartments in Miami, Florida
- 16,4691 room
- 17,7762 rooms
- 40,6943 rooms
- 34,7364 rooms
- 17,1385 rooms
- 6,4686 rooms
- 4,1837 rooms
- 9178 rooms
- 7409+ rooms
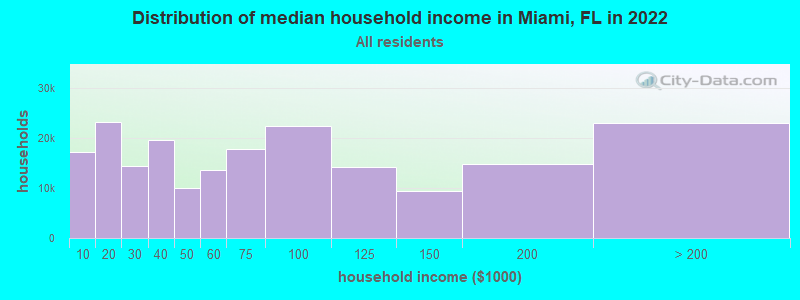
Miami, FL household income distribution

- 17,186Less than $10,000
- 23,187$10,000 to $19,999
- 14,452$20,000 to $29,999
- 19,572$30,000 to $39,999
- 10,051$40,000 to $49,999
- 13,604$50,000 to $59,999
- 17,818$60,000 to $74,999
- 22,389$75,000 to $99,999
- 14,198$100,000 to $124,999
- 9,309$125,000 to $149,999
- 14,794$150,000 to $199,999
- 23,018$200,000 or more
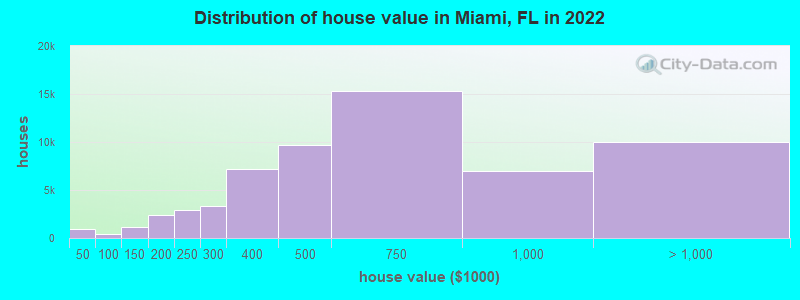
Home value of owner - occupied houses in 2022 in Miami, FL
-
- 365Less than $10,000
- 101$10,000 to $14,999
- 191$25,000 to $29,999
- 262$30,000 to $34,999
- 63$35,000 to $39,999
- 145$50,000 to $59,999
- 41$60,000 to $69,999
- 128$70,000 to $79,999
- 95$80,000 to $89,999
- 221$100,000 to $124,999
- 927$125,000 to $149,999
- 1,631$150,000 to $174,999
- 739$175,000 to $199,999
- 2,929$200,000 to $249,999
- 3,312$250,000 to $299,999
- 7,186$300,000 to $399,999
- 9,706$400,000 to $499,999
- 15,350$500,000 to $749,999
- 7,026$750,000 to $999,999
- 4,425$1,000,000 to $1,499,999
- 2,056$1,500,000 to $1,999,999
- 3,558$2,000,000 or more
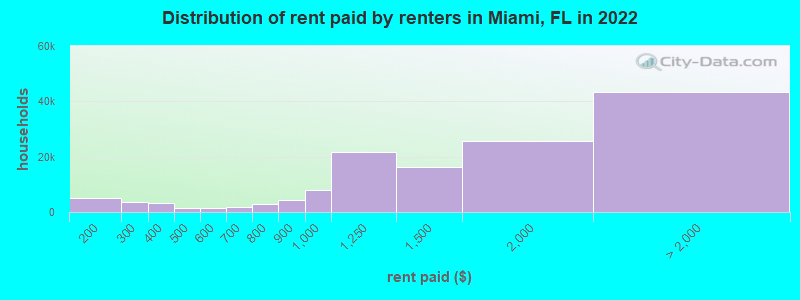
Rent paid by renters in 2022 in Miami, FL
-
- 471$100 to $149
- 4,741$150 to $199
- 3,084$200 to $249
- 667$250 to $299
- 1,616$300 to $349
- 1,742$350 to $399
- 1,038$400 to $449
- 487$450 to $499
- 1,041$500 to $549
- 475$550 to $599
- 779$600 to $649
- 1,000$650 to $699
- 1,277$700 to $749
- 1,526$750 to $799
- 4,428$800 to $899
- 7,951$900 to $999
- 21,574$1,000 to $1,249
- 16,227$1,250 to $1,499
- 25,625$1,500 to $1,999
- 17,996$2,000 to $2,499
- 8,618$2,500 to $2,999
- 5,551$3,000 to $3,499
- 7,187$3,500 or more
- 4,020No cash rent
Percentage of workers working in this county: 95.5%
Number of people working at home: 43,131 (17.5% of all workers)
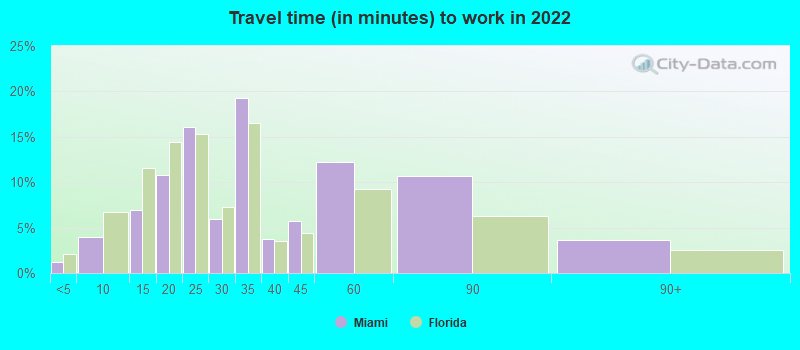
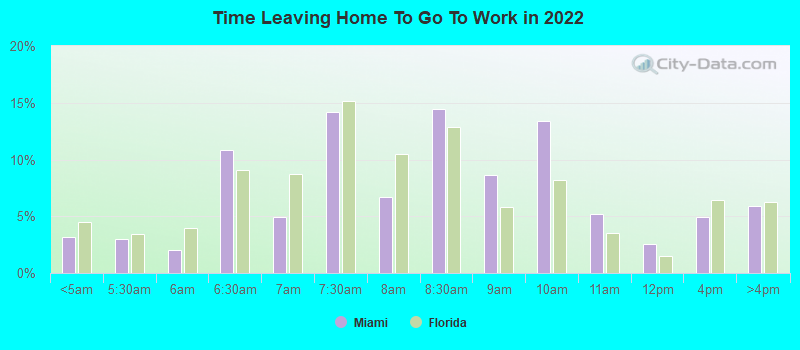
Travel time to work (commute)
- Less than 5 minutes: 2,710
- 5 to 9 minutes: 9,539
- 10 to 14 minutes: 21,156
- 15 to 19 minutes: 27,519
- 20 to 24 minutes: 34,302
- 25 to 29 minutes: 14,157
- 30 to 34 minutes: 37,156
- 35 to 39 minutes: 5,580
- 40 to 44 minutes: 9,818
- 45 to 59 minutes: 21,350
- 60 to 89 minutes: 14,572
- 90 or more minutes: 4,846
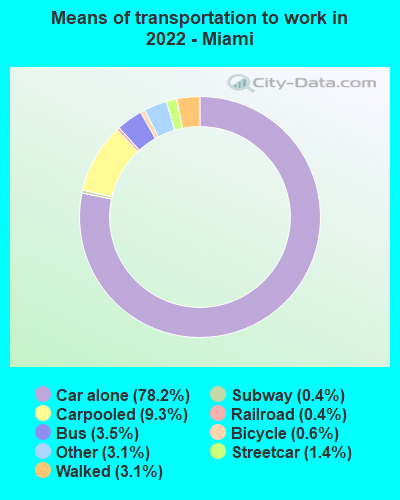
Means of transportation to work:
- Drove a car alone: 332,789 (71.0%)
- Carpooled: 39,499 (8.4%)
- Bus: 15,041 (3.2%)
- Subway or elevated rail: 5,952 (1.3%)
- Long-distance train or commuter rail: 1,584 (0.3%)
- Light rail, streetcar or trolley: 1,898 (0.4%)
- Ferryboat: 58 (0.0%)
- Taxi: 13,323 (2.8%)
- Bicycle: 2,588 (0.6%)
- Walked: 13,015 (2.8%)
- Worked at home: 43,131 (9.2%)
- Unemployment by race in 2022
- Unemployment rate for White non-Hispanic residents
- 2.5%Males
- 2.8%Females
- Unemployment rate for Black residents
- 10.2%Males
- 5.6%Females
- Unemployment rate for American Indian and Alaska Native residents
- 8.6%Males
- Unemployment rate for Asian residents
- 1.6%Males
- 4.4%Females
- Unemployment rate for other race residents
- 5.0%Males
- 10.0%Females
- Unemployment rate for two or more race residents
- 3.9%Males
- 2.9%Females
- Unemployment rate for Hispanic or Latino residents
- 3.4%Males
- 4.2%Females
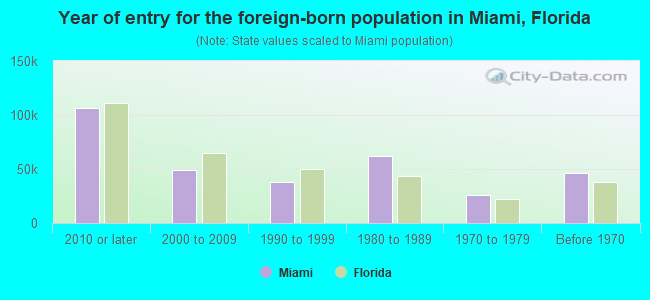
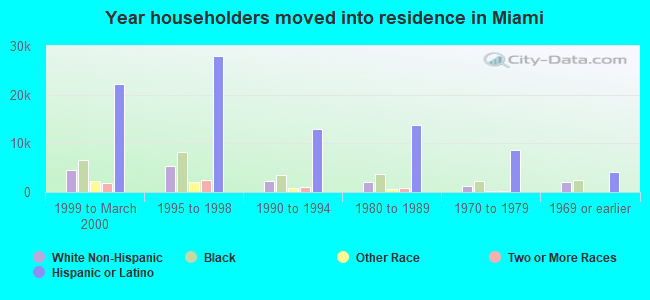
- Year of entry for the foreign-born population in Miami, Florida
- 106,8632010 or later
- 49,1002000 to 2009
- 37,6581990 to 1999
- 62,4471980 to 1989
- 26,0001970 to 1979
- 46,381Before 1970
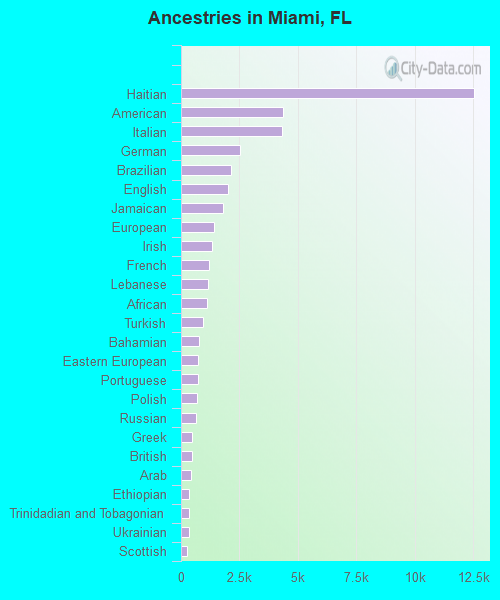
First ancestries reported:
- Haitian: 12,538 (4.0%)
- American: 4,350 (1.4%)
- Italian: 4,315 (1.4%)
- German: 2,533 (0.8%)
- Brazilian: 2,139 (0.7%)
- English: 2,003 (0.6%)
- Jamaican: 1,807 (0.6%)
- European: 1,393 (0.4%)
- Irish: 1,318 (0.4%)
- French: 1,190 (0.4%)
- Lebanese: 1,133 (0.4%)
- African: 1,113 (0.4%)
- Turkish: 925 (0.3%)
- Bahamian: 769 (0.2%)
- Eastern European: 719 (0.2%)
- Portuguese: 714 (0.2%)
- Polish: 699 (0.2%)
- Russian: 626 (0.2%)
- Greek: 459 (0.1%)
- British: 455 (0.1%)
- Arab: 415 (0.1%)
- Ethiopian: 363 (0.1%)
- Trinidadian and Tobagonian: 356 (0.1%)
- Ukrainian: 355 (0.1%)
- Scottish: 246 (0.08%)
- West Indian: 217 (0.07%)
- Latvian: 208 (0.07%)
- French Canadian: 206 (0.07%)
- Armenian: 205 (0.07%)
- Swedish: 201 (0.06%)
- Syrian: 200 (0.06%)
- Canadian: 194 (0.06%)
- Moroccan: 190 (0.06%)
- Israeli: 187 (0.06%)
- Austrian: 173 (0.06%)
- Iranian: 142 (0.05%)
- Bulgarian: 138 (0.04%)
- British West Indian: 137 (0.04%)
- Romanian: 131 (0.04%)
- Egyptian: 117 (0.04%)
- Dutch: 116 (0.04%)
- Guyanese: 110 (0.04%)
- Belgian: 106 (0.03%)
- Barbadian: 100 (0.03%)
- Danish: 99 (0.03%)
- Hungarian: 97 (0.03%)
- Iraqi: 95 (0.03%)
- Norwegian: 85 (0.03%)
- Basque: 84 (0.03%)
- Estonian: 84 (0.03%)
- Sudanese: 80 (0.03%)
- Lithuanian: 78 (0.02%)
- Swiss: 74 (0.02%)
- Czech: 62 (0.02%)
- Macedonian: 55 (0.02%)
- Serbian: 55 (0.02%)
- Albanian: 52 (0.02%)
- Slovak: 47 (0.02%)
- Palestinian: 42 (0.01%)
- Northern European: 40 (0.01%)
- U.S. Virgin Islander: 37 (0.01%)
- Scotch-Irish: 36 (0.01%)
- Scandinavian: 33 (0.01%)
- Croatian: 30 (0.01%)
- Bermudan: 27 (0.01%)
- Welsh: 25 (0.01%)
- Australian: 25 (0.01%)
- Jordanian: 23 (0.01%)
- South African: 16 (0.01%)
Most common places of birth for foreign-born residents (%):
| Miami: | 40.6% (104,245) |
| Florida: | 22.0% (1,006,576) |
| Miami: | 8.7% (22,303) |
| Florida: | 2.3% (105,066) |
| Miami: | 7.7% (19,698) |
| Florida: | 2.3% (107,160) |
| Miami: | 7.5% (19,337) |
| Florida: | 5.7% (262,042) |
| Miami: | 5.7% (14,578) |
| Florida: | 6.5% (298,669) |
| Miami: | 3.8% (9,760) |
| Florida: | 7.5% (342,375) |
| Miami: | 3.1% (7,989) |
| Florida: | 3.0% (137,727) |
| Miami: | 2.5% (6,426) |
| Florida: | 5.6% (257,152) |
| Miami: | 2.0% (5,062) |
| Florida: | 1.3% (57,263) |
| Miami: | 1.9% (4,786) |
| Florida: | 1.1% (49,838) |
| Miami: | 1.8% (4,520) |
| Florida: | 2.1% (96,693) |
| Miami: | 1.7% (4,466) |
| Florida: | 2.7% (122,906) |
Place of birth for U.S.-born residents:
- This state: 118,984
- Other state: 53,179
- Northeast: 21,306
- Midwest: 9,425
- South: 17,030
- West: 5,418
85.0% of Miami residents lived in the same house 1 years ago.
Out of people who lived in different houses, 41.7% lived in this county.
Out of people who lived in different counties, 31.1% lived in Florida.
| Miami: | 85.0% |
| State average: | 86.3% |
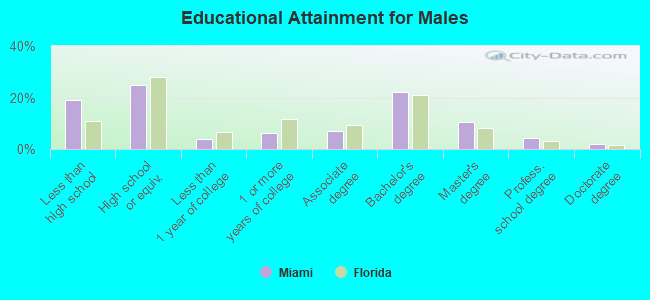
Education attainment for males 25 years and older:
- No schooling: 6,845
- Nursery to 4th grade: 3,138
- 5th and 6th grade: 5,757
- 7th and 8th grade: 3,949
- 9th grade: 3,483
- 10th grade: 2,129
- 11th grade: 3,221
- 12th grade, no diploma: 5,405
- High school graduate (or equivalency): 44,197
- Less than 1 year of college: 6,619
- Some college more than 1 year, no degree: 11,209
- Associate degree: 12,552
- Bachelor's degree: 39,049
- Master's degree: 18,523
- Professional school degree: 7,677
- Doctorate degree: 3,176
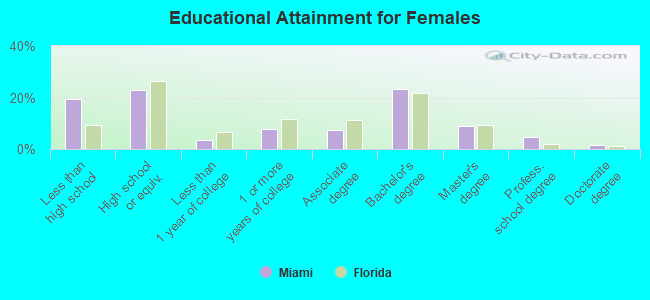
Education attainment for females 25 years and older:
- No schooling: 6,526
- Nursery to 4th grade: 2,968
- 5th and 6th grade: 5,833
- 7th and 8th grade: 2,746
- 9th grade: 4,547
- 10th grade: 2,808
- 11th grade: 2,209
- 12th grade, no diploma: 5,396
- High school graduate (or equivalency): 38,508
- Less than 1 year of college: 6,171
- Some college more than 1 year, no degree: 13,006
- Associate degree: 12,782
- Bachelor's degree: 39,191
- Master's degree: 15,348
- Professional school degree: 8,077
- Doctorate degree: 2,680

Housing units in structures:
- One, detached: 47,026
- One, attached: 21,095
- Two: 7,981
- 3 or 4: 8,295
- 5 to 9: 12,794
- 10 to 19: 14,835
- 20 to 49: 18,967
- 50 or more: 95,747
- Mobile homes: 1,254
- Boats, RVs, vans, etc.: 219
Housing units lacking complete kitchen facilities in 2022: 1.7%
House/condo owner moved in on average 9 years ago
Renter moved in on average 3 years ago
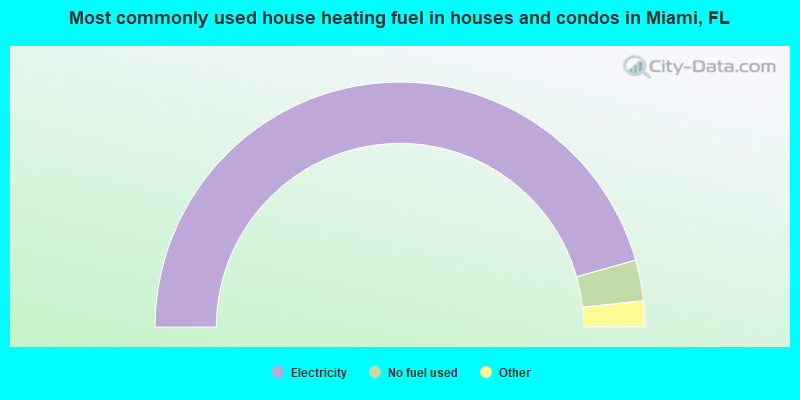
- 91.2%Electricity
- 5.4%No fuel used
- 2.5%Utility gas
- 0.5%Bottled, tank, or LP gas
- 0.2%Solar energy
- 0.2%Fuel oil, kerosene, etc.
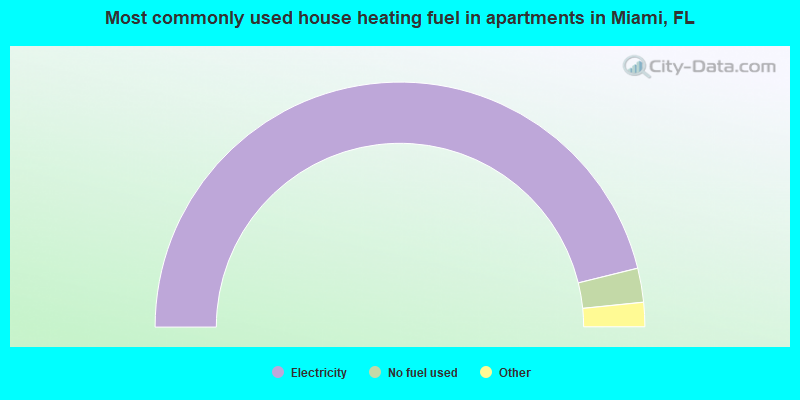
- 92.3%Electricity
- 4.5%No fuel used
- 2.7%Utility gas
- 0.3%Bottled, tank, or LP gas
- 0.1%Fuel oil, kerosene, etc.
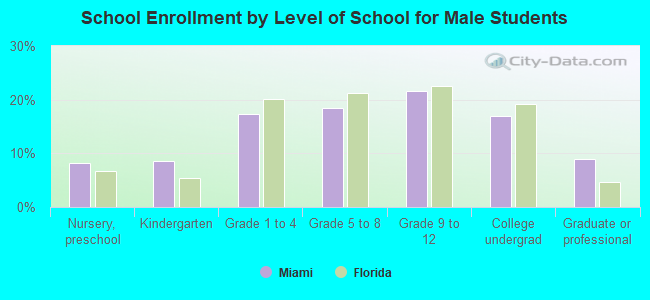
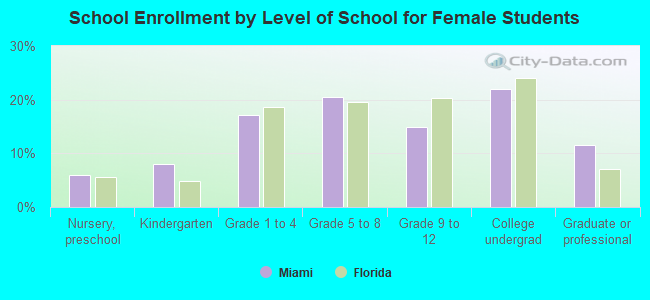
Private vs. public school enrollment:
| Here: | 10.7% |
| Florida: | 15.8% |
| Here: | 12.0% |
| Florida: | 12.9% |
| Here: | 20.3% |
| Florida: | 23.6% |