Races in Miami, Florida (FL) Detailed Stats
Data:
Races - White alone (%)
Races - White alone (% change since 2000)
Races - Black alone (%)
Races - Black alone (% change since 2000)
Races - American Indian alone (%)
Races - American Indian alone (% change since 2000)
Races - Asian alone (%)
Races - Asian alone (% change since 2000)
Races - Hispanic (%)
Races - Hispanic (% change since 2000)
Races - Native Hawaiian and Other Pacific Islander alone (%)
Races - Native Hawaiian and Other Pacific Islander alone (% change since 2000)
Races - Two or more races(%)
Races - Two or more races(% change since 2000)
Races - Other race alone (%)
Races - Other race alone (% change since 2000)
Racial diversity
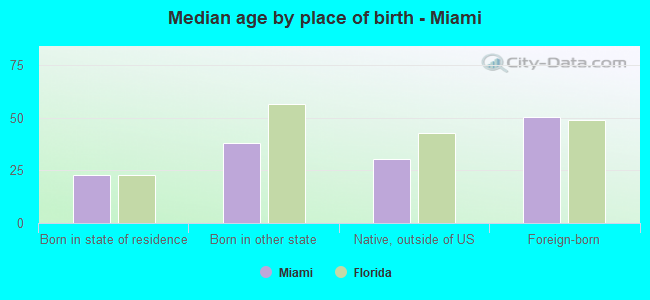
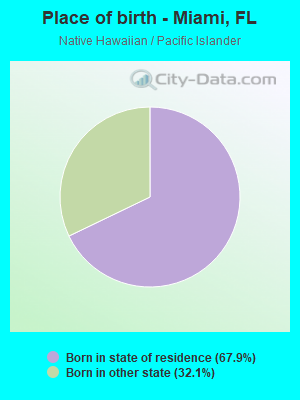
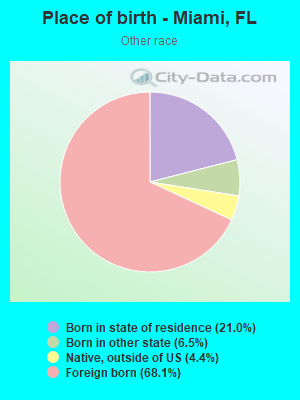
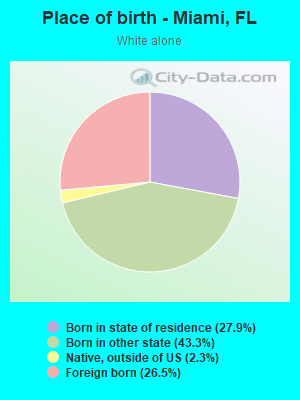
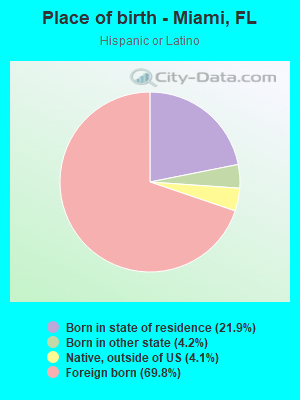
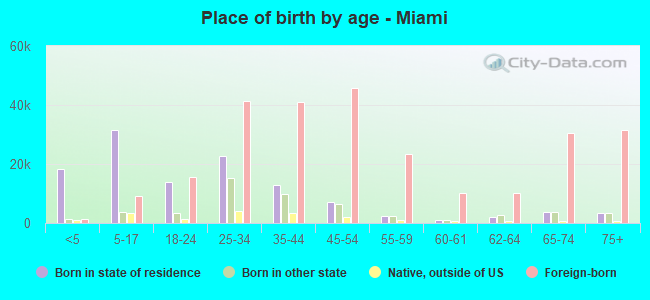
Place of birth - Born in state of residence (%)
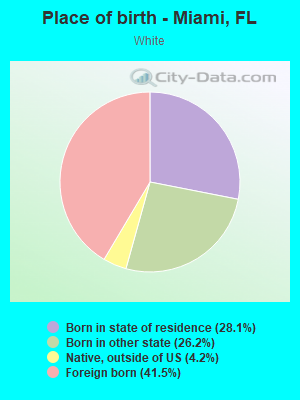
Place of birth - Born in state of residence (%) - White
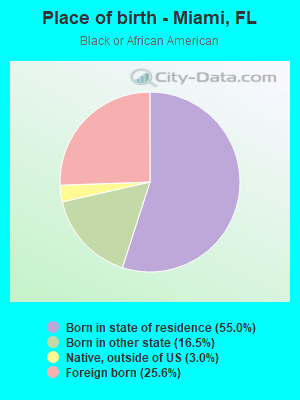
Place of birth - Born in state of residence (%) - Black or African American
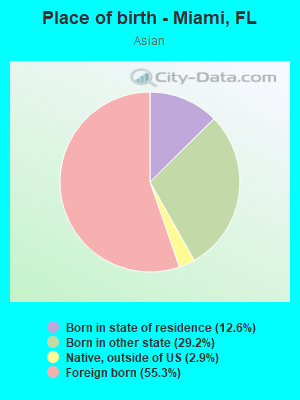
Place of birth - Born in state of residence (%) - Asian
Place of birth - Born in state of residence (%) - Hispanic or Latino
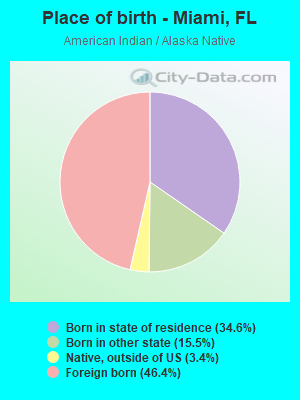
Place of birth - Born in state of residence (%) - American Indian and Alaska Native
Place of birth - Born in state of residence (%) - Multirace
Place of birth - Born in state of residence (%) - Other Race
Place of birth - Born in other state (%)
Place of birth - Born in other state (%) - White
Place of birth - Born in other state (%) - Black or African American
Place of birth - Born in other state (%) - Asian
Place of birth - Born in other state (%) - Hispanic or Latino
Place of birth - Born in other state (%) - American Indian and Alaska Native
Place of birth - Born in other state (%) - Multirace
Place of birth - Born in other state (%) - Other Race
Place of birth - Native, outside of US (%)
Place of birth - Native, outside of US (%) - White
Place of birth - Native, outside of US (%) - Black or African American
Place of birth - Native, outside of US (%) - Asian
Place of birth - Native, outside of US (%) - Hispanic or Latino
Place of birth - Native, outside of US (%) - American Indian and Alaska Native
Place of birth - Native, outside of US (%) - Multirace
Place of birth - Native, outside of US (%) - Other Race
Place of birth - Foreign born (%)
Place of birth - Foreign born (%) - White
Place of birth - Foreign born (%) - Black or African American
Place of birth - Foreign born (%) - Asian
Place of birth - Foreign born (%) - Hispanic or Latino
Place of birth - Foreign born (%) - American Indian and Alaska Native
Place of birth - Foreign born (%) - Multirace
Place of birth - Foreign born (%) - Other Race
Residents speaking English at home (%)
Residents speaking English at home - Born in the United States (%)
Residents speaking English at home - Native, born elsewhere (%)
Residents speaking English at home - Foreign born (%)
Residents speaking Spanish at home (%)
Residents speaking Spanish at home - Born in the United States (%)
Residents speaking Spanish at home - Native, born elsewhere (%)
Residents speaking Spanish at home - Foreign born (%)
Residents speaking other language at home (%)
Residents speaking other language at home - Born in the United States (%)
Residents speaking other language at home - Native, born elsewhere (%)
Residents speaking other language at home - Foreign born (%)
Marital status - Never married (%)
Marital status - Now married (%)
Marital status - Separated (%)
Marital status - Widowed (%)
Marital status - Divorced (%)
Ancestries Reported - Arab (%)
Ancestries Reported - Czech (%)
Ancestries Reported - Danish (%)
Ancestries Reported - Dutch (%)
Ancestries Reported - English (%)
Ancestries Reported - French (%)
Ancestries Reported - French Canadian (%)
Ancestries Reported - German (%)
Ancestries Reported - Greek (%)
Ancestries Reported - Hungarian (%)
Ancestries Reported - Irish (%)
Ancestries Reported - Italian (%)
Ancestries Reported - Lithuanian (%)
Ancestries Reported - Norwegian (%)
Ancestries Reported - Polish (%)
Ancestries Reported - Portuguese (%)
Ancestries Reported - Russian (%)
Ancestries Reported - Scotch-Irish (%)
Ancestries Reported - Scottish (%)
Ancestries Reported - Slovak (%)
Ancestries Reported - Subsaharan African (%)
Ancestries Reported - Swedish (%)
Ancestries Reported - Swiss (%)
Ancestries Reported - Ukrainian (%)
Ancestries Reported - United States (%)
Ancestries Reported - Welsh (%)
Ancestries Reported - West Indian (%)
Ancestries Reported - Other (%)
Geographical mobility - Same house 1 year ago (%)
Geographical mobility - Same house 1 year ago (%) - White
Geographical mobility - Same house 1 year ago (%) - Black or African American
Geographical mobility - Same house 1 year ago (%) - Asian
Geographical mobility - Same house 1 year ago (%) - Hispanic or Latino
Geographical mobility - Same house 1 year ago (%) - American Indian and Alaska Native
Geographical mobility - Same house 1 year ago (%) - Multirace
Geographical mobility - Same house 1 year ago (%) - Other Race
Geographical mobility - Moved within same county (%)
Geographical mobility - Moved within same county (%) - White
Geographical mobility - Moved within same county (%) - Black or African American
Geographical mobility - Moved within same county (%) - Asian
Geographical mobility - Moved within same county (%) - Hispanic or Latino
Geographical mobility - Moved within same county (%) - American Indian and Alaska Native
Geographical mobility - Moved within same county (%) - Multirace
Geographical mobility - Moved within same county (%) - Other Race
Geographical mobility - Moved from different county within same state (%)
Geographical mobility - Moved from different county within same state (%) - White
Geographical mobility - Moved from different county within same state (%) - Black or African American
Geographical mobility - Moved from different county within same state (%) - Asian
Geographical mobility - Moved from different county within same state (%) - Hispanic or Latino
Geographical mobility - Moved from different county within same state (%) - American Indian and Alaska Native
Geographical mobility - Moved from different county within same state (%) - Multirace
Geographical mobility - Moved from different county within same state (%) - Other Race
Geographical mobility - Moved from different state (%)
Geographical mobility - Moved from different state (%) - White
Geographical mobility - Moved from different state (%) - Black or African American
Geographical mobility - Moved from different state (%) - Asian
Geographical mobility - Moved from different state (%) - Hispanic or Latino
Geographical mobility - Moved from different state (%) - American Indian and Alaska Native
Geographical mobility - Moved from different state (%) - Multirace
Geographical mobility - Moved from different state (%) - Other Race
Geographical mobility - Moved from abroad (%)
Geographical mobility - Moved from abroad (%) - White
Geographical mobility - Moved from abroad (%) - Black or African American
Geographical mobility - Moved from abroad (%) - Asian
Geographical mobility - Moved from abroad (%) - Hispanic or Latino
Geographical mobility - Moved from abroad (%) - American Indian and Alaska Native
Geographical mobility - Moved from abroad (%) - Multirace
Geographical mobility - Moved from abroad (%) - Other Race
Place of birth for the foreign-born population - Ireland (%)
Place of birth for the foreign-born population - Denmark (%)
Place of birth for the foreign-born population - Norway (%)
Place of birth for the foreign-born population - Sweden (%)
Place of birth for the foreign-born population - United Kingdom (%)
Place of birth for the foreign-born population - England (%)
Place of birth for the foreign-born population - Scotland (%)
Place of birth for the foreign-born population - Other Northern Europe (%)
Place of birth for the foreign-born population - Austria (%)
Place of birth for the foreign-born population - Belgium (%)
Place of birth for the foreign-born population - France (%)
Place of birth for the foreign-born population - Germany (%)
Place of birth for the foreign-born population - Netherlands (%)
Place of birth for the foreign-born population - Switzerland (%)
Place of birth for the foreign-born population - Other Western Europe (%)
Place of birth for the foreign-born population - Greece (%)
Place of birth for the foreign-born population - Italy (%)
Place of birth for the foreign-born population - Portugal (%)
Place of birth for the foreign-born population - Spain (%)
Place of birth for the foreign-born population - Other Southern Europe (%)
Place of birth for the foreign-born population - Albania (%)
Place of birth for the foreign-born population - Belarus (%)
Place of birth for the foreign-born population - Bosnia and Herzegovina (%)
Place of birth for the foreign-born population - Bulgaria (%)
Place of birth for the foreign-born population - Croatia (%)
Place of birth for the foreign-born population - Czechoslovakia (%)
Place of birth for the foreign-born population - Hungary (%)
Place of birth for the foreign-born population - Latvia (%)
Place of birth for the foreign-born population - Lithuania (%)
Place of birth for the foreign-born population - North Macedonia (Macedonia) (%)
Place of birth for the foreign-born population - Moldova (%)
Place of birth for the foreign-born population - Poland (%)
Place of birth for the foreign-born population - Romania (%)
Place of birth for the foreign-born population - Russia (%)
Place of birth for the foreign-born population - Serbia (%)
Place of birth for the foreign-born population - Ukraine (%)
Place of birth for the foreign-born population - Other Eastern Europe (%)
Place of birth for the foreign-born population - China (%)
Place of birth for the foreign-born population - Hong Kong (%)
Place of birth for the foreign-born population - Taiwan (%)
Place of birth for the foreign-born population - Japan (%)
Place of birth for the foreign-born population - Korea (%)
Place of birth for the foreign-born population - Other Eastern Asia (%)
Place of birth for the foreign-born population - Afghanistan (%)
Place of birth for the foreign-born population - Bangladesh (%)
Place of birth for the foreign-born population - India (%)
Place of birth for the foreign-born population - Iran (%)
Place of birth for the foreign-born population - Kazakhstan (%)
Place of birth for the foreign-born population - Nepal (%)
Place of birth for the foreign-born population - Pakistan (%)
Place of birth for the foreign-born population - Sri Lanka (%)
Place of birth for the foreign-born population - Uzbekistan (%)
Place of birth for the foreign-born population - Other South Central Asia (%)
Place of birth for the foreign-born population - Burma (%)
Place of birth for the foreign-born population - Cambodia (%)
Place of birth for the foreign-born population - Indonesia (%)
Place of birth for the foreign-born population - Laos (%)
Place of birth for the foreign-born population - Malaysia (%)
Place of birth for the foreign-born population - Philippines (%)
Place of birth for the foreign-born population - Singapore (%)
Place of birth for the foreign-born population - Thailand (%)
Place of birth for the foreign-born population - Vietnam (%)
Place of birth for the foreign-born population - Other South Eastern Asia (%)
Place of birth for the foreign-born population - Armenia (%)
Place of birth for the foreign-born population - Iraq (%)
Place of birth for the foreign-born population - Israel (%)
Place of birth for the foreign-born population - Jordan (%)
Place of birth for the foreign-born population - Kuwait (%)
Place of birth for the foreign-born population - Lebanon (%)
Place of birth for the foreign-born population - Saudi Arabia (%)
Place of birth for the foreign-born population - Syria (%)
Place of birth for the foreign-born population - Turkey (%)
Place of birth for the foreign-born population - Yemen (%)
Place of birth for the foreign-born population - Other Western Asia (%)
Place of birth for the foreign-born population - Eritrea (%)
Place of birth for the foreign-born population - Ethiopia (%)
Place of birth for the foreign-born population - Kenya (%)
Place of birth for the foreign-born population - Somalia (%)
Place of birth for the foreign-born population - Uganda (%)
Place of birth for the foreign-born population - Zimbabwe (%)
Place of birth for the foreign-born population - Other Eastern Africa (%)
Place of birth for the foreign-born population - Cameroon (%)
Place of birth for the foreign-born population - Congo (%)
Place of birth for the foreign-born population - Democratic Republic of Congo (Zaire) (%)
Place of birth for the foreign-born population - Other Middle Africa (%)
Place of birth for the foreign-born population - Egypt (%)
Place of birth for the foreign-born population - Morocco (%)
Place of birth for the foreign-born population - Sudan (%)
Place of birth for the foreign-born population - Other Northern Africa (%)
Place of birth for the foreign-born population - South Africa (%)
Place of birth for the foreign-born population - Other Southern Africa (%)
Place of birth for the foreign-born population - Cabo Verde (%)
Place of birth for the foreign-born population - Ghana (%)
Place of birth for the foreign-born population - Liberia (%)
Place of birth for the foreign-born population - Nigeria (%)
Place of birth for the foreign-born population - Senegal (%)
Place of birth for the foreign-born population - Sierra Leone (%)
Place of birth for the foreign-born population - Other Western Africa (%)
Place of birth for the foreign-born population - Australia (%)
Place of birth for the foreign-born population - New Zealand (%)
Place of birth for the foreign-born population - Fiji (%)
Place of birth for the foreign-born population - Micronesia (%)
Place of birth for the foreign-born population - Bahamas (%)
Place of birth for the foreign-born population - Barbados (%)
Place of birth for the foreign-born population - Cuba (%)
Place of birth for the foreign-born population - Dominica (%)
Place of birth for the foreign-born population - Dominican Republic (%)
Place of birth for the foreign-born population - Grenada (%)
Place of birth for the foreign-born population - Haiti (%)
Place of birth for the foreign-born population - Jamaica (%)
Place of birth for the foreign-born population - St. Vincent and the Grenadines (%)
Place of birth for the foreign-born population - Trinidad and Tobago (%)
Place of birth for the foreign-born population - West Indies (%)
Place of birth for the foreign-born population - Other Caribbean (%)
Place of birth for the foreign-born population - Belize (%)
Place of birth for the foreign-born population - Costa Rica (%)
Place of birth for the foreign-born population - El Salvador (%)
Place of birth for the foreign-born population - Guatemala (%)
Place of birth for the foreign-born population - Honduras (%)
Place of birth for the foreign-born population - Mexico (%)
Place of birth for the foreign-born population - Nicaragua (%)
Place of birth for the foreign-born population - Panama (%)
Place of birth for the foreign-born population - Other Central America (%)
Place of birth for the foreign-born population - Argentina (%)
Place of birth for the foreign-born population - Bolivia (%)
Place of birth for the foreign-born population - Brazil (%)
Place of birth for the foreign-born population - Chile (%)
Place of birth for the foreign-born population - Colombia (%)
Place of birth for the foreign-born population - Ecuador (%)
Place of birth for the foreign-born population - Guyana (%)
Place of birth for the foreign-born population - Peru (%)
Place of birth for the foreign-born population - Uruguay (%)
Place of birth for the foreign-born population - Venezuela (%)
Place of birth for the foreign-born population - Other South America (%)
Place of birth for the foreign-born population - Canada (%)
Place of birth for the foreign-born population - Other Northern America (%)
Place of birth for the foreign-born population - Other (%)
Latest news about races in Miami, FL collected exclusively by city-data.com from local newspapers, TV, and radio stations
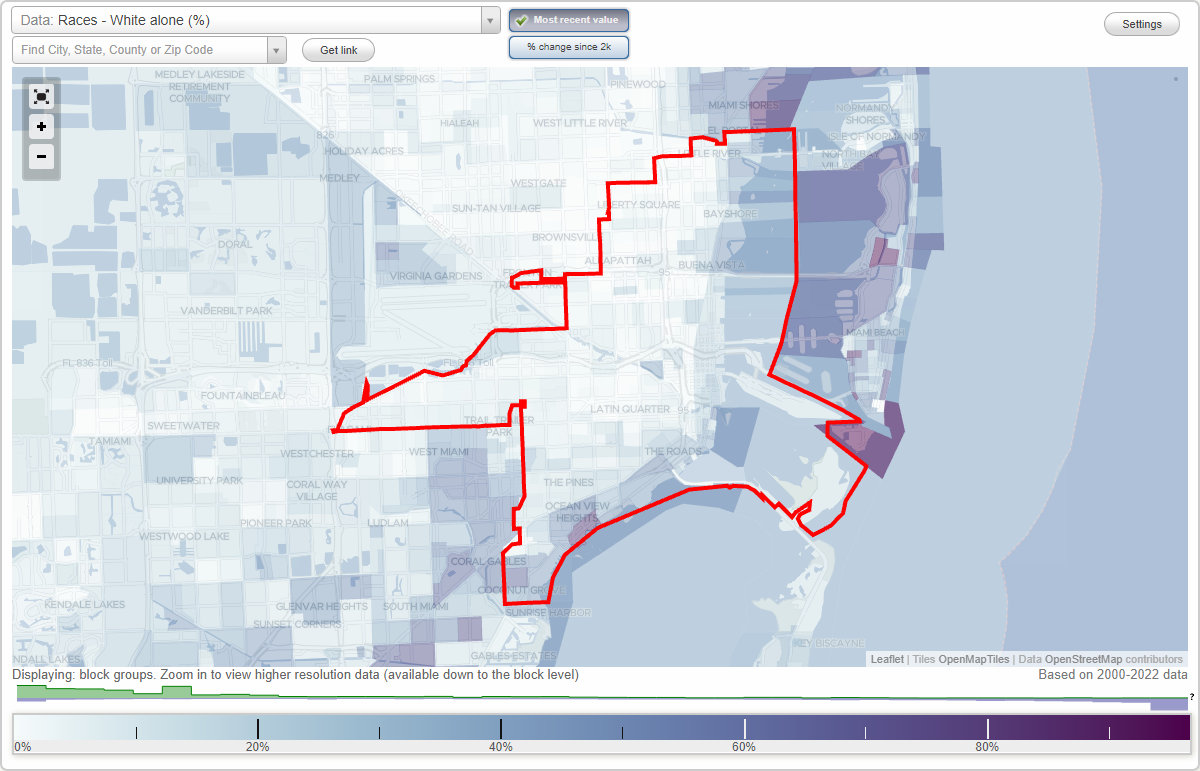
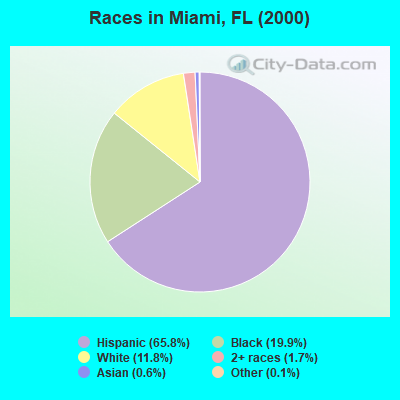
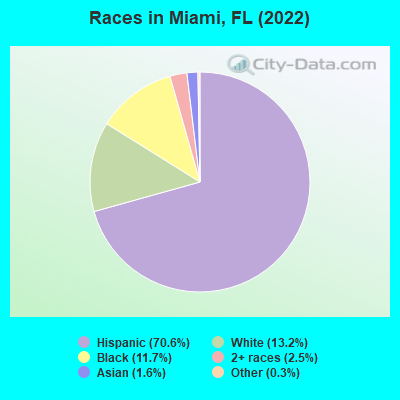
According to 2022 data, the most numerous races in Miami, FL are White alone (59,184 residents), Hispanic (317,370 residents), and Black alone (52,407 residents). 24.1% of Miami residents speak English at home. 58.2% of Miami, FL residents are foreign-born (53.9% born in Latin America), which is 63.9% greater than the foreign-born rate of 21.0% across the entire state of Florida.
Race distribution in Miami
2000 2022
238,351 65.8% Hispanic 72,190 19.9% Black alone 42,897 11.8% White alone 6,102 1.7% Two or more races 2,181 0.6% Asian alone 388 0.1% Other race alone 291 0.08% American Indian alone 70 0.02% Native Hawaiian and Other
317,370 70.6% Hispanic 59,184 13.2% White alone 52,407 11.7% Black alone 11,311 2.5% Two or more races 7,199 1.6% Asian alone 1,484 0.3% Other race alone 374 0.08% American Indian alone 155 0.03% Native Hawaiian and Other
2000 2022
10,458,509 65.4% White alone 2,682,715 16.8% Hispanic 2,264,268 14.2% Black alone 261,693 1.6% Asian alone 236,954 1.5% Two or more races 42,358 0.3% American Indian alone 28,994 0.2% Other race alone 6,887 0.04% Native Hawaiian and Other
11,309,403 50.8% White alone 6,025,039 27.1% Hispanic 3,241,015 14.6% Black alone 861,630 3.9% Two or more races 623,692 2.8% Asian alone 152,054 0.7% Other race alone 22,504 0.1% American Indian alone 9,486 0.04% Native Hawaiian and Other
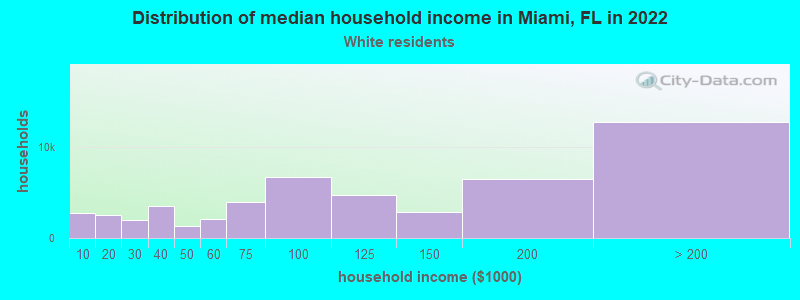
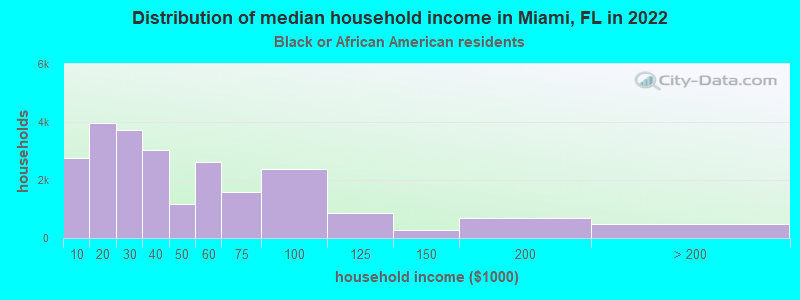
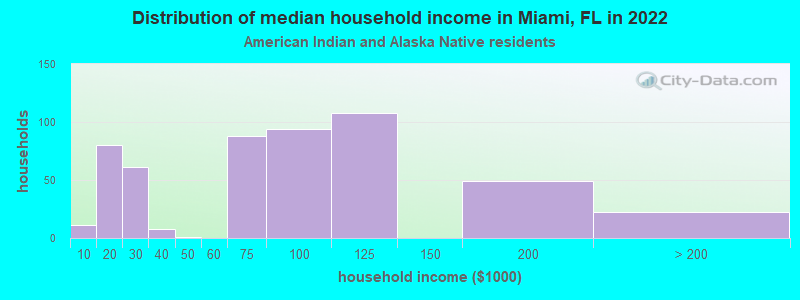
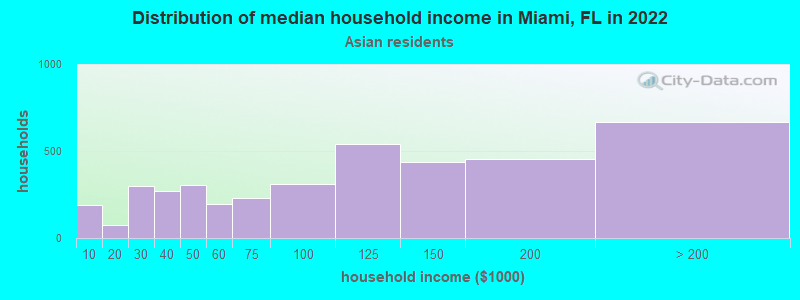
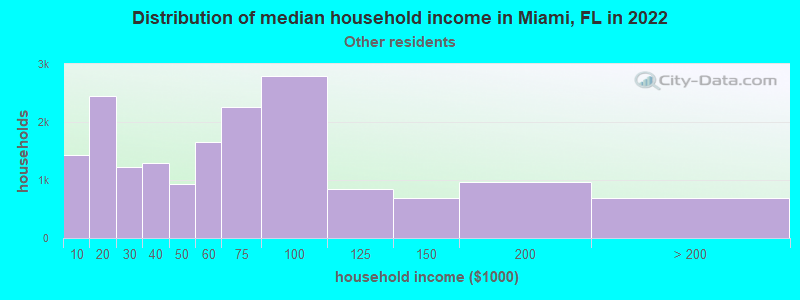
Income and house value in Miami Median household income in 2022 $138,294 White non-Hispanic householders$32,212 Black householders$73,727 American Indian and Alaska Native householders$101,629 Asian householders$55,406 Some other race householders$52,439 Two or more races householders$54,344 Hispanic or Latino race householdersMedian 2022 house value $834,229 White Non-Hispanic householders$318,415 Black or African American householders$317,494 American Indian or Alaska Native householders $780,393 Asian householders$437,130 Native Hawaiian and other Pacific Islander householders$525,016 Some other race householders$483,604 Two or more races householders$570,570 Hispanic or Latino householders
Median age by race in Miami
37.3 Median age for White residents37.6 37.1 38.6 Median age for Black or African American residents36.3 41.6 31.5 Median age for American Indian / Alaska Native residents33.6 28.2 39.9 Median age for Asian residents40.8 36.1 -666,666,666.0 Median age for Native Hawaiian / Pacific Islander residents-666,666,666.0 -666,666,666.0 39.1 Median age for Other race residents37.2 42.1 42.8 Median age for Two or more races residents39.6 46.0 34.9 Median age for White alone residents35.5 34.6 42.3 Median age for Hispanic or Latino residents40.2 44.5
Owner/renter occupied households by race in Miami
House owners and renters - White residents 21,064 40.8% Owner occupied30,503 59.2% Renter occupiedHouse owners and renters - Black or African American residents 3,989 16.9% Owner occupied19,587 83.1% Renter occupiedHouse owners and renters - American Indian / Alaska Native residents 180 18.6% Owner occupied790 81.4% Renter occupiedHouse owners and renters - Asian residents 1,936 43.8% Owner occupied2,483 56.2% Renter occupiedHouse owners and renters - Other race residents 4,104 23.8% Owner occupied13,133 76.2% Renter occupiedHouse owners and renters - Two or more races residents 29,184 28.7% Owner occupied72,625 71.3% Renter occupiedHouse owners and renters - White alone residents 13,464 41.8% Owner occupied18,775 58.2% Renter occupiedHouse owners and renters - Hispanic or Latino residents 39,267 29.0% Owner occupied96,364 71.0% Renter occupied
Language usage in Miami
English speakers - Total 24.1% of residents of Miami speak English at home.
67.6% of residents speak Spanish at home 137,823 47.7% Speak English very well151,126 52.3% Speak English less than very well8.3% of residents speak other language at home 23,934 67.6% Speak English very well11,488 32.4% Speak English less than very well
English speakers - Born in the United States 76.2% of residents of Miami speak English at home.
18.4% of residents speak Spanish at home 8,051 84.0% Speak English very well1,534 16.0% Speak English less than very well5.3% of residents speak other language at home 1,911 69.1% Speak English very well854 30.9% Speak English less than very well
English speakers - Native, born elsewhere 23.1% of residents of Miami speak English at home.
67.3% of residents speak Spanish at home 8,811 78.9% Speak English very well2,350 21.1% Speak English less than very well9.6% of residents speak other language at home 919 57.9% Speak English very well668 42.1% Speak English less than very well
English speakers - Foreign-born 6.2% of residents of Miami speak English at home.
83.3% of residents speak Spanish at home 72,828 33.9% Speak English very well142,272 66.1% Speak English less than very well10.6% of residents speak other language at home 17,428 63.9% Speak English very well9,827 36.1% Speak English less than very well
White (Caucasian) - Speak only English Native:
63.2% (36,717)Foreign-born:
11.8% (5,235)
White (Caucasian) - Speak another language Native:
36.8% (21,403)Foreign-born:
88.2% (39,245)
Black or African American - Speak only English Native:
90.4% (34,833)Foreign-born:
18.6% (2,595)
Black or African American - Speak another language Native:
9.6% (3,713)Foreign-born:
81.4% (11,367)
American Indian / Alaska Native - Speak only English Native:
44.4% (358)Foreign-born:
9.6% (113)
American Indian / Alaska Native - Speak another language Native:
50.9% (411)Foreign-born:
91.7% (1,082)
Asian - Speak only English Native:
72.6% (2,552)Foreign-born:
6.3% (297)
Asian - Speak another language Native:
27.4% (964)Foreign-born:
93.7% (4,410)
Other race - Speak only English Native:
15.2% (1,932)Foreign-born:
3.9% (1,186)
Other race - Speak another language Native:
84.8% (10,739)Foreign-born:
96.1% (29,170)
Two or more races - Speak only English Native:
19.1% (10,535)Foreign-born:
3.9% (6,413)
Two or more races - Speak another language Native:
80.9% (44,572)Foreign-born:
96.1% (156,916)
White alone - Speak only English Native:
81.4% (32,810)Foreign-born:
24.6% (3,822)
White alone - Speak another language Native:
18.6% (7,482)Foreign-born:
75.4% (11,737)
Hispanic or Latino - Speak only English Native:
16.0% (13,187)Foreign-born:
3.9% (8,549)
Hispanic or Latino - Speak another language Native:
84.0% (69,043)Foreign-born:
96.1% (211,730)
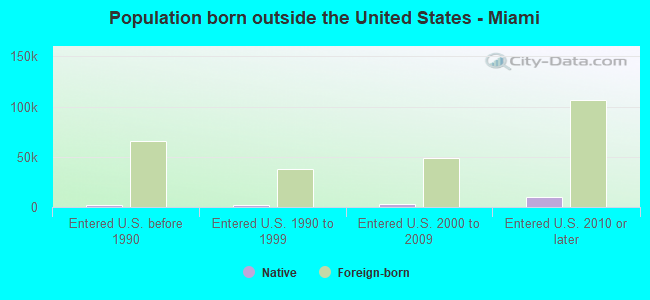
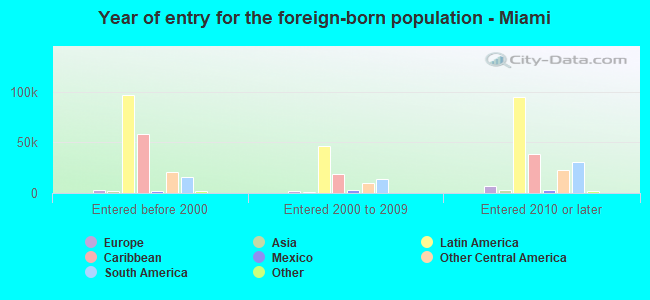
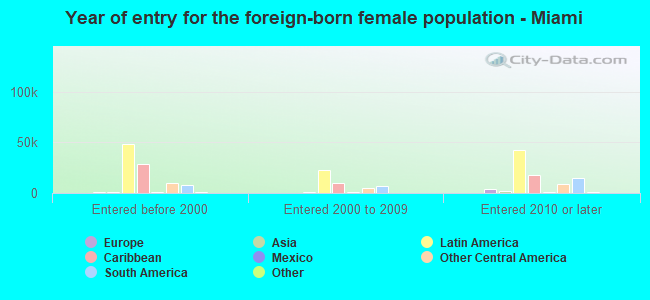
Foreign-born residents in Miami 256,610 residents are foreign born (53.9% Latin America ).
This city:
58.2%Florida:
21.1%
Marital status for residents in Miami Marital status - White (Caucasian) population 15 years and over
Males 45.4% Never married39.7% Now married1.8% Separated3.0% Widowed10.1% DivorcedFemales 37.0% Never married39.7% Now married0.3% Separated9.2% Widowed13.7% DivorcedWomen who gave birth in the past 12 months Now married:
77.7% (620)Unmarried:
22.3% (178)
Women who did not give birth in the past 12 months Now married:
39.7% (10,344)Unmarried:
60.3% (15,710)
Marital status - Black or African American population 15 years and over
Males 59.4% Never married21.7% Now married2.8% Separated5.9% Widowed10.1% DivorcedFemales 53.9% Never married18.4% Now married3.3% Separated10.0% Widowed14.5% DivorcedWomen who gave birth in the past 12 months Now married:
13.1% (102)Unmarried:
86.9% (677)
Women who did not give birth in the past 12 months Now married:
17.9% (2,287)Unmarried:
82.1% (10,474)
Marital status - American Indian / Alaska Native population 15 years and over
Males 32.6% Never married51.4% Now married4.7% Separated6.6% Widowed4.7% DivorcedFemales 29.5% Never married48.0% Now married13.1% Separated0.0% Widowed9.4% DivorcedWomen who gave birth in the past 12 months Now married:
100.0% (100)Unmarried:
0.0% (0)
Women who did not give birth in the past 12 months Now married:
47.6% (234)Unmarried:
52.4% (258)
Marital status - Asian population 15 years and over
Males 44.4% Never married43.2% Now married0.0% Separated2.7% Widowed9.7% DivorcedFemales 46.9% Never married39.6% Now married0.0% Separated10.2% Widowed3.4% DivorcedWomen who gave birth in the past 12 months Now married:
35.4% (59)Unmarried:
64.6% (108)
Women who did not give birth in the past 12 months Now married:
30.7% (827)Unmarried:
69.3% (1,870)
Marital status - Native Hawaiian / Pacific Islander population 15 years and over
Males 100.0% Never married0.0% Now married0.0% Separated0.0% Widowed0.0% DivorcedFemales 0.0% Never married100.0% Now married0.0% Separated0.0% Widowed0.0% DivorcedWomen who did not give birth in the past 12 months Now married:
100.0% (10)Unmarried:
0.0% (0)
Marital status - Other race population 15 years and over
Males 49.7% Never married31.2% Now married4.8% Separated2.1% Widowed12.2% DivorcedFemales 37.7% Never married34.8% Now married5.2% Separated5.8% Widowed16.5% DivorcedWomen who gave birth in the past 12 months Now married:
50.9% (233)Unmarried:
49.1% (225)
Women who did not give birth in the past 12 months Now married:
36.5% (4,552)Unmarried:
63.5% (7,927)
Marital status - Two or more races population 15 years and over
Males 47.0% Never married36.7% Now married2.9% Separated1.8% Widowed11.6% DivorcedFemales 33.4% Never married35.5% Now married4.2% Separated9.7% Widowed17.3% DivorcedWomen who gave birth in the past 12 months Now married:
36.4% (852)Unmarried:
63.6% (1,491)
Women who did not give birth in the past 12 months Now married:
36.0% (16,921)Unmarried:
64.0% (30,079)
Marital status - White alone, not Hispanic / Latino population 15 years and over
Males 48.7% Never married38.3% Now married1.0% Separated2.1% Widowed9.9% DivorcedFemales 37.7% Never married46.2% Now married0.0% Separated5.1% Widowed11.0% DivorcedWomen who gave birth in the past 12 months Now married:
94.9% (620)Unmarried:
5.1% (33)
Women who did not give birth in the past 12 months Now married:
41.2% (5,828)Unmarried:
58.8% (8,310)
Marital status - Hispanic or Latino population 15 years and over
Males 46.0% Never married37.0% Now married3.2% Separated2.2% Widowed11.5% DivorcedFemales 34.2% Never married35.6% Now married3.9% Separated9.9% Widowed16.4% DivorcedWomen who gave birth in the past 12 months Now married:
41.9% (1,310)Unmarried:
58.1% (1,816)
Women who did not give birth in the past 12 months Now married:
36.9% (25,364)Unmarried:
63.1% (43,408)
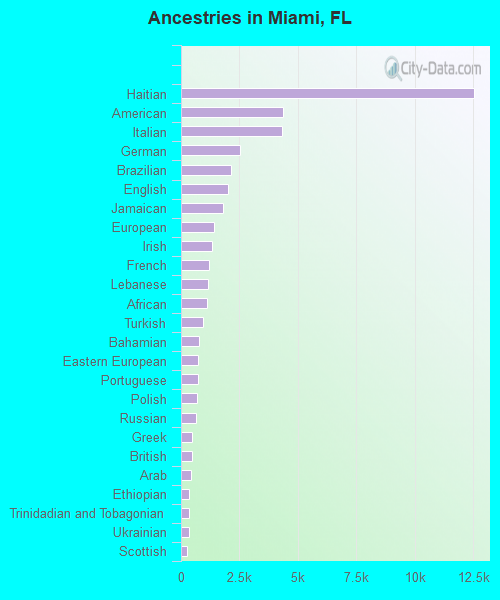
Ancestries in Miami
12,538 4.0% Haitian4,350 1.4% American4,315 1.4% Italian2,533 0.8% German2,139 0.7% Brazilian2,003 0.6% English1,807 0.6% Jamaican1,393 0.4% European1,318 0.4% Irish1,190 0.4% French1,133 0.4% Lebanese1,113 0.4% African925 0.3% Turkish769 0.2% Bahamian719 0.2% Eastern European714 0.2% Portuguese699 0.2% Polish626 0.2% Russian459 0.1% Greek455 0.1% British415 0.1% Arab363 0.1% Ethiopian356 0.1% Trinidadian and Tobagonian355 0.1% Ukrainian246 0.08% Scottish217 0.07% West Indian208 0.07% Latvian206 0.07% French Canadian205 0.07% Armenian201 0.06% Swedish200 0.06% Syrian194 0.06% Canadian190 0.06% Moroccan187 0.06% Israeli173 0.06% Austrian142 0.05% Iranian138 0.04% Bulgarian137 0.04% British West Indian131 0.04% Romanian117 0.04% Egyptian116 0.04% Dutch110 0.04% Guyanese106 0.03% Belgian100 0.03% Barbadian99 0.03% Danish97 0.03% Hungarian95 0.03% Iraqi85 0.03% Norwegian84 0.03% Basque84 0.03% Estonian80 0.03% Sudanese78 0.02% Lithuanian74 0.02% Swiss62 0.02% Czech55 0.02% Macedonian55 0.02% Serbian52 0.02% Albanian47 0.02% Slovak42 0.01% Palestinian40 0.01% Northern European37 0.01% U.S. Virgin Islander36 0.01% Scotch-Irish33 0.01% Scandinavian30 0.01% Croatian27 0.01% Bermudan25 0.01% Welsh25 0.01% Australian23 0.01% Jordanian16 0.01% South African
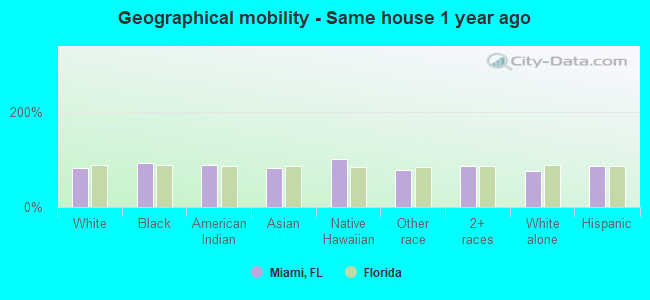
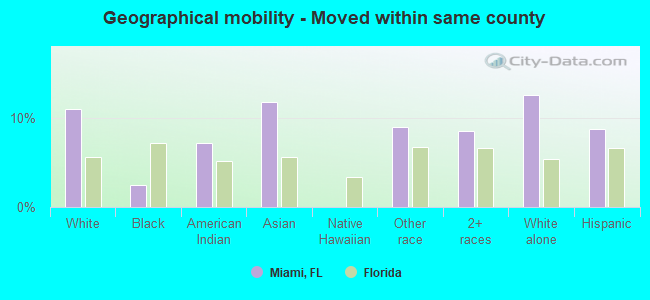
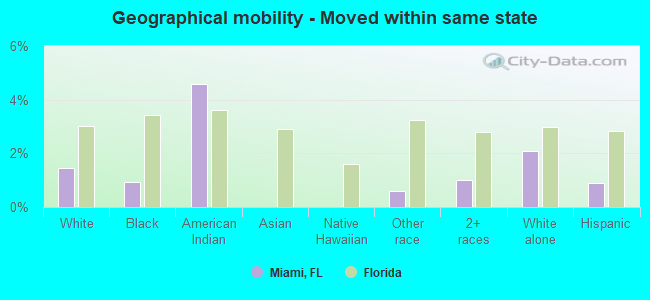
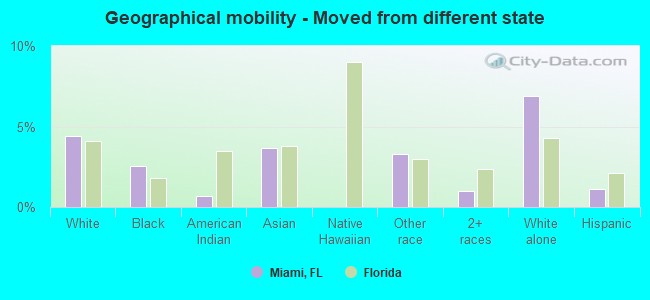
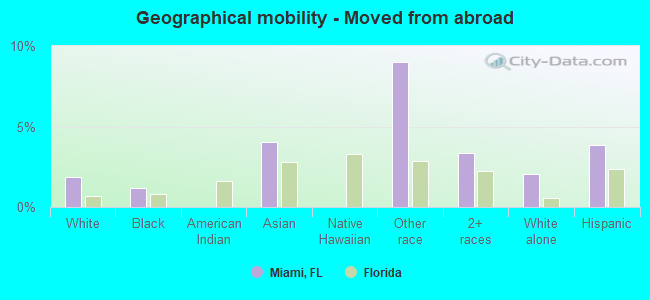
Geographical mobility in Miami Same house 1 year ago 86,533 81.3% White (Caucasian)51,357 92.9% Black or African American1,908 87.2% American Indian / Alaska Native6,657 80.5% Asian41 100.0% Native Hawaiian / Pacific Islander34,697 78.2% Other race196,152 86.1% Two or more races44,305 76.4% White alone, not Hispanic / Latino268,966 85.4% Hispanic or LatinoMoved within same county 11,656 11.0% White / Caucasian1,377 2.5% Black or African American157 7.2% American Indian / Alaska Native974 11.8% Asian3,963 8.9% Other race19,450 8.5% Two or more races7,296 12.6% White alone, not Hispanic / Latino27,298 8.7% Hispanic or LatinoMoved within same state 1,541 1.4% White / Caucasian507 0.9% Black or African American100 4.6% American Indian / Alaska Native257 0.6% Other race2,305 1.0% Two or more races1,207 2.1% White alone, not Hispanic / Latino2,804 0.9% Hispanic or LatinoMoved from different state 4,702 4.4% White / Caucasian1,398 2.5% Black or African American16 0.7% American Indian / Alaska Native303 3.7% Asian1,455 3.3% Other race2,261 1.0% Two or more races4,016 6.9% White alone, not Hispanic / Latino3,606 1.1% Hispanic or LatinoMoved from abroad 1,984 1.9% White656 1.2% Black or African American332 4.0% Asian3,989 9.0% Other race7,714 3.4% Two or more races1,193 2.1% White alone, not Hispanic / Latino12,117 3.8% Hispanic or Latino
Children Nativity (place of birth) in Miami
Children under 6 years - Living with two parents Both parents native 1,684 100.0% NativeBoth parents foreign-born 5,569 87.5% Native796 12.5% Foreign-bornOne native, one foreign-born parent 3,815 100.0% NativeChildren under 6 years - Living with one parent Native parent 3,805 100.0% NativeForeign-born parent 6,572 84.2% Native1,229 15.8% Foreign-bornChildren 6 to 17 years - Living with two parents Both parents native 3,497 100.0% NativeBoth parents foreign-born 7,940 76.7% Native2,410 23.3% Foreign-bornOne native, one foreign-born parent 3,643 92.1% Native312 7.9% Foreign-bornChildren 6 to 17 years - Living with one parent Native parent 3,220 100.0% NativeForeign-born parent 15,085 60.7% Native9,778 39.3% Foreign-born
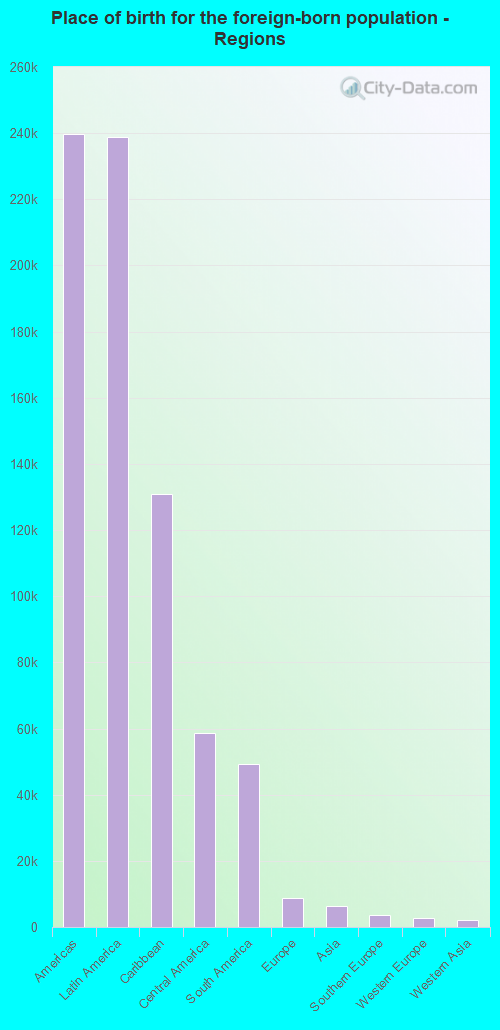
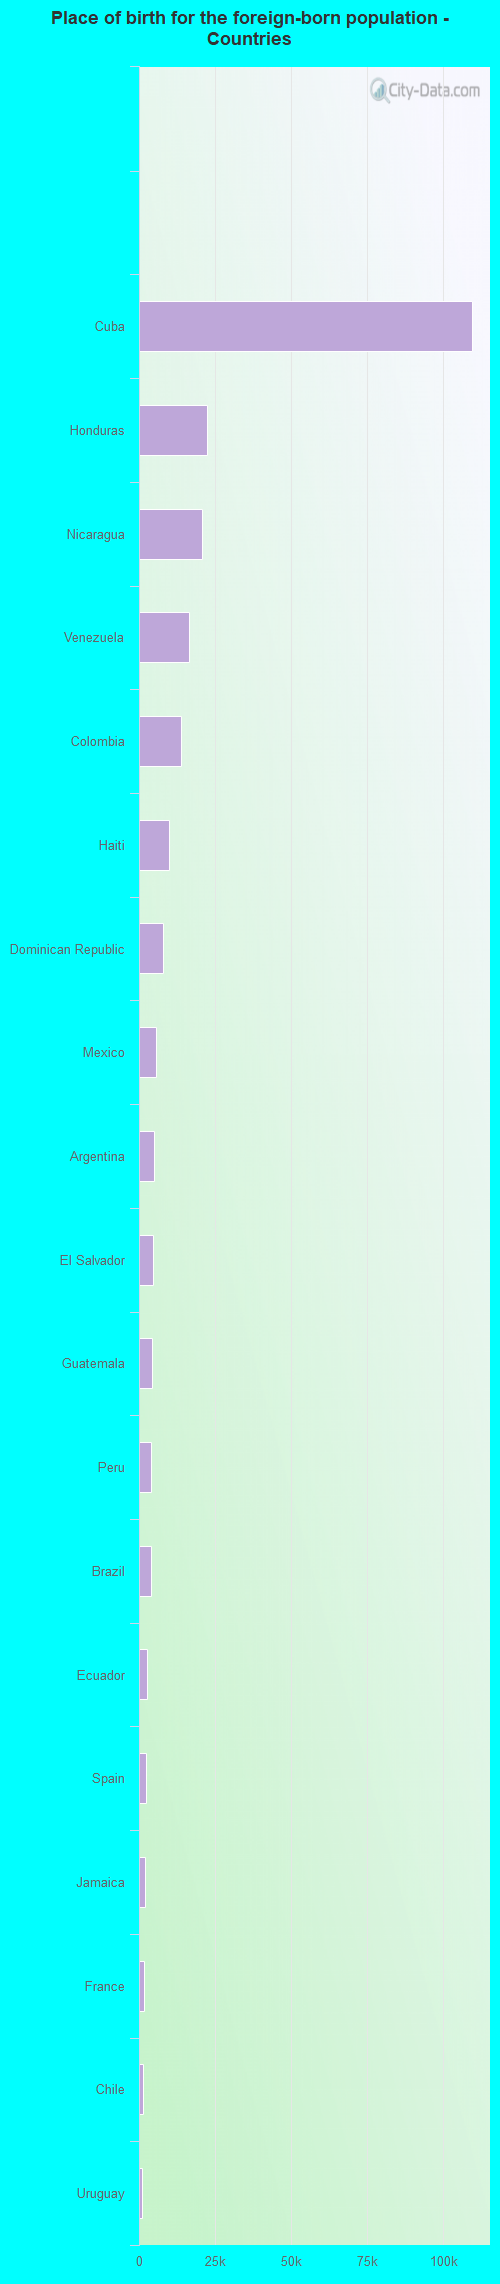
Place of birth for residents in Miami 239,754 Americas238,904 Latin America130,805 Caribbean58,771 Central America49,327 South America8,911 Europe6,261 Asia3,639 Southern Europe2,728 Western Europe2,226 Western Asia1,966 Eastern Europe1,789 South Central Asia1,496 Africa1,243 Eastern Asia918 China899 South Eastern Asia849 Northern America633 Northern Africa544 Northern Europe276 Eastern Africa243 Middle Africa186 Oceania167 Australia and New Zealand Subregion153 Southern Africa114 Western Africa109,502 Cuba22,212 Honduras20,698 Nicaragua16,524 Venezuela13,812 Colombia9,796 Haiti7,933 Dominican Republic5,489 Mexico4,811 Argentina4,514 El Salvador4,212 Guatemala3,897 Peru3,845 Brazil2,582 Ecuador2,283 Spain2,038 Jamaica1,492 France1,333 Chile1,103 Uruguay977 Italy934 India899 Panama807 China796 Canada784 Bolivia718 Costa Rica707 Russia628 Germany555 Turkey438 Saudi Arabia436 Israel415 Bahamas388 Pakistan330 Lebanon318 Trinidad and Tobago315 United Kingdom269 Philippines260 Poland240 Bangladesh237 Korea232 Switzerland232 Portugal231 Thailand230 Belgium206 Morocco200 Syria189 Malaysia167 Australia160 Egypt153 South Africa149 Ukraine136 Greece130 Vietnam123 Grenada111 Belarus107 Czechoslovakia104 St. Lucia103 Sudan100 England96 Iran96 Ethiopia93 Democratic Republic of Congo (Zaire)90 Cameroon86 Japan74 Algeria71 Netherlands71 Austria69 Bulgaria69 Guyana69 Hungary64 Armenia62 United Arab Emirates57 Moldova55 Hong Kong54 Taiwan52 Iraq51 Kenya50 Dominica49 Sri Lanka45 Nigeria43 Latvia42 Cambodia42 Serbia42 Sweden40 Lithuania37 Albania37 Kuwait32 Georgia29 Ivory Coast28 Ireland27 Romania27 Norway27 Laos25 Belize21 Kazakhstan20 West Indies14 Scotland12 Denmark11 Somalia11 Uzbekistan9 Tanzania8 Senegal7 Bosnia and Herzegovina7 Croatia5 St. Vincent and the Grenadines5 Indonesia1 Afghanistan
Grandparents responsible for own grandchildren in Miami
Grandparents (30 to 59 years) White / Caucasian 254 24.8% Responsible for grandchildren771 75.2% Not responsible for grandchildrenBlack or African American 449 69.1% Responsible for grandchildren201 30.9% Not responsible for grandchildrenAsian 45 100.0% Not responsible for grandchildrenOther race 66 15.2% Responsible for grandchildren367 84.8% Not responsible for grandchildrenTwo or more races 1,070 42.7% Responsible for grandchildren1,438 57.3% Not responsible for grandchildrenWhite alone, not Hispanic / Latino 20 100.0% Not responsible for grandchildrenHispanic or Latino 1,070 32.9% Responsible for grandchildren2,181 67.1% Not responsible for grandchildrenGrandparents (60 years and over) White / Caucasian 260 14.1% Responsible for grandchildren1,584 85.9% Not responsible for grandchildrenBlack or African American 245 28.1% Responsible for grandchildren626 71.9% Not responsible for grandchildrenAsian 14 14.6% Responsible for grandchildren84 85.4% Not responsible for grandchildrenOther race 31 8.1% Responsible for grandchildren351 91.9% Not responsible for grandchildrenTwo or more races 1,580 50.4% Responsible for grandchildren1,552 49.6% Not responsible for grandchildrenWhite alone, not Hispanic / Latino 49 52.3% Responsible for grandchildren45 47.7% Not responsible for grandchildrenHispanic or Latino 1,321 34.0% Responsible for grandchildren2,568 66.0% Not responsible for grandchildren
Zip codes: 33101, 33125 , 33127 , 33128 , 33129 , 33130 , 33131 , 33132 , 33136 , 33137 , 33139 , 33145 .