Lyndon, VT (Vermont) Houses and Residents
| Lyndon: | $220,113 |
| Vermont: | $304,700 |
Total population: 5,981 (Urban population: 2,624 (all inside urban clusters), Rural population: 2,824 (59 farm, 2,765 nonfarm))
Houses: 2,190 (2,031 occupied: 1,390 owner occupied, 641 renter occupied)
| % of renters here: | 32% |
| State: | 26% |
Housing density: 55 houses/condos per square mile
Median price asked for vacant for-sale houses and condos in 2022 in this county: $159,343.
Median contract rent in 2022: $767 (lower quartile is $649, upper quartile is $930)
Median rent asked for vacant for-rent units in 2022: $801
Median gross rent in Lyndon, VT in 2022: $901
Housing units in Lyndon with a mortgage: 523 (18 second mortgage, 73 home equity loan, 0 both second mortgage and home equity loan)
Houses without a mortgage: 227


Latest news about housing in Lyndon, VT collected exclusively by city-data.com from local newspapers, TV, and radio stations

 | Depopulation (64 replies) |
| Moving to St. Johnsbury.... (17 replies) |
| More Vermont impressions (94 replies) |
| St.Johnsbury Vibe? (14 replies) |
| Lyndonville (34 replies) |
| Cold, unwelcoming Vermonters (78 replies) |

Household type by relationship:
Households: 29,882- In family households: 24,304 (5,718 male householders, 2,435 female householders)
6,242 spouses, 7,877 children (7,169 natural, 292 adopted, 416 stepchildren), 435 grandchildren, 110 brothers or sisters, 163 parents, foster children, 169 other relatives, 1,023 non-relatives
- In nonfamily households: 5,578 (2,069 male householders (1,528 living alone)), 2,331 female householders (1,918 living alone)), 1,178 nonrelatives
- In group quarters: 1,345 (406 institutionalized population)
5,110 married couples with children.
1,898 single-parent households (457 men, 1,441 women).
96.1% of residents of Lyndon speak English at home.
0.8% of residents speak Spanish at home (77% speak English very well, 13% speak English well, 10% speak English not well).
2.4% of residents speak other Indo-European language at home (41% speak English very well, 36% speak English well, 15% speak English not well, 8% don't speak English at all).
0.8% of residents speak Asian or Pacific Island language at home (50% speak English very well, 32% speak English well, 10% speak English not well, 8% don't speak English at all).
Foreign born population: 122 (2.1%)
(53.3% of them are naturalized citizens)
| Here: | 6.3 |
| State: | 6.4 |
| Here: | 4.6 |
| State: | 3.9 |

- Bedrooms in owner-occupied houses and condos in Lyndon, Vermont
- 0no bedroom
- 431 bedroom
- 2652 bedrooms
- 7343 bedrooms
- 2754 bedrooms
- 735+ bedrooms

- Bedrooms in renter-occupied apartments in Lyndon, Vermont
- 10no bedroom
- 2481 bedroom
- 2052 bedrooms
- 1113 bedrooms
- 444 bedrooms
- 235+ bedrooms

- Cars and other vehicles available in Lyndon in owner-occupied houses/condos
- 93no vehicle
- 4001 vehicle
- 6282 vehicles
- 2123 vehicles
- 494 vehicles
- 85+ vehicles

- Cars and other vehicles available in Lyndon in renter-occupied apartments
- 118no vehicle
- 3191 vehicle
- 1402 vehicles
- 403 vehicles
- 184 vehicles
- 65+ vehicles

- Rooms in owner-occupied houses in Lyndon, Vermont
- 01 room
- 92 rooms
- 123 rooms
- 1554 rooms
- 3095 rooms
- 3486 rooms
- 2637 rooms
- 1588 rooms
- 1369+ rooms

- Rooms in renter-occupied apartments in Lyndon, Vermont
- 101 room
- 922 rooms
- 1183 rooms
- 1534 rooms
- 1155 rooms
- 766 rooms
- 257 rooms
- 78 rooms
- 459+ rooms


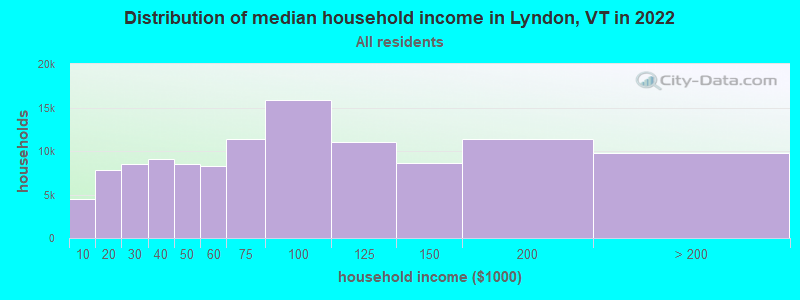
Lyndon, VT household income distribution

- 4,594Less than $10,000
- 7,718$10,000 to $19,999
- 8,426$20,000 to $29,999
- 8,771$30,000 to $39,999
- 8,345$40,000 to $49,999
- 8,036$50,000 to $59,999
- 11,083$60,000 to $74,999
- 15,374$75,000 to $99,999
- 10,757$100,000 to $124,999
- 8,407$125,000 to $149,999
- 11,116$150,000 to $199,999
- 9,514$200,000 or more
Percentage of workers working in this county: 87.2%
Number of people working at home: 453 (16.2% of all workers)
Travel time to work (commute)
- Less than 5 minutes: 196
- 5 to 9 minutes: 508
- 10 to 14 minutes: 531
- 15 to 19 minutes: 401
- 20 to 24 minutes: 306
- 25 to 29 minutes: 61
- 30 to 34 minutes: 189
- 35 to 39 minutes: 20
- 40 to 44 minutes: 26
- 45 to 59 minutes: 78
- 60 to 89 minutes: 83
- 90 or more minutes: 45
Means of transportation to work:
- Drove a car alone: 2,032 (78.6%)
- Carpooled: 291 (11.3%)
- Bicycle: 2 (0.1%)
- Walked: 119 (4.6%)
- Worked at home: 141 (5.5%)

- Year of entry for the foreign-born population in Lyndon, Vermont
- 191995 to March 2000
- 341990 to 1994
- 21985 to 1989
- 01980 to 1984
- 31975 to 1979
- 51970 to 1974
- 01965 to 1969
- 41Before 1965

First ancestries reported:
- English: 1,068 (20.6%)
- United States: 812 (15.6%)
- French: 645 (12.4%)
- Irish: 607 (11.7%)
- Other: 423 (8.2%)
- French Canadian: 392 (7.6%)
- Scottish: 295 (5.7%)
- German: 289 (5.6%)
- Italian: 140 (2.7%)
- Scotch-Irish: 134 (2.6%)
- Polish: 115 (2.2%)
- Welsh: 74 (1.4%)
- Swedish: 52 (1.0%)
- Norwegian: 30 (0.6%)
- Dutch: 28 (0.5%)
- Russian: 21 (0.4%)
- Slovak: 20 (0.4%)
- Hungarian: 11 (0.2%)
- Portuguese: 11 (0.2%)
- Greek: 9 (0.2%)
- Czech: 5 (0.10%)
- Swiss: 5 (0.10%)
- Arab: 3 (0.06%)
Most common places of birth for foreign-born residents (%):
| Lyndon: | 41.3% (43) |
| Vermont: | 34.0% (7,912) |
| Lyndon: | 26.9% (28) |
| Vermont: | 2.9% (673) |
| Lyndon: | 12.5% (13) |
| Vermont: | 7.2% (1,669) |
| Lyndon: | 8.7% (9) |
| Vermont: | 7.5% (1,744) |
| Lyndon: | 5.8% (6) |
| Vermont: | 1.4% (335) |
| Lyndon: | 2.9% (3) |
| Vermont: | 0.6% (144) |
| Lyndon: | 1.9% (2) |
| Vermont: | 3.4% (796) |
Place of birth for U.S.-born residents:
- This state: 3,476
- Other state: 1,833
- Northeast: 1,465
- Midwest: 126
- South: 167
- West: 75
56% of Lyndon residents lived in the same house 5 years ago.
Out of people who lived in different houses, 51% lived in this county.
Out of people who lived in different counties, 40% lived in Vermont.
Education attainment for males 25 years and older:
- No schooling: 0
- Nursery to 4th grade: 0
- 5th and 6th grade: 14
- 7th and 8th grade: 108
- 9th grade: 35
- 10th grade: 42
- 11th grade: 48
- 12th grade, no diploma: 62
- High school graduate (or equivalency): 597
- Less than 1 year of college: 82
- Some college more than 1 year, no degree: 109
- Associate degree: 61
- Bachelor's degree: 224
- Master's degree: 89
- Professional school degree: 24
- Doctorate degree: 19

Education attainment for females 25 years and older:
- No schooling: 0
- Nursery to 4th grade: 0
- 5th and 6th grade: 7
- 7th and 8th grade: 105
- 9th grade: 39
- 10th grade: 55
- 11th grade: 49
- 12th grade, no diploma: 16
- High school graduate (or equivalency): 632
- Less than 1 year of college: 71
- Some college more than 1 year, no degree: 211
- Associate degree: 131
- Bachelor's degree: 331
- Master's degree: 89
- Professional school degree: 4
- Doctorate degree: 13


Housing units in structures:
- One, detached: 1,226
- One, attached: 37
- Two: 239
- 3 or 4: 186
- 5 to 9: 161
- 10 to 19: 30
- 20 to 49: 34
- 50 or more: 6
- Mobile homes: 271
Median worth of mobile homes: $62,101
Housing units lacking complete kitchen facilities: 2.2%

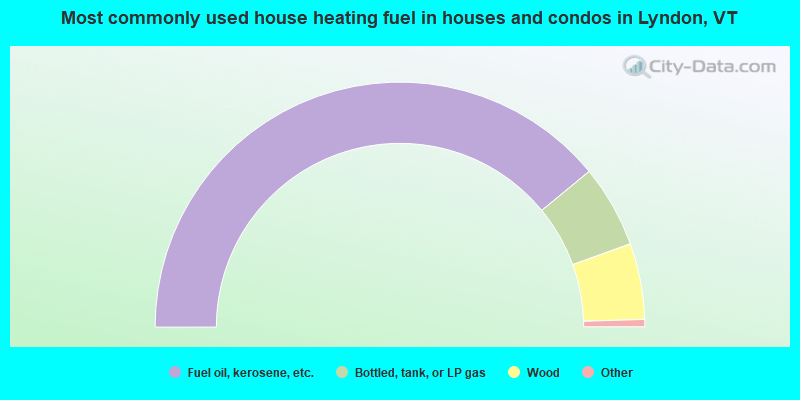
- 78.1%Fuel oil, kerosene, etc.
- 10.9%Bottled, tank, or LP gas
- 10.0%Wood
- 0.5%Utility gas
- 0.5%Electricity
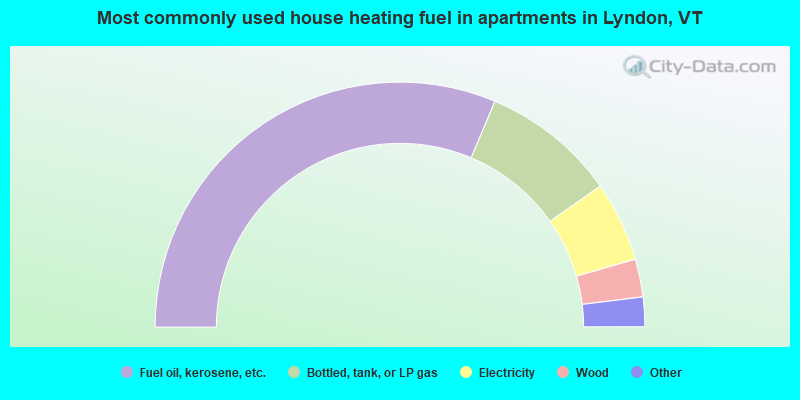
- 62.7%Fuel oil, kerosene, etc.
- 17.8%Bottled, tank, or LP gas
- 10.6%Electricity
- 5.0%Wood
- 3.3%Utility gas
- 0.6%Other fuel
Private vs. public school enrollment:
| Here: | 6.2% |
| Vermont: | 7.2% |
| Here: | 32.8% |
| Vermont: | 10.4% |
| Here: | 27.9% |
| Vermont: | 37.7% |


