Races in Lyndon, Vermont (VT) Detailed Stats
Ancestries, Foreign-born residents, place of birth

Recent posts about races in Lyndon, Vermont on our local forum with over 2,400,000 registered users:
 | Lyndon in Vermont (12 replies) |
| Lyndonville (34 replies) |
| Condsidering a move to the NEK (58 replies) |
| Escaping Texas, relocating to Vermont... (133 replies) |
| Jobs in St. Johnsbury? (5 replies) |
| NEK Internet Coverage (2 replies) |
1.9% of Lyndon, VT residents are foreign-born , which is 109.5% less than the foreign-born rate of 4.0% across the entire state of Vermont.
Race distribution in Lyndon

- 5,31397.5%White alone
- 360.7%Two or more races
- 330.6%Asian alone
- 270.5%American Indian alone
- 240.4%Hispanic
- 120.2%Black alone
- 20.04%Other race alone
- 10.02%Native Hawaiian and Other
Pacific Islander alone

2000
2022
-
- 585,43196.2%White alone
- 6,8091.1%Two or more races
- 5,5040.9%Hispanic
- 5,1600.8%Asian alone
- 2,9210.5%Black alone
- 2,3250.4%American Indian alone
- 5570.09%Other race alone
- 1200.02%Native Hawaiian and Other
Pacific Islander alone

-
- 583,54690.2%White alone
- 27,3404.2%Two or more races
- 14,7702.3%Hispanic
- 11,5121.8%Asian alone
- 6,2641.0%Black alone
- 2,5210.4%Other race alone
- 1,0520.2%American Indian alone
- 590.01%Native Hawaiian and Other
Pacific Islander alone

Income and house value in Lyndon
- Median household income in 2022
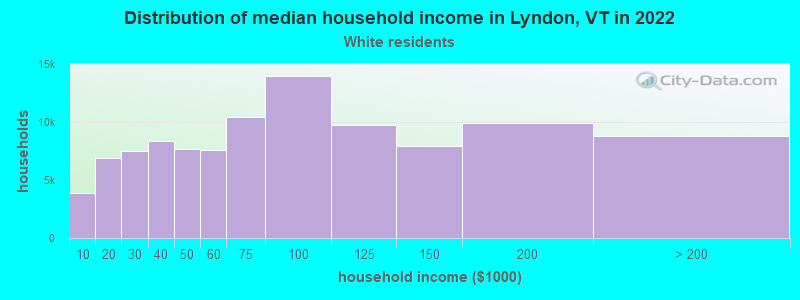
- $58,882White non-Hispanic householders
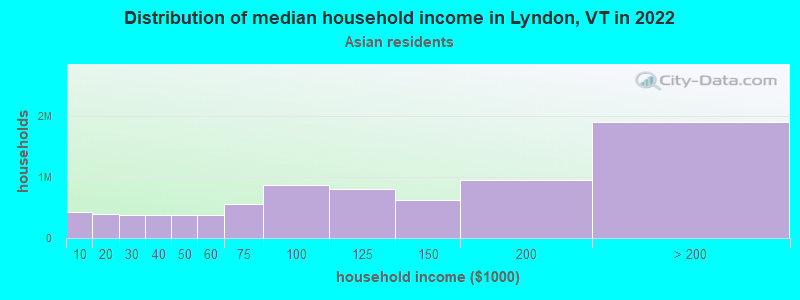
- $109,438Asian householders
- $18,560Some other race householders
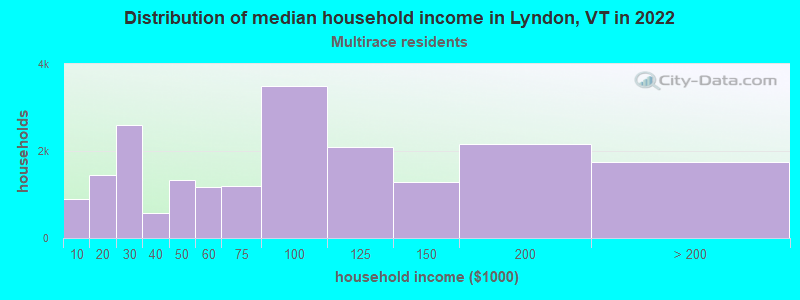
- $123,693Two or more races householders
- $101,256Hispanic or Latino race householders
- Median 2022 house value
- $223,201White Non-Hispanic householders
- $32,180Asian householders
- $57,924Two or more races householders
Household income for White non-Hispanic householders
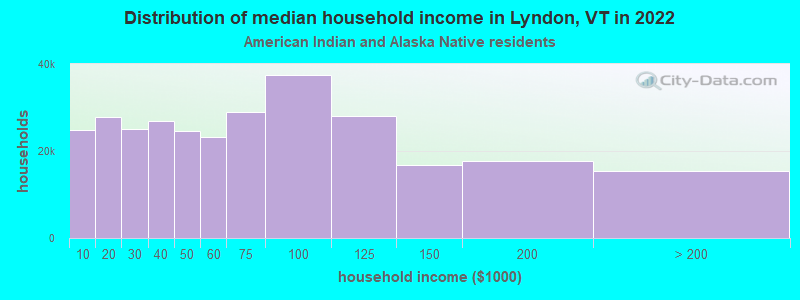
Household income for American Indian and Alaska Native householders
Household income for Asian householders
Household income for Two or more races householders
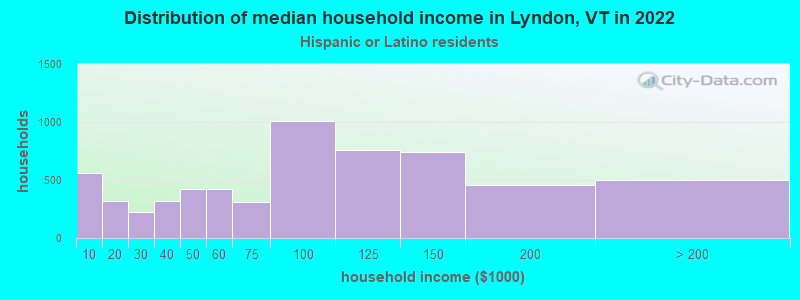
Household income for Hispanic or Latino race householders
Foreign-born residents in Lyndon
104 residents are foreign born
| This city: | 1.9% |
| Vermont: | 3.8% |
Ancestries in Lyndon

- 1,06820.6%English
- 81215.6%United States
- 64512.4%French
- 60711.7%Irish
- 4238.2%Other
- 3927.6%French Canadian
- 2955.7%Scottish
- 2895.6%German
- 1402.7%Italian
- 1342.6%Scotch-Irish
- 1152.2%Polish
- 741.4%Welsh
- 521.0%Swedish
- 300.6%Norwegian
- 280.5%Dutch
- 210.4%Russian
- 200.4%Slovak
- 110.2%Hungarian
- 110.2%Portuguese
- 90.2%Greek
- 50.10%Czech
- 50.10%Swiss
- 30.06%Arab

Zip codes: 05851.