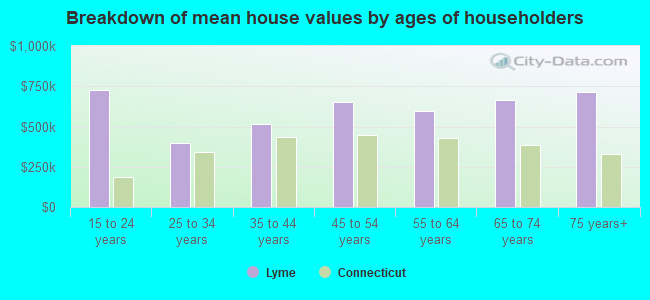
Median price asked for vacant for-sale houses and condos in 2022 in this county: $309,766.
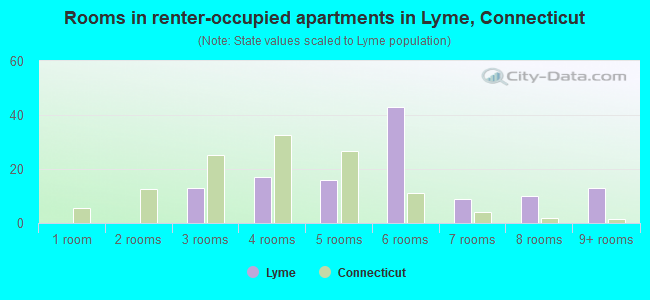
Median contract rent in 2022: $1,219 (lower quartile is $1,005, upper quartile is over $2,000)
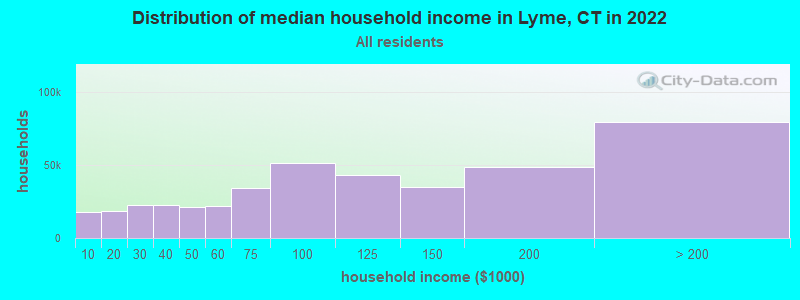
Median gross rent in Lyme, CT in 2022: $1,447
Housing units in Lyme with a mortgage: 333 (21 second mortgage, 68 home equity loan, 0 both second mortgage and home equity loan) Houses without a mortgage: 244
In family households: 214,652 (47,484 male householders, 22,378 female householders)
52,173 spouses, 73,395 children (67,999 natural, 1,935 adopted, 3,461 stepchildren), 4,214 grandchildren, 2,063 brothers or sisters, 2,316 parents, foster children, 2,625 other relatives, 6,387 non-relatives
In nonfamily households: 46,621 (18,056 male householders (13,616 living alone)), 19,139 female householders (15,978 living alone)), 9,426 nonrelatives
In group quarters: 12,782 (5,482 institutionalized population)
43,726 married couples with children.
14,569 single-parent households (3,084 men, 11,485 women).
94.7% of residents of Lyme speak English at home.
0.7% of residents speak Spanish at home (71% speak English very well, 29% speak English well).
3.8% of residents speak other Indo-European language at home (85% speak English very well, 15% speak English well).
0.8% of residents speak other language at home (100% speak English very well).
Foreign born population: 124 (5.1%)
(61.3% of them are naturalized citizens)
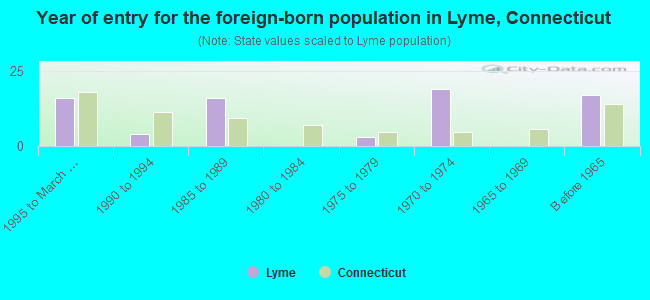
Year of entry for the foreign-born population in Lyme, Connecticut
161995 to March 2000
41990 to 1994
161985 to 1989
01980 to 1984
31975 to 1979
191970 to 1974
01965 to 1969
17Before 1965
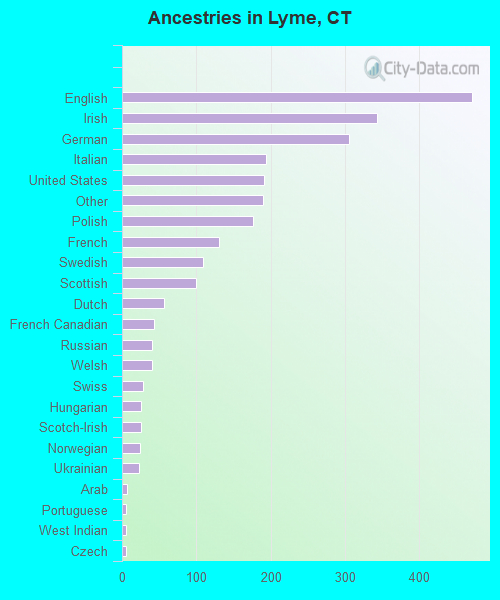
First ancestries reported:
English: 470 (18.5%)
Irish: 343 (13.5%)
German: 305 (12.0%)
Italian: 193 (7.6%)
United States: 191 (7.5%)
Other: 189 (7.4%)
Polish: 176 (6.9%)
French: 131 (5.2%)
Swedish: 109 (4.3%)
Scottish: 99 (3.9%)
Dutch: 57 (2.2%)
French Canadian: 43 (1.7%)
Russian: 41 (1.6%)
Welsh: 41 (1.6%)
Swiss: 28 (1.1%)
Hungarian: 26 (1.0%)
Scotch-Irish: 26 (1.0%)
Norwegian: 24 (0.9%)
Ukrainian: 23 (0.9%)
Arab: 7 (0.3%)
Portuguese: 6 (0.2%)
West Indian: 6 (0.2%)
Czech: 5 (0.2%)
Slovak: 4 (0.2%)
Most common places of birth for foreign-born residents (%):
United Kingdom
Lyme:
46.7% (35)
Connecticut:
4.4% (16,395)
Colombia
Lyme:
10.7% (8)
Connecticut:
3.2% (12,009)
Canada
Lyme:
8.0% (6)
Connecticut:
5.2% (19,083)
Other Northern Europe
Lyme:
6.7% (5)
Connecticut:
0.6% (2,220)
Germany
Lyme:
5.3% (4)
Connecticut:
3.1% (11,432)
Brazil
Lyme:
5.3% (4)
Connecticut:
2.8% (10,379)
Ecuador
Lyme:
5.3% (4)
Connecticut:
2.4% (9,020)
France
Lyme:
4.0% (3)
Connecticut:
0.7% (2,742)
Other Western Europe
Lyme:
4.0% (3)
Connecticut:
0.5% (1,983)
Ukraine
Lyme:
4.0% (3)
Connecticut:
1.0% (3,822)
Place of birth for U.S.-born residents:
This state: 1,015
Other state: 896
Northeast: 579
Midwest: 195
South: 74
West: 48
72% of Lyme residents lived in the same house 5 years ago. Out of people who lived in different houses, 43% lived in this county. Out of people who lived in different counties, 53% lived in Connecticut.
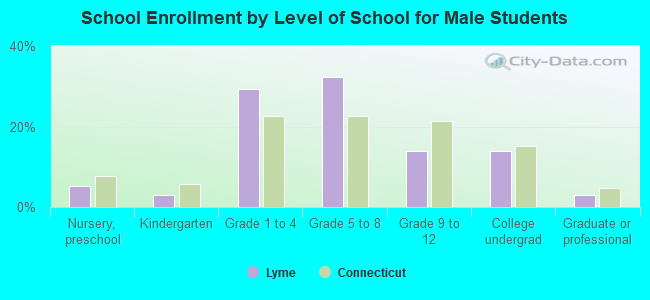
Education attainment for males 25 years and older:
No schooling: 8
Nursery to 4th grade: 0
5th and 6th grade: 4
7th and 8th grade: 8
9th grade: 0
10th grade: 0
11th grade: 13
12th grade, no diploma: 14
High school graduate (or equivalency): 139
Less than 1 year of college: 40
Some college more than 1 year, no degree: 73
Associate degree: 40
Bachelor's degree: 260
Master's degree: 73
Professional school degree: 59
Doctorate degree: 45
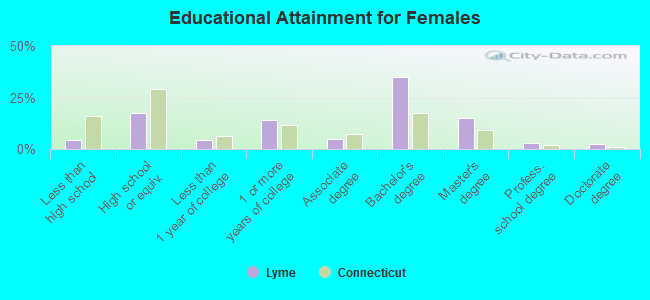
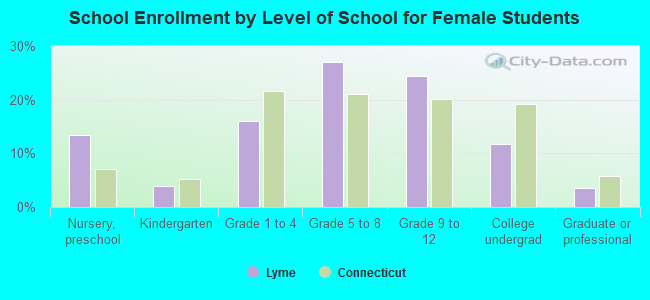
Education attainment for females 25 years and older:
No schooling: 0
Nursery to 4th grade: 0
5th and 6th grade: 0
7th and 8th grade: 14
9th grade: 0
10th grade: 9
11th grade: 5
12th grade, no diploma: 6
High school graduate (or equivalency): 134
Less than 1 year of college: 35
Some college more than 1 year, no degree: 107
Associate degree: 38
Bachelor's degree: 267
Master's degree: 115
Professional school degree: 21
Doctorate degree: 17
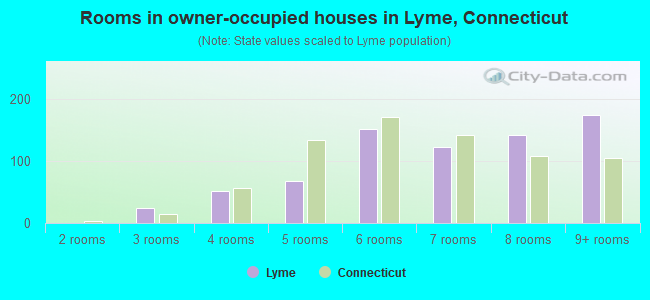
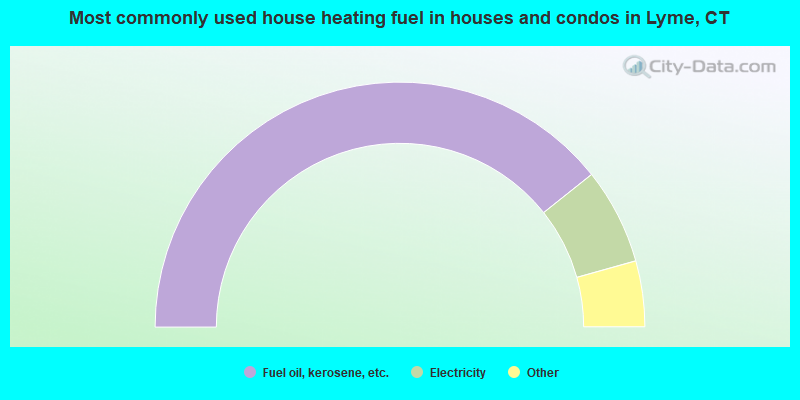
Housing units in structures:
One, detached: 966
One, attached: 11
Two: 12
Housing units lacking complete plumbing facilities: 0.4%