Lyme, Connecticut (CT) income map, earnings map, and wages data
The median household income in Lyme, CT in 2022 was $123,949, which was 28.7% greater than the median annual income of $88,429 across the entire state of Connecticut. Compared to the median income of $73,250 in 2000 this represents an increase of 40.9%. The per capita income in 2022 was $79,294, which means an increase of 45.3% compared to 2000 when it was $43,347.
Income statistics for all residents
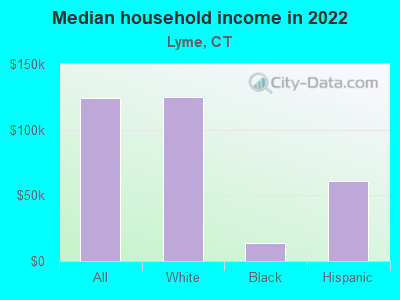
Median household income in Lyme, CT in 2022:| Lyme: | $123,949 |
| Connecticut: | $88,429 |
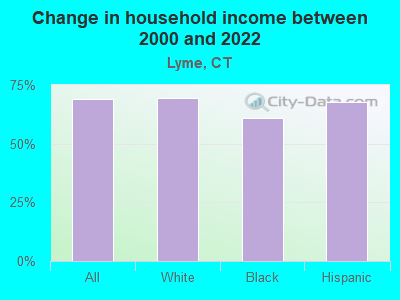
Change in median household income between 2000 and 2022:| Lyme, Connecticut: | +69.2% |
| State: | +64.0% |
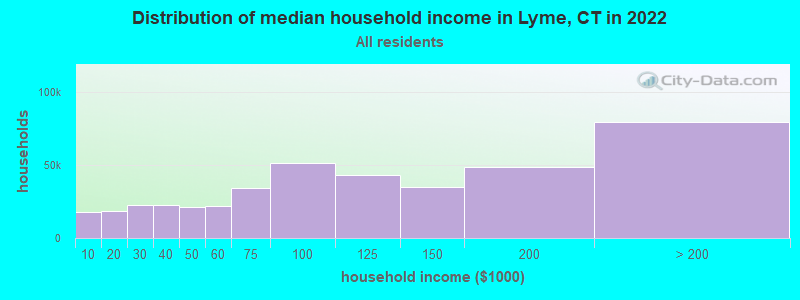
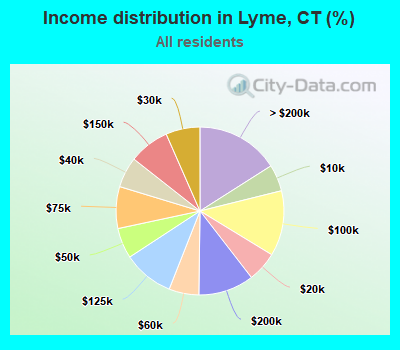
Number of households with income < $10k:| Lyme: | 5.2% (50,487) |
| Connecticut: | 5.1% (72,746) |
Number of households with income $10k - 20k:| Lyme: | 5.8% (56,932) |
| State: | 5.7% (81,643) |
Number of households with income $20k - 30k:| Lyme: | 6.6% (64,441) |
| State: | 6.5% (92,844) |
Number of households with income $30k - 40k:| Lyme: | 5.9% (57,831) |
| Connecticut: | 5.9% (83,934) |
Number of households with income $40k - 50k:| Lyme: | 5.9% (57,460) |
| Connecticut: | 5.8% (83,025) |
Number of households with income $50k - 60k:| Lyme: | 5.8% (56,344) |
| State: | 5.7% (81,788) |
Number of households with income $60k - 75k:| Lyme: | 8.1% (78,945) |
| State: | 8.1% (115,651) |
Number of households with income $75k - 100k:| Lyme: | 12.6% (123,294) |
| State: | 12.6% (180,173) |
Number of households with income $100k - 125k:| Lyme: | 9.8% (95,983) |
| Connecticut: | 9.9% (141,231) |
Number of households with income $125k - 150k:| Lyme: | 7.8% (76,652) |
| State: | 7.9% (112,826) |
Number of households with income $150k - 200k:| Lyme: | 10.7% (104,853) |
| State: | 10.8% (154,641) |
Number of households with income > $200k:| Lyme: | 16.0% (156,644) |
| State: | 16.3% (233,133) |
Aggregate household income in Lyme in 2022: $3,642,854,138
Median family income in Lyme in 2022:| Lyme: | $147,975 |
| Connecticut: | $115,183 |
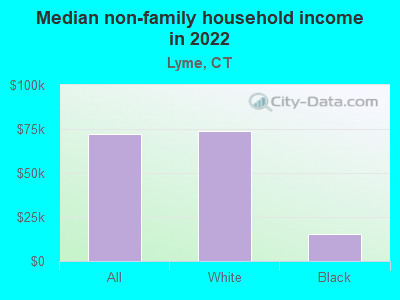
Median non-family income in Lyme in 2022:| Lyme: | $72,232 |
| State: | $50,964 |
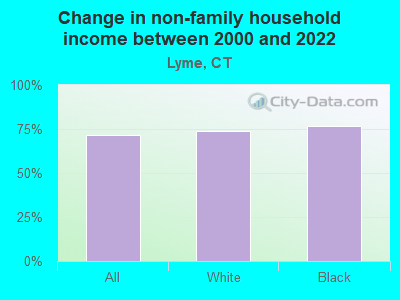
Change in median non-family income between 2000 and 2022:| Lyme, Connecticut: | +71.5% |
| State: | +65.1% |
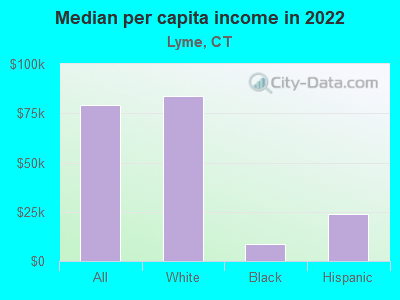
Median per capita income in Lyme in 2022:| Lyme: | $79,294 |
| Connecticut: | $51,581 |
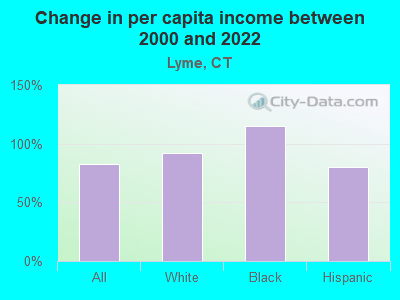
Change in median per capita income between 2000 and 2022:| Lyme, Connecticut: | +82.9% |
| State: | +79.3% |
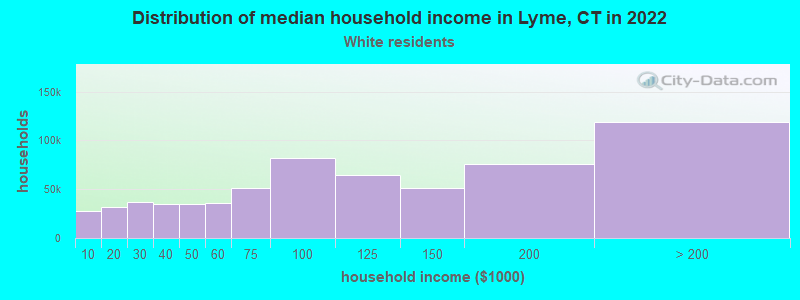
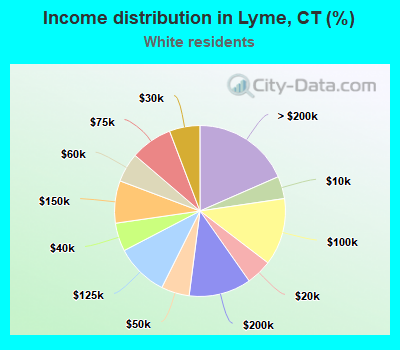
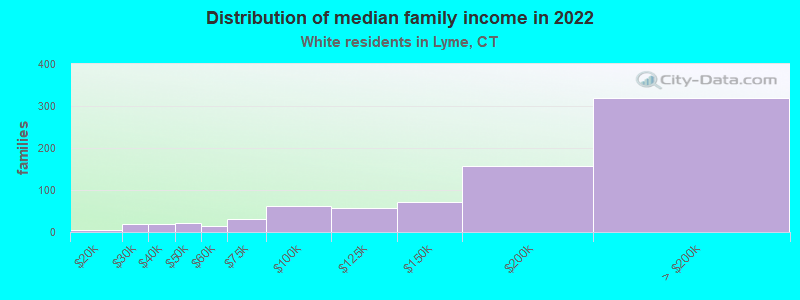
Income statistics for White residents
Median household income in Lyme, CT in 2022:| Lyme: | $124,672 |
| State: | $96,890 |
Change in median household income between 2000 and 2022:| Lyme, Connecticut: | +69.4% |
| State: | +68.5% |
Number of households with income < $10k:| Lyme: | 4.2% (27,268) |
| State: | 4.2% (42,265) |
Number of households with income $10k - 20k:| Lyme: | 4.9% (31,351) |
| Connecticut: | 4.8% (48,323) |
Number of households with income $20k - 30k:| Lyme: | 5.8% (37,283) |
| State: | 5.7% (57,716) |
Number of households with income $30k - 40k:| Lyme: | 5.4% (34,512) |
| Connecticut: | 5.3% (53,827) |
Number of households with income $40k - 50k:| Lyme: | 5.3% (34,369) |
| State: | 5.3% (53,301) |
Number of households with income $50k - 60k:| Lyme: | 5.6% (35,768) |
| State: | 5.5% (55,690) |
Number of households with income $60k - 75k:| Lyme: | 7.9% (51,114) |
| Connecticut: | 8.0% (80,329) |
Number of households with income $75k - 100k:| Lyme: | 12.7% (81,904) |
| State: | 12.7% (128,070) |
Number of households with income $100k - 125k:| Lyme: | 10.0% (64,314) |
| Connecticut: | 10.0% (101,210) |
Number of households with income $125k - 150k:| Lyme: | 8.0% (51,633) |
| State: | 8.0% (81,250) |
Number of households with income $150k - 200k:| Lyme: | 11.8% (75,921) |
| Connecticut: | 11.8% (119,527) |
Number of households with income > $200k:| Lyme: | 18.4% (118,851) |
| State: | 18.6% (187,875) |
Aggregate household income in Lyme in 2022: $2,774,310,780
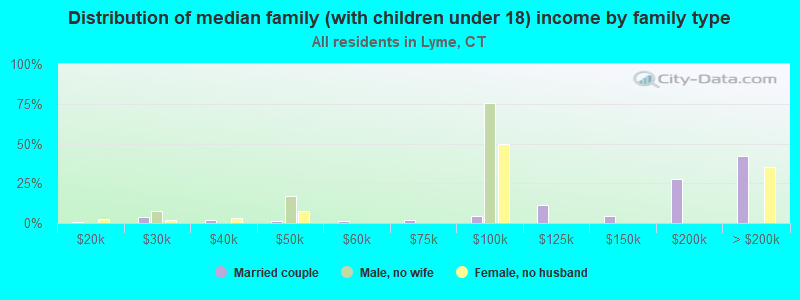
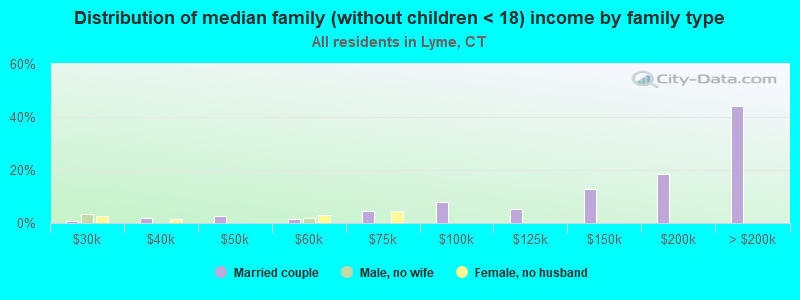
Median family income in Lyme in 2022:| Lyme: | $151,856 |
| Connecticut: | $128,955 |
Number of families with income $10k - 20k:| Lyme: | 0.5% (4) |
| State: | 1.8% (11,289) |
Number of families with income $20k - 30k:| Lyme: | 2.3% (18) |
| State: | 3.0% (18,506) |
Number of families with income $30k - 40k:| Lyme: | 2.3% (18) |
| State: | 2.9% (18,160) |
Number of families with income $40k - 50k:| Lyme: | 2.9% (22) |
| State: | 3.9% (24,550) |
Number of families with income $50k - 60k:| Lyme: | 1.9% (15) |
| Connecticut: | 4.3% (26,723) |
Number of families with income $60k - 75k:| Lyme: | 3.9% (30) |
| State: | 7.1% (44,075) |
Number of families with income $75k - 100k:| Lyme: | 7.9% (61) |
| Connecticut: | 12.5% (77,679) |
Number of families with income $100k - 125k:| Lyme: | 7.4% (57) |
| State: | 11.1% (69,086) |
Number of families with income $125k - 150k:| Lyme: | 9.3% (72) |
| Connecticut: | 9.6% (59,616) |
Number of families with income $150k - 200k:| Lyme: | 20.3% (157) |
| State: | 15.7% (97,890) |
Number of families with income > $200k:| Lyme: | 41.3% (320) |
| State: | 26.3% (163,417) |
Median non-family income in Lyme in 2022:| Lyme: | $73,595 |
| State: | $54,067 |
Change in median non-family income between 2000 and 2022:| Lyme, Connecticut: | +73.7% |
| State: | +68.7% |
Median per capita income in Lyme in 2022:| Lyme: | $83,555 |
| State: | $59,916 |
Change in median per capita income between 2000 and 2022:| Lyme, Connecticut: | +92.1% |
| State: | +90.2% |
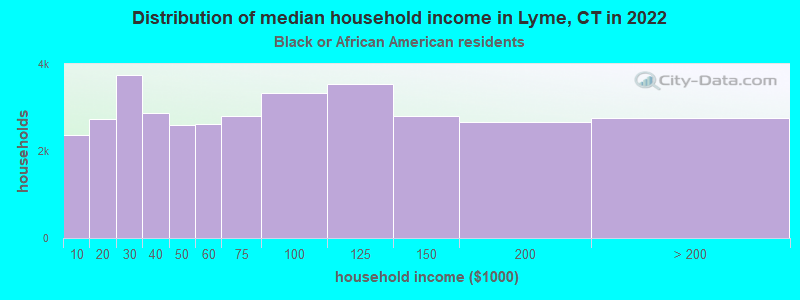
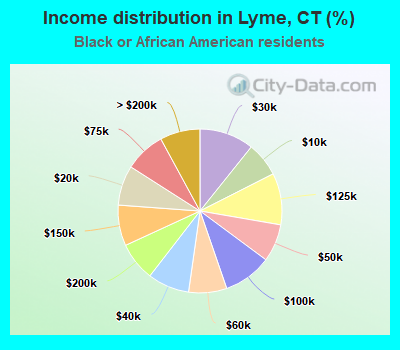
Income statistics for Black or African American residents
Median household income in Lyme, CT in 2022:| Lyme: | $14,079 |
| State: | $61,803 |
Change in median household income between 2000 and 2022:| Lyme, Connecticut: | +60.9% |
| Connecticut: | +76.1% |
Number of households with income < $10k:| Lyme: | 6.8% (2,366) |
| State: | 6.8% (9,494) |
Number of households with income $10k - 20k:| Lyme: | 7.9% (2,743) |
| State: | 7.9% (11,003) |
Number of households with income $20k - 30k:| Lyme: | 10.8% (3,750) |
| State: | 10.8% (15,045) |
Number of households with income $30k - 40k:| Lyme: | 8.2% (2,866) |
| State: | 8.2% (11,501) |
Number of households with income $40k - 50k:| Lyme: | 7.4% (2,596) |
| State: | 7.4% (10,416) |
Number of households with income $50k - 60k:| Lyme: | 7.5% (2,626) |
| Connecticut: | 7.5% (10,534) |
Number of households with income $60k - 75k:| Lyme: | 8.0% (2,803) |
| State: | 8.0% (11,244) |
Number of households with income $75k - 100k:| Lyme: | 9.6% (3,333) |
| State: | 9.6% (13,370) |
Number of households with income $100k - 125k:| Lyme: | 10.2% (3,550) |
| State: | 10.2% (14,244) |
Number of households with income $125k - 150k:| Lyme: | 8.0% (2,803) |
| Connecticut: | 8.0% (11,246) |
Number of households with income $150k - 200k:| Lyme: | 7.7% (2,674) |
| Connecticut: | 7.7% (10,727) |
Number of households with income > $200k:| Lyme: | 7.9% (2,763) |
| State: | 7.9% (11,086) |
Aggregate household income in Lyme in 2022: $161,213
Median non-family income in Lyme in 2022:| Lyme: | $15,486 |
| State: | $38,608 |
Change in median non-family income between 2000 and 2022:| Lyme, Connecticut: | +77.0% |
| Connecticut: | +77.0% |
Median per capita income in Lyme in 2022:| Lyme: | $8,608 |
| Connecticut: | $36,289 |
Change in median per capita income between 2000 and 2022:| Lyme, Connecticut: | +115.2% |
| Connecticut: | +117.5% |
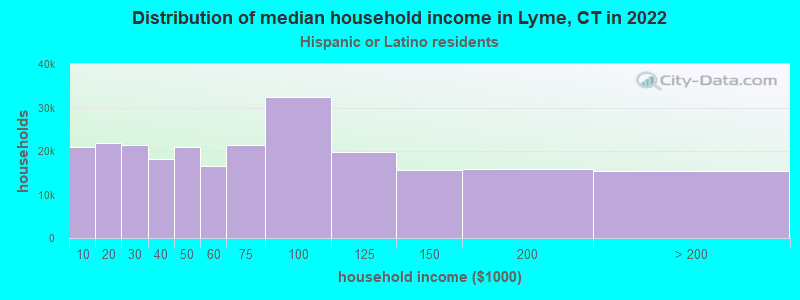
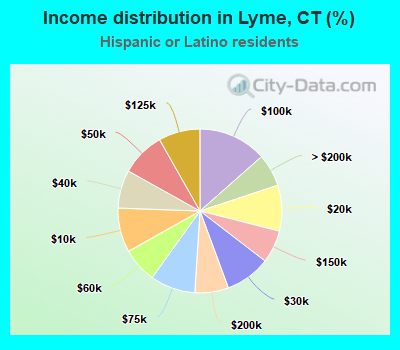
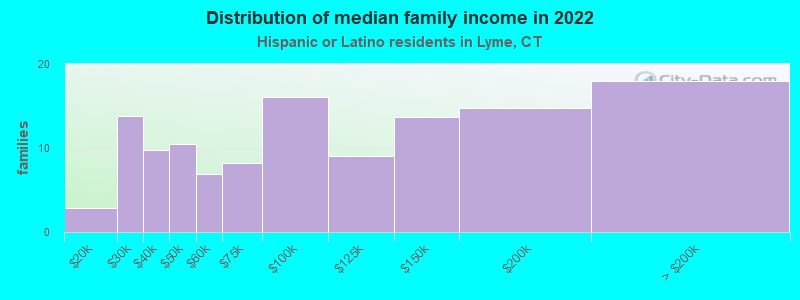
Income statistics for Hispanic or Latino residents
Median household income in Lyme, CT in 2022:| Lyme: | $60,825 |
| State: | $60,275 |
Change in median household income between 2000 and 2022:| Lyme, Connecticut: | +67.8% |
| Connecticut: | +87.9% |
Number of households with income < $10k:| Lyme: | 8.7% (21,003) |
| State: | 8.7% (18,584) |
Number of households with income $10k - 20k:| Lyme: | 9.1% (21,739) |
| State: | 9.1% (19,235) |
Number of households with income $20k - 30k:| Lyme: | 8.9% (21,461) |
| State: | 8.9% (18,989) |
Number of households with income $30k - 40k:| Lyme: | 7.5% (18,046) |
| State: | 7.5% (15,967) |
Number of households with income $40k - 50k:| Lyme: | 8.7% (20,870) |
| Connecticut: | 8.7% (18,466) |
Number of households with income $50k - 60k:| Lyme: | 6.9% (16,620) |
| State: | 6.9% (14,706) |
Number of households with income $60k - 75k:| Lyme: | 8.9% (21,347) |
| State: | 8.9% (18,888) |
Number of households with income $75k - 100k:| Lyme: | 13.5% (32,401) |
| Connecticut: | 13.5% (28,669) |
Number of households with income $100k - 125k:| Lyme: | 8.2% (19,703) |
| State: | 8.2% (17,434) |
Number of households with income $125k - 150k:| Lyme: | 6.5% (15,542) |
| Connecticut: | 6.5% (13,752) |
Number of households with income $150k - 200k:| Lyme: | 6.6% (15,951) |
| State: | 6.6% (14,114) |
Number of households with income > $200k:| Lyme: | 6.4% (15,404) |
| Connecticut: | 6.4% (13,630) |
Aggregate household income in Lyme in 2022: $1,190,378
Median family income in Lyme in 2022:| Lyme: | $62,017 |
| Connecticut: | $68,336 |
Number of families with income $10k - 20k:| Lyme: | 2.4% (3) |
| State: | 6.0% (8,616) |
Number of families with income $20k - 30k:| Lyme: | 11.2% (14) |
| Connecticut: | 8.9% (12,680) |
Number of families with income $30k - 40k:| Lyme: | 7.8% (10) |
| State: | 8.5% (12,090) |
Number of families with income $40k - 50k:| Lyme: | 8.5% (11) |
| State: | 8.8% (12,624) |
Number of families with income $50k - 60k:| Lyme: | 5.6% (7) |
| State: | 8.4% (11,924) |
Number of families with income $60k - 75k:| Lyme: | 6.6% (8) |
| Connecticut: | 8.9% (12,677) |
Number of families with income $75k - 100k:| Lyme: | 13.0% (16) |
| State: | 14.3% (20,457) |
Number of families with income $100k - 125k:| Lyme: | 7.3% (9) |
| State: | 8.2% (11,720) |
Number of families with income $125k - 150k:| Lyme: | 11.0% (14) |
| Connecticut: | 8.2% (11,729) |
Number of families with income $150k - 200k:| Lyme: | 12.0% (15) |
| State: | 7.1% (10,096) |
Number of families with income > $200k:| Lyme: | 14.6% (18) |
| Connecticut: | 7.4% (10,622) |
Median per capita income in Lyme in 2022:| Lyme: | $23,697 |
| State: | $28,507 |
Change in median per capita income between 2000 and 2022:| Lyme, Connecticut: | +80.3% |
| State: | +117.2% |