Lincoln, NE (Nebraska) Houses and Residents
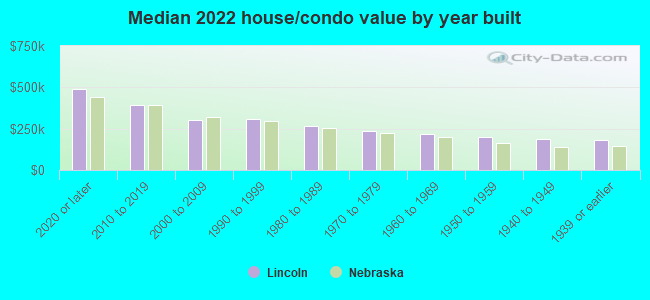
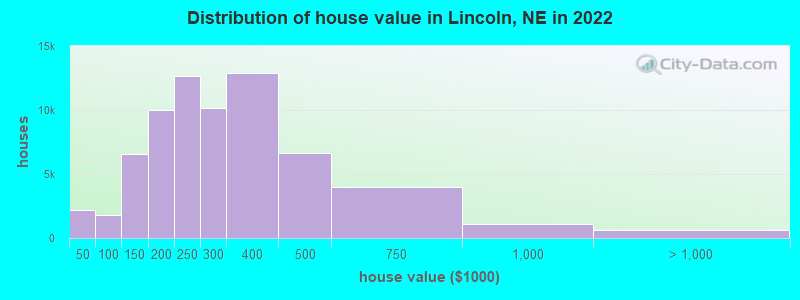
Estimated median house or condo value in 2022: $255,200 (it was $101,600 in 2000 )
Lincoln:
$255,200Nebraska:
$232,400
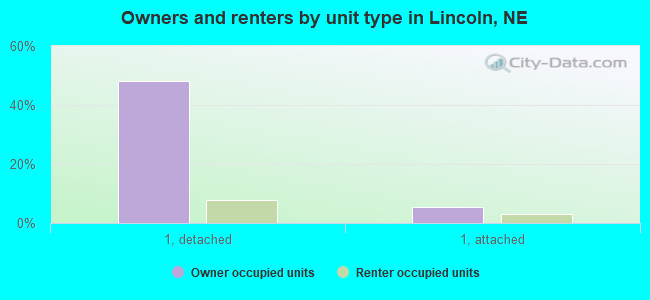
Lower value quartile - upper value quartile: $183,400 - $362,600Mean price in 2022: Detached houses: $300,945 Here:
$300,945State:
$274,677
Townhouses or other attached units: $309,098 Here:
$309,098State:
$245,619
In 2-unit structures: $131,951 Here:
$131,951State:
$168,724
In 3-to-4-unit structures: $552,107 Here:
$552,107State:
$405,971
In 5-or-more-unit structures: $295,888 Here:
$295,888State:
$476,911
Mobile homes: $62,392 Here:
$62,392State:
$67,339
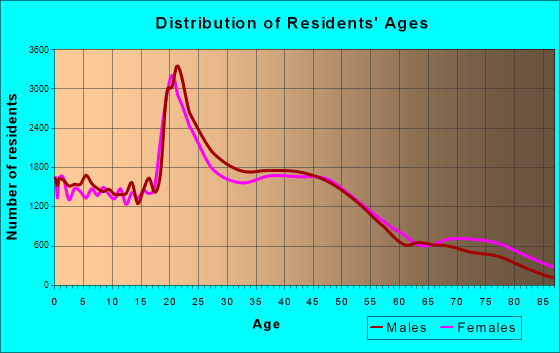
Total population: 272,996 (Urban population: 225,224, Rural population: 218 (14 farm, 204 nonfarm ))
Houses: 128,790 (121,921 occupied: 68,533 owner occupied, 53,388 renter occupied )
% of renters here:
44%State:
34%
Housing density: 1,725 houses/condos per square mile
Median price asked for vacant for-sale houses and condos in 2022: $305,521.
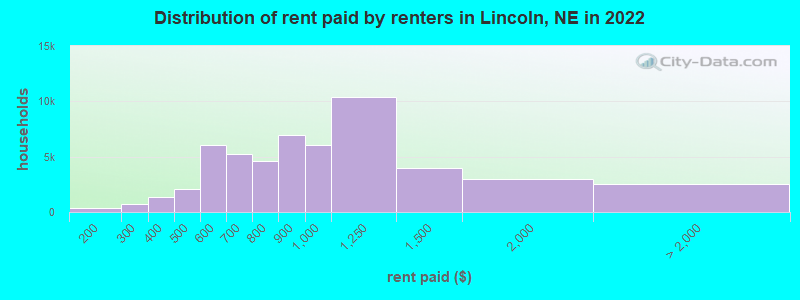
Median contract rent in 2022: $880 (lower quartile is $656, upper quartile is $1,133)
Median rent asked for vacant for-rent units in 2022: $1,832
Median gross rent in Lincoln, NE in 2022: $998
Housing units in Lincoln with a mortgage: 44,152 (4,694 second mortgage, 205 home equity loan, 3,265 both second mortgage and home equity loan )Houses without a mortgage: 1,470
Median household income for houses/condos with a mortgage: $101,353
Median household income for apartments without a mortgage: $68,011
Median monthly housing costs: $1,094
Data:
Median house or condo value ($)
Median house or condo value ($ change since 2000)
Median house or condo value ($) - White
Median house or condo value ($) - Black or African American
Median house or condo value ($) - Asian
Median house or condo value ($) - Hispanic or Latino
Median house or condo value ($) - American Indian and Alaska Native
Median house or condo value ($) - Multirace
Median house or condo value ($) - Other Race
Median price asked for mobile homes ($)
Household density (households per square mile)
Mean house or condo value by units in structure - 1, detached ($)
Mean house or condo value by units in structure - 1, attached ($)
Mean house or condo value by units in structure - 2 ($)
Mean house or condo value by units in structure by units in structure - 3 or 4 ($)
Mean house or condo value by units in structure - 5 or more ($)
Mean house or condo value by units in structure - Boat, RV, van, etc. ($)
Mean house or condo value by units in structure - Mobile home ($)
Median contract rent ($)
Median contract rent - Lower quartile ($)
Median contract rent - Upper quartile ($)
Median gross rent ($)
Urban houses (%)
Rural houses (%)
Houses occupied (%)
Houses occupied (% change since 2000)
Houses owner occupied (%)
Houses owner occupied (% change since 2000)
Houses renter occupied (%)
Houses renter occupied (% change since 2000)
Vacant housing units - For rent (%)
Vacant housing units - For rent (% change since 2000)
Vacant housing units - For sale only (%)
Vacant housing units - For sale only (% change since 2000)
Vacant housing units - Rented or sold, not occupied (%)
Vacant housing units - Rented or sold, not occupied (% change since 2000)
Vacant housing units - For seasonal, recreational, or occasional use (%)
Vacant housing units - For seasonal, recreational, or occasional use (% change since 2000)
Vacant housing units - For migrant workers (%)
Vacant housing units - For migrant workers (% change since 2000)
Vacant housing units - Other vacant (%)
Vacant housing units - Other vacant (% change since 2000)
Median monthly housing costs ($)
Median household income for houses/condos with a mortgage ($)
Median household income for houses/condos without a mortgage ($)
Median household income ($)
Median household income ($) - White
Median household income ($) - Black or African American
Median household income ($) - Asian
Median household income ($) - Hispanic or Latino
Median household income ($) - American Indian and Alaska Native
Median household income ($) - Multirace
Median household income ($) - Other Race
Mortgage status - with mortgage (%)
Mortgage status - with second mortgage (%)
Mortgage status - with home equity loan (%)
Mortgage status - with both second mortgage and home equity loan (%)
Mortgage status - without a mortgage (%)
Median year house/condo built
Median year apartment built
Household type by relationship - Male householder living alone (%)
Household type by relationship - Male householder not living alone (%)
Household type by relationship - Female householder living alone (%)
Household type by relationship - Female householder not living alone (%)
Household type by relationship - Opposite-Sex spouse (%)
Household type by relationship - Same-Sex spouse (%)
Household type by relationship - Opposite-Sex unmarried partner (%)
Household type by relationship - Same-Sex unmarried partner (%)
Household type by relationship - In group quarters (%)
Size of family households - 2-person household (%)
Size of family households - 3-person household (%)
Size of family households - 4-person household (%)
Size of family households - 5-person household (%)
Size of family households - 6-person household (%)
Size of family households - 7-or-more-person household (%)
Size of nonfamily households - 1-person household (%)
Size of nonfamily households - 2-person household (%)
Size of nonfamily households - 3-person household (%)
Size of nonfamily households - 4-person household (%)
Size of nonfamily households - 5-person household (%)
Size of nonfamily households - 6-person household (%)
Size of nonfamily households - 7-or-moreperson household (%)
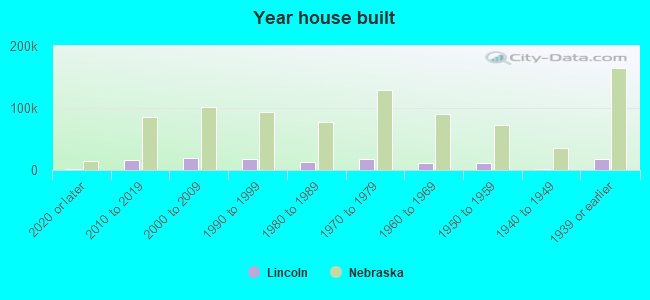
Year house built - Built 2010 or later (%)
Year house built - Built 2000 to 2009 (%)
Year house built - Built 1990 to 1999 (%)
Year house built - Built 1980 to 1989 (%)
Year house built - Built 1970 to 1979 (%)
Year house built - Built 1960 to 1969 (%)
Year house built - Built 1950 to 1959 (%)
Year house built - Built 1940 to 1949 (%)
Year house built - Built 1939 or earlier (%)
Median number of rooms in houses and condos
Median number of rooms in apartments
Median number of bedrooms in owner occupied houses
Mean number of bedrooms in owner occupied houses
Median number of bedrooms in renter occupied houses
Mean number of bedrooms in renter occupied houses
Median number of vehichles in owner occupied houses
Mean number of vehichles in owner occupied houses
Median number of vehichles in renter occupied houses
Mean number of vehichles in renter occupied houses
Rooms in owner-occupied houses - 1 room (%)
Rooms in owner-occupied houses - 2 rooms (%)
Rooms in owner-occupied houses - 3 rooms (%)
Rooms in owner-occupied houses - 4 rooms (%)
Rooms in owner-occupied houses - 5 rooms (%)
Rooms in owner-occupied houses - 6 rooms (%)
Rooms in owner-occupied houses - 7 rooms (%)
Rooms in owner-occupied houses - 8 rooms (%)
Rooms in owner-occupied houses - 9+ rooms (%)
Rooms in renter-occupied houses - 1 room (%)
Rooms in renter-occupied houses - 2 rooms (%)
Rooms in renter-occupied houses - 3 rooms (%)
Rooms in renter-occupied houses - 4 rooms (%)
Rooms in renter-occupied houses - 5 rooms (%)
Rooms in renter-occupied houses - 6 rooms (%)
Rooms in renter-occupied houses - 7 rooms (%)
Rooms in renter-occupied houses - 8 rooms (%)
Rooms in renter-occupied houses - 9+ rooms (%)
Bedrooms in owner-occupied houses - no bedrooms (%)
Bedrooms in owner-occupied houses - 1 bedroom (%)
Bedrooms in owner-occupied houses - 2 bedrooms (%)
Bedrooms in owner-occupied houses - 3 bedrooms (%)
Bedrooms in owner-occupied houses - 4 bedrooms (%)
Bedrooms in owner-occupied houses - 5+ bedrooms (%)
Bedrooms in renter-occupied houses - no bedrooms (%)
Bedrooms in renter-occupied houses - 1 bedroom (%)
Bedrooms in renter-occupied houses - 2 bedrooms (%)
Bedrooms in renter-occupied houses - 3 bedrooms (%)
Bedrooms in renter-occupied houses - 4 bedrooms (%)
Bedrooms in renter-occupied houses - 5+ bedrooms (%)
Vehicles available in owner-occupied houses - no vehicle available (%)
Vehicles available in owner-occupied houses - 1 vehicle available(%)
Vehicles available in owner-occupied houses - 2 Vehicles available (%)
Vehicles available in owner-occupied houses - 3 Vehicles available (%)
Vehicles available in owner-occupied houses - 4 Vehicles available (%)
Vehicles available in owner-occupied houses - 5+ Vehicles available (%)
Vehicles available in renter-occupied houses - no vehicle available (%)
Vehicles available in renter-occupied houses - 1 vehicle available (%)
Vehicles available in renter-occupied houses - 2 Vehicles available (%)
Vehicles available in renter-occupied houses - 3 Vehicles available (%)
Vehicles available in renter-occupied houses - 4 Vehicles available (%)
Vehicles available in renter-occupied houses - 5+ Vehicles available (%)
Housing units in structures - 1, detached (%)
Housing units in structures - 1, attached (%)
Housing units in structures - 2 (%)
Housing units in structures - 3 or 4 (%)
Housing units in structures - 5 to 9 (%)
Housing units in structures - 10 to 19 (%)
Housing units in structures - 20 to 49 (%)
Housing units in structures - 50 or more (%)
Housing units in structures - Mobile home (%)
Housing units in structures - Boat, RV, van, etc. (%)
Housing units in structures - Owners - 1, detached (%)
Housing units in structures - Owners - 1, attached (%)
Housing units in structures - Owners - 2 (%)
Housing units in structures - Owners - 3 or 4 (%)
Housing units in structures - Owners - 5 to 9 (%)
Housing units in structures - Owners - 10 to 19 (%)
Housing units in structures - Owners - 20 to 49 (%)
Housing units in structures - Owners - 50 or more (%)
Housing units in structures - Owners - Mobile home (%)
Housing units in structures - Owners - Boat, RV, van, etc. (%)
Housing units in structures - Renters - 1, detached (%)
Housing units in structures - Renters - 1, attached (%)
Housing units in structures - Renters - 2 (%)
Housing units in structures - Renters - 3 or 4 (%)
Housing units in structures - Renters - 5 to 9 (%)
Housing units in structures - Renters - 10 to 19 (%)
Housing units in structures - Renters - 20 to 49 (%)
Housing units in structures - Renters - 50 or more (%)
Housing units in structures - Renters - Mobile home (%)
Housing units in structures - Renters - Boat, RV, van, etc. (%)
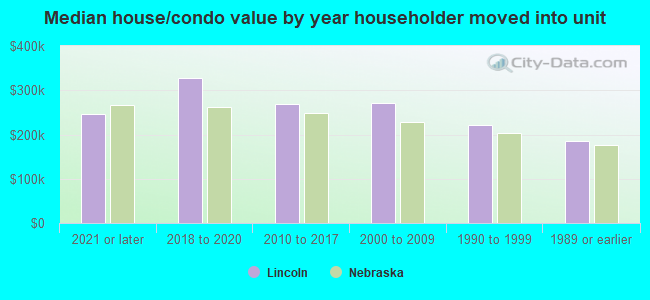
House/condo owner moved in on average (years ago)
Renter moved in on average (years ago)
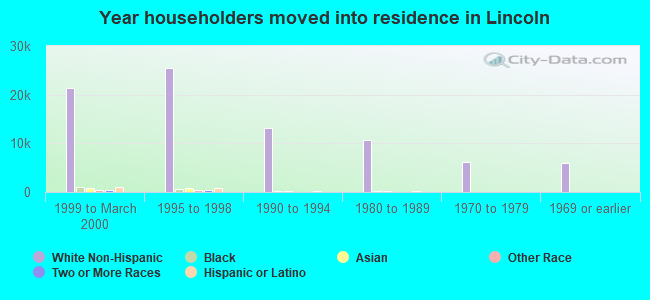
Year householder moved into unit - Moved in 1999 to March 2000 (%)
Year householder moved into unit - Moved in 1999 to March 2000 (%) - White
Year householder moved into unit - Moved in 1999 to March 2000 (%) - Black or African American
Year householder moved into unit - Moved in 1999 to March 2000 (%) - Asian
Year householder moved into unit - Moved in 1999 to March 2000 (%) - Hispanic or Latino
Year householder moved into unit - Moved in 1999 to March 2000 (%) - American Indian and Alaska Native
Year householder moved into unit - Moved in 1999 to March 2000 (%) - Multirace
Year householder moved into unit - Moved in 1999 to March 2000 (%) - Other Race
Year householder moved into unit - Moved in 1995 to 1998 (%)
Year householder moved into unit - Moved in 1995 to 1998 (%) - White
Year householder moved into unit - Moved in 1995 to 1998 (%) - Black or African American
Year householder moved into unit - Moved in 1995 to 1998 (%) - Asian
Year householder moved into unit - Moved in 1995 to 1998 (%) - Hispanic or Latino
Year householder moved into unit - Moved in 1995 to 1998 (%) - American Indian and Alaska Native
Year householder moved into unit - Moved in 1995 to 1998 (%) - Multirace
Year householder moved into unit - Moved in 1995 to 1998 (%) - Other Race
Year householder moved into unit - Moved in 1990 to 1994 (%)
Year householder moved into unit - Moved in 1990 to 1994 (%) - White
Year householder moved into unit - Moved in 1990 to 1994 (%) - Black or African American
Year householder moved into unit - Moved in 1990 to 1994 (%) - Asian
Year householder moved into unit - Moved in 1990 to 1994 (%) - Hispanic or Latino
Year householder moved into unit - Moved in 1990 to 1994 (%) - American Indian and Alaska Native
Year householder moved into unit - Moved in 1990 to 1994 (%) - Multirace
Year householder moved into unit - Moved in 1990 to 1994 (%) - Other Race
Year householder moved into unit - Moved in 1980 to 1989 (%)
Year householder moved into unit - Moved in 1980 to 1989 (%) - White
Year householder moved into unit - Moved in 1980 to 1989 (%) - Black or African American
Year householder moved into unit - Moved in 1980 to 1989 (%) - Asian
Year householder moved into unit - Moved in 1980 to 1989 (%) - Hispanic or Latino
Year householder moved into unit - Moved in 1980 to 1989 (%) - American Indian and Alaska Native
Year householder moved into unit - Moved in 1980 to 1989 (%) - Multirace
Year householder moved into unit - Moved in 1980 to 1989 (%) - Other Race
Year householder moved into unit - Moved in 1970 to 1979 (%)
Year householder moved into unit - Moved in 1970 to 1979 (%) - White
Year householder moved into unit - Moved in 1970 to 1979 (%) - Black or African American
Year householder moved into unit - Moved in 1970 to 1979 (%) - Asian
Year householder moved into unit - Moved in 1970 to 1979 (%) - Hispanic or Latino
Year householder moved into unit - Moved in 1970 to 1979 (%) - American Indian and Alaska Native
Year householder moved into unit - Moved in 1970 to 1979 (%) - Multirace
Year householder moved into unit - Moved in 1970 to 1979 (%) - Other Race
Year householder moved into unit - Moved in 1969 or earlier (%)
Year householder moved into unit - Moved in 1969 or earlier (%) - White
Year householder moved into unit - Moved in 1969 or earlier (%) - Black or African American
Year householder moved into unit - Moved in 1969 or earlier (%) - Asian
Year householder moved into unit - Moved in 1969 or earlier (%) - Hispanic or Latino
Year householder moved into unit - Moved in 1969 or earlier (%) - American Indian and Alaska Native
Year householder moved into unit - Moved in 1969 or earlier (%) - Multirace
Year householder moved into unit - Moved in 1969 or earlier (%) - Other Race
Housing units lacking complete plumbing facilities (%)
Housing units lacking complete kitchen facilities (%)
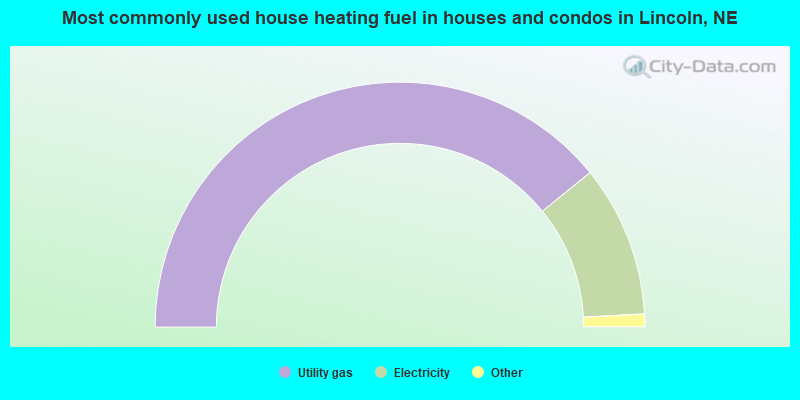
House heating fuel used in houses and condos - Utility gas (%)
House heating fuel used in houses and condos - Bottled, tank, or LP gas (%)
House heating fuel used in houses and condos - Electricity (%)
House heating fuel used in houses and condos - Fuel oil, kerosene, etc. (%)
House heating fuel used in houses and condos - Coal or coke (%)
House heating fuel used in houses and condos - Wood (%)
House heating fuel used in houses and condos - Solar energy (%)
House heating fuel used in houses and condos - Other fuel (%)
House heating fuel used in houses and condos - No fuel used (%)
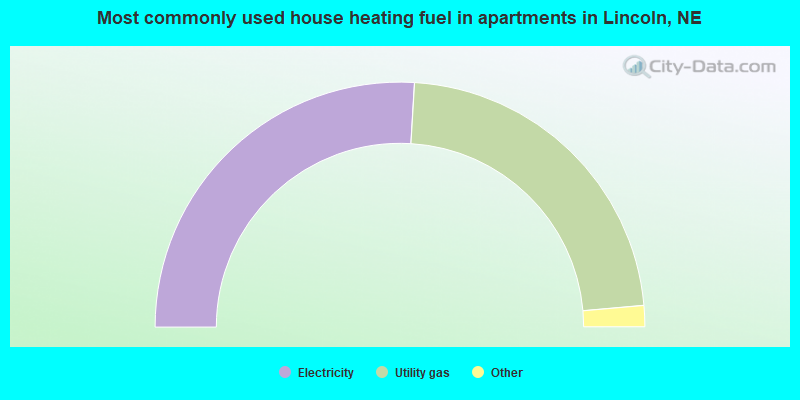
House heating fuel used in apartments - Utility gas (%)
House heating fuel used in apartments - Bottled, tank, or LP gas (%)
House heating fuel used in apartments - Electricity (%)
House heating fuel used in apartments - Fuel oil, kerosene, etc. (%)
House heating fuel used in apartments - Coal or coke (%)
House heating fuel used in apartments - Wood (%)
House heating fuel used in apartments - Solar energy (%)
House heating fuel used in apartments - Other fuel (%)
House heating fuel used in apartments - No fuel used (%)
Latest news about housing in Lincoln, NE collected exclusively by city-data.com from local newspapers, TV, and radio stations
Median year house/condo built: 1982Median year apartment built: 1985Household type by relationship:
Households: 292,623
Male householders: 61,866 (19,867 living alone ), Female householders: 60,055 (22,029 living alone )50,318 spouses (50,174 opposite-sex spouses ), 9,924 unmarried partners , (9,721 opposite-sex unmarried partners ), 75,807 children (69,888 natural , 2,216 adopted , 3,703 stepchildren ), 2,030 grandchildren , 2,581 brothers or sisters , 2,439 parents , 287 foster children , 2,644 other relatives , 12,000 non-relatives In group quarters: 12,672
Size of family households: 30,349 2-persons , 15,447 3-persons , 11,180 4-persons , 4,898 5-persons , 2,998 6-persons , 1,098 7-or-more-persons .
Size of nonfamily households: 41,896 1-person , 12,576 2-persons , 684 3-persons , 497 4-persons , 298 5-persons .
42,844 married couples with children. single-parent households (4,944 men , 10,020 women ).
87.4% of residents of Lincoln speak English at home. of residents speak Spanish at home (62% speak English very well , 22% speak English well , 9% speak English not well , 7% don't speak English at all ).of residents speak other Indo-European language at home (67% speak English very well , 19% speak English well , 12% speak English not well , 2% don't speak English at all ).of residents speak Asian or Pacific Island language at home (50% speak English very well , 29% speak English well , 15% speak English not well , 6% don't speak English at all ).of residents speak other language at home (76% speak English very well , 13% speak English well , 7% speak English not well , 4% don't speak English at all ).
Foreign born population: 23,550 (8.0%)of them are naturalized citizens )
Median number of rooms in houses and condos:
Median number of rooms in apartments
Owner-occupied Renter-occupied
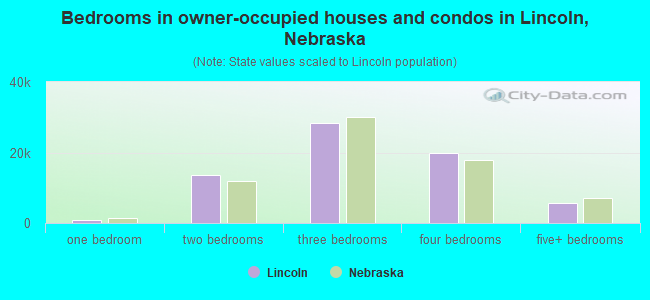
Bedrooms in owner-occupied houses and condos in Lincoln, Nebraska
260 no bedroom 908 1 bedroom 13,592 2 bedrooms 28,416 3 bedrooms 19,766 4 bedrooms 5,591 5+ bedrooms
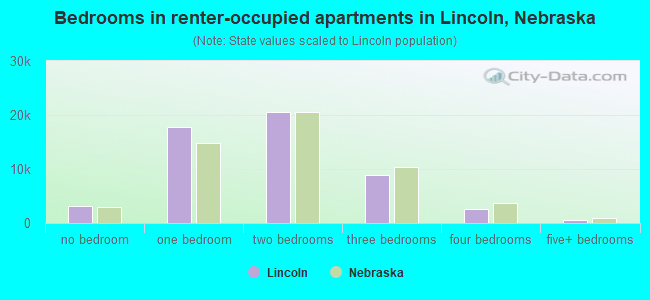
Bedrooms in renter-occupied apartments in Lincoln, Nebraska
3,166 no bedroom 17,729 1 bedroom 20,579 2 bedrooms 8,804 3 bedrooms 2,596 4 bedrooms 514 5+ bedrooms
Owner-occupied Renter-occupied
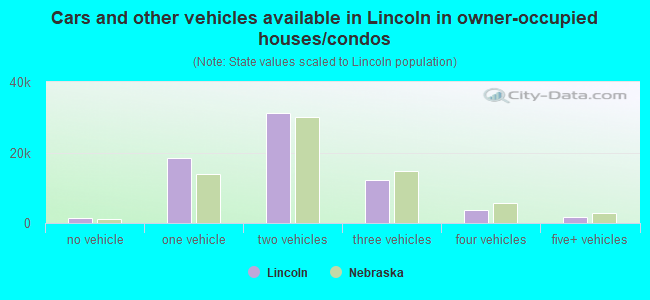
Cars and other vehicles available in Lincoln in owner-occupied houses/condos
1,290 no vehicle 18,548 1 vehicle 31,259 2 vehicles 12,111 3 vehicles 3,713 4 vehicles 1,612 5+ vehicles
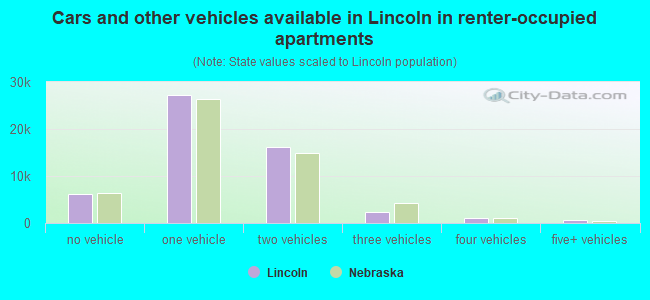
Cars and other vehicles available in Lincoln in renter-occupied apartments
6,174 no vehicle 27,172 1 vehicle 16,174 2 vehicles 2,243 3 vehicles 986 4 vehicles 639 5+ vehicles
Owner-occupied Renter-occupied
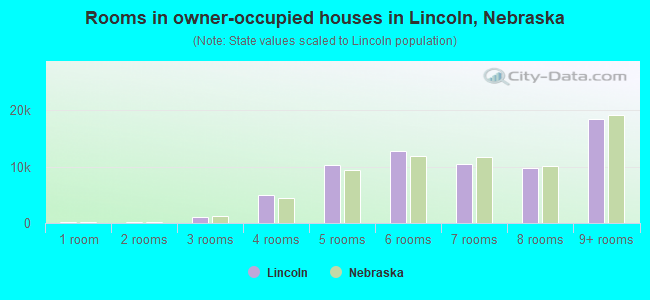
Rooms in owner-occupied houses in Lincoln, Nebraska
260 1 room 189 2 rooms 1,052 3 rooms 4,926 4 rooms 10,365 5 rooms 12,798 6 rooms 10,548 7 rooms 9,855 8 rooms 18,540 9+ rooms
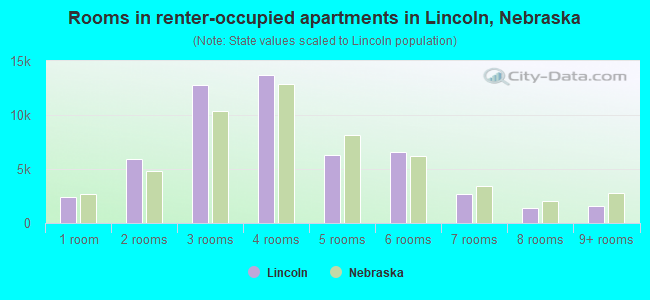
Rooms in renter-occupied apartments in Lincoln, Nebraska
2,381 1 room 5,953 2 rooms 12,805 3 rooms 13,734 4 rooms 6,303 5 rooms 6,570 6 rooms 2,662 7 rooms 1,366 8 rooms 1,614 9+ rooms
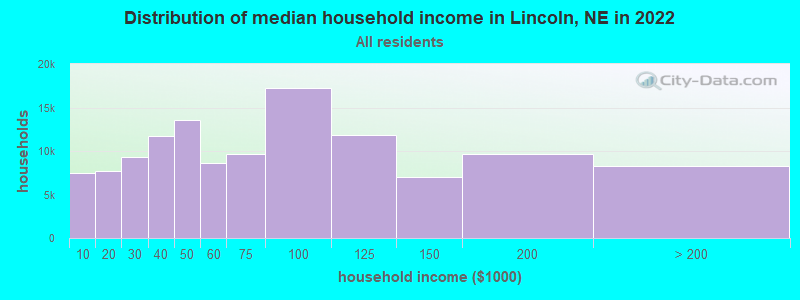
Lincoln, NE household income distribution 7,453 Less than $10,0007,657 $10,000 to $19,9999,257 $20,000 to $29,99911,702 $30,000 to $39,99913,551 $40,000 to $49,9998,619 $50,000 to $59,9999,651 $60,000 to $74,99917,216 $75,000 to $99,99911,869 $100,000 to $124,9996,991 $125,000 to $149,9999,639 $150,000 to $199,9998,316 $200,000 or more
Home value of owner - occupied houses in 2022 in Lincoln, NE 107 Less than $10,000484 $10,000 to $14,999540 $15,000 to $19,999120 $20,000 to $24,999850 $25,000 to $29,99977 $30,000 to $34,99939 $35,000 to $39,999290 $50,000 to $59,999175 $60,000 to $69,999126 $70,000 to $79,999545 $80,000 to $89,999681 $90,000 to $99,9993,666 $100,000 to $124,9992,896 $125,000 to $149,9994,781 $150,000 to $174,9995,199 $175,000 to $199,99912,637 $200,000 to $249,99910,135 $250,000 to $299,99912,858 $300,000 to $399,9996,604 $400,000 to $499,9994,014 $500,000 to $749,9991,108 $750,000 to $999,999149 $1,000,000 to $1,499,99999 $1,500,000 to $1,999,999353 $2,000,000 or moreRent paid by renters in 2022 in Lincoln, NE 262 $100 to $14981 $150 to $199312 $200 to $249434 $250 to $299235 $300 to $3491,126 $350 to $399728 $400 to $4491,375 $450 to $4992,669 $500 to $5493,359 $550 to $5992,013 $600 to $6493,270 $650 to $6991,364 $700 to $7493,225 $750 to $7996,933 $800 to $8996,059 $900 to $99910,435 $1,000 to $1,2494,006 $1,250 to $1,4993,006 $1,500 to $1,999413 $2,000 to $2,499479 $2,500 to $2,99937 $3,000 to $3,499198 $3,500 or more1,369 No cash rent
Percentage of workers working in this county: 94.1%Number of people working at home: 18,333 (11.6% of all workers )
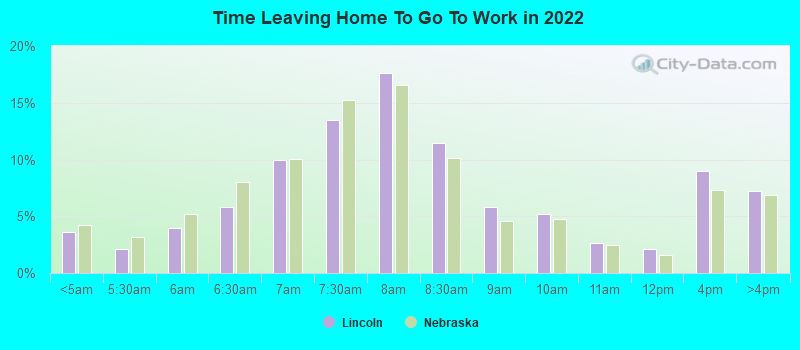
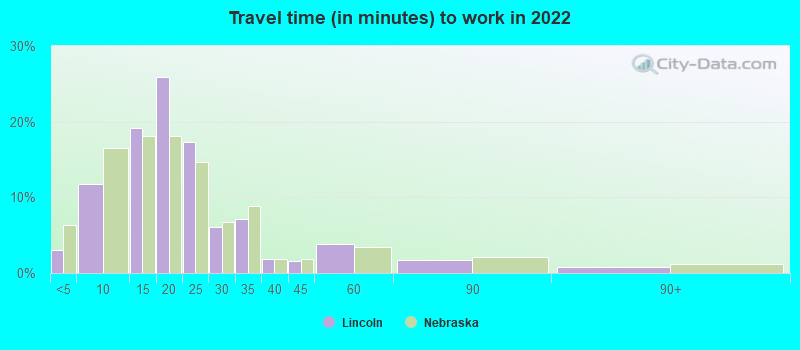
Travel time to work (commute)
Less than 5 minutes: 4,5165 to 9 minutes: 17,45410 to 14 minutes: 29,28015 to 19 minutes: 38,28120 to 24 minutes: 23,81925 to 29 minutes: 7,41530 to 34 minutes: 7,90635 to 39 minutes: 1,21840 to 44 minutes: 1,20045 to 59 minutes: 5,18060 to 89 minutes: 1,94490 or more minutes: 1,002
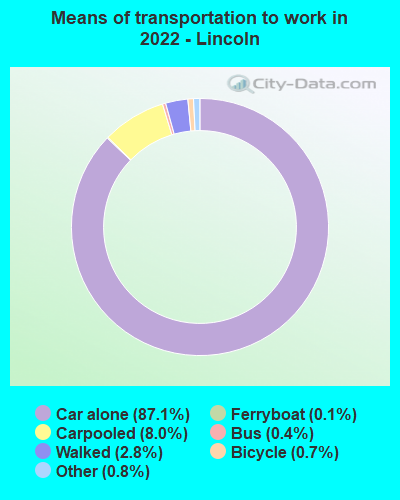
Means of transportation to work:
Drove a car alone: 131,758 (77.7%)Carpooled: 12,121 (7.1%)Bus : 597 (0.4%)Ferryboat: 172 (0.1%)Taxi: 1,233 (0.7%)Bicycle: 1,031 (0.6%)Walked: 4,282 (2.5%)Worked at home: 18,333 (10.8%)
Unemployment by race in 2022
Unemployment rate for White non-Hispanic residents 2.5% Males2.4% FemalesUnemployment rate for Black residents 6.7% Males6.4% FemalesUnemployment rate for American Indian and Alaska Native residents 11.7% FemalesUnemployment rate for Asian residents 1.7% Males2.1% FemalesUnemployment rate for other race residents 3.2% Males2.0% FemalesUnemployment rate for two or more race residents 4.2% Males2.6% FemalesUnemployment rate for Hispanic or Latino residents 0.9% Males12.0% Females
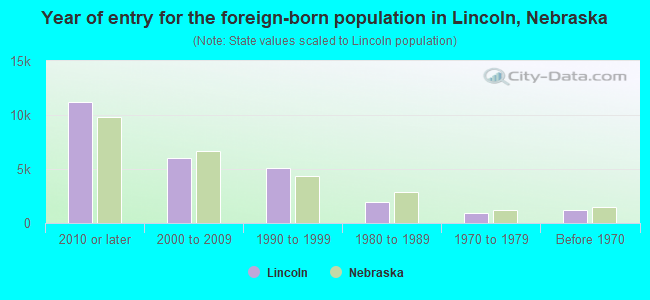
Year of entry for the foreign-born population in Lincoln, Nebraska
11,220 2010 or later 6,013 2000 to 2009 5,057 1990 to 1999 1,910 1980 to 1989 925 1970 to 1979 1,202 Before 1970
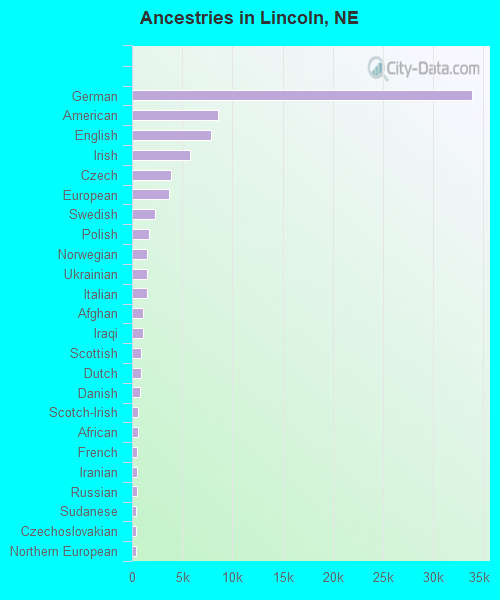
First ancestries reported:
German: 33,880 (28.1%)
American: 8,571 (7.1%)
English: 7,884 (6.5%)
Irish: 5,753 (4.8%)
Czech: 3,856 (3.2%)
European: 3,657 (3.0%)
Swedish: 2,281 (1.9%)
Polish: 1,659 (1.4%)
Norwegian: 1,530 (1.3%)
Ukrainian: 1,498 (1.2%)
Italian: 1,453 (1.2%)
Afghan: 1,116 (0.9%)
Iraqi: 1,099 (0.9%)
Scottish: 900 (0.7%)
Dutch: 867 (0.7%)
Danish: 821 (0.7%)
Scotch-Irish: 612 (0.5%)
African: 588 (0.5%)
French: 517 (0.4%)
Iranian: 471 (0.4%)
Russian: 454 (0.4%)
Sudanese: 398 (0.3%)
Czechoslovakian: 383 (0.3%)
Northern European: 354 (0.3%)
Welsh: 296 (0.2%)
British: 291 (0.2%)
Scandinavian: 241 (0.2%)
Hungarian: 224 (0.2%)
Haitian: 223 (0.2%)
Arab: 219 (0.2%)
Nigerian: 199 (0.2%)
British West Indian: 177 (0.1%)
Greek: 149 (0.1%)
Yugoslavian: 142 (0.1%)
German Russian: 142 (0.1%)
Eastern European: 140 (0.1%)
Canadian: 124 (0.1%)
Lebanese: 123 (0.1%)
French Canadian: 114 (0.09%)
Latvian: 111 (0.09%)
Ethiopian: 109 (0.09%)
Austrian: 104 (0.09%)
Romanian: 94 (0.08%)
Brazilian: 93 (0.08%)
Ghanaian: 84 (0.07%)
Swiss: 83 (0.07%)
Portuguese: 83 (0.07%)
Kenyan: 81 (0.07%)
Armenian: 71 (0.06%)
Slavic: 67 (0.06%)
Somali: 60 (0.05%)
Pennsylvania German: 56 (0.05%)
Jamaican: 56 (0.05%)
Serbian: 47 (0.04%)
Lithuanian: 46 (0.04%)
West Indian: 42 (0.03%)
Liberian: 41 (0.03%)
Luxembourger: 36 (0.03%)
Albanian: 32 (0.03%)
Finnish: 30 (0.02%)
Ugandan: 27 (0.02%)
Jordanian: 26 (0.02%)
Slovak: 23 (0.02%)
Bulgarian: 20 (0.02%)
Macedonian: 19 (0.02%)
Trinidadian and Tobagonian: 16 (0.01%)
Syrian: 15 (0.01%)
Croatian: 11 (0.01%)
Moroccan: 7 (0.01%)
Egyptian: 7 (0.01%)
Most common places of birth for foreign-born residents (%): Mexico Lincoln:
13.3% (3,609)Nebraska:
31.7% (46,610)
Vietnam Lincoln:
11.6% (3,138)Nebraska:
4.0% (5,832)
Iraq Lincoln:
9.7% (2,612)Nebraska:
2.2% (3,173)
India Lincoln:
5.6% (1,505)Nebraska:
4.2% (6,118)
China, excluding Hong Kong and Taiwan Lincoln:
4.2% (1,145)Nebraska:
2.6% (3,808)
Thailand Lincoln:
3.1% (847)Nebraska:
2.2% (3,167)
Ukraine Lincoln:
2.9% (798)Nebraska:
0.8% (1,220)
Afghanistan Lincoln:
2.9% (772)Nebraska:
0.8% (1,228)
Burma (Myanmar) Lincoln:
2.8% (763)Nebraska:
2.7% (3,951)
El Salvador Lincoln:
2.8% (758)Nebraska:
3.7% (5,421)
Guatemala Lincoln:
2.7% (721)Nebraska:
7.2% (10,604)
Philippines Lincoln:
2.3% (611)Nebraska:
2.2% (3,185)
Korea Lincoln:
2.2% (588)Nebraska:
1.6% (2,312)
Brazil Lincoln:
1.9% (524)Nebraska:
0.6% (827)
Malaysia Lincoln:
1.8% (493)Nebraska:
0.5% (700)
Sudan Lincoln:
1.8% (483)Nebraska:
1.7% (2,482)
Place of birth for U.S.-born residents:
This state: 186,993Other state: 79,407Northeast: 3,820Midwest: 36,534South: 16,632West: 22,421 82.2% of Lincoln residents lived in the same house 1 years ago.
Out of people who lived in different houses, 36.4% lived in this county.
Out of people who lived in different counties, 48.7% lived in Nebraska.
Lincoln:
82.2%State average:
87.4%
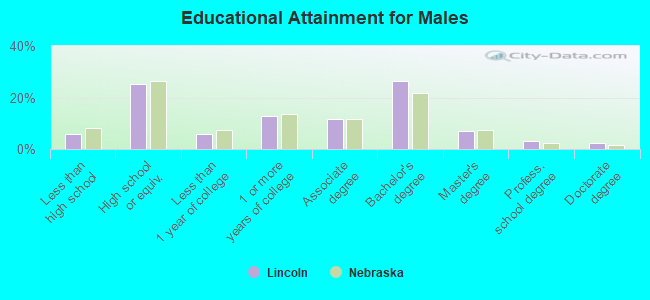
Education attainment for males 25 years and older:
No schooling: 1,818Nursery to 4th grade: 465th and 6th grade: 5347th and 8th grade: 1229th grade: 26710th grade: 33511th grade: 83912th grade, no diploma: 1,470High school graduate (or equivalency): 22,895Less than 1 year of college: 5,378Some college more than 1 year, no degree: 11,551Associate degree: 10,699Bachelor's degree: 23,946Master's degree: 6,531Professional school degree: 2,714Doctorate degree: 1,982
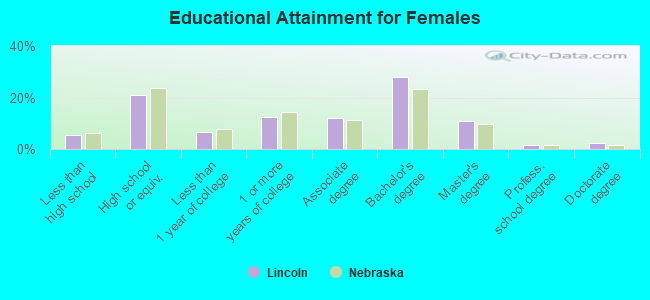
Education attainment for females 25 years and older:
No schooling: 1,748Nursery to 4th grade: 1145th and 6th grade: 707th and 8th grade: 2199th grade: 9310th grade: 90311th grade: 70312th grade, no diploma: 1,110High school graduate (or equivalency): 19,141Less than 1 year of college: 5,914Some college more than 1 year, no degree: 11,575Associate degree: 11,197Bachelor's degree: 25,533Master's degree: 9,825Professional school degree: 1,602Doctorate degree: 2,175
Housing units in structures:
One, detached: 71,130One, attached: 10,473Two: 4,5583 or 4: 3,0405 to 9: 7,84910 to 19: 11,42920 to 49: 8,58050 or more: 9,770Mobile homes: 1,961Median worth of mobile homes: $27,100
Housing units lacking complete plumbing facilities in 2022: 1.0%Housing units lacking complete kitchen facilities in 2022: 1.5%House/condo owner moved in on average 10 years ago
Renter moved in on average 2 years ago
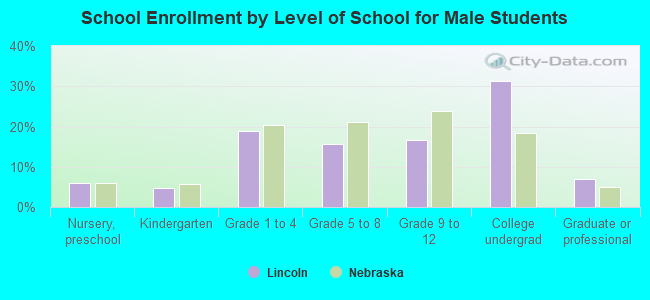
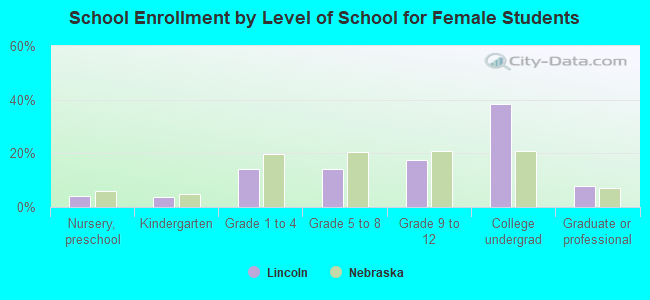
Private vs. public school enrollment:
Students in private schools in grades 1 to 8 (elementary and middle school): 4,357 Students in private schools in grades 9 to 12 (high school): 1,115 Students in private undergraduate colleges: 3,088