Races in Lincoln, Nebraska (NE) Detailed Stats
Data:
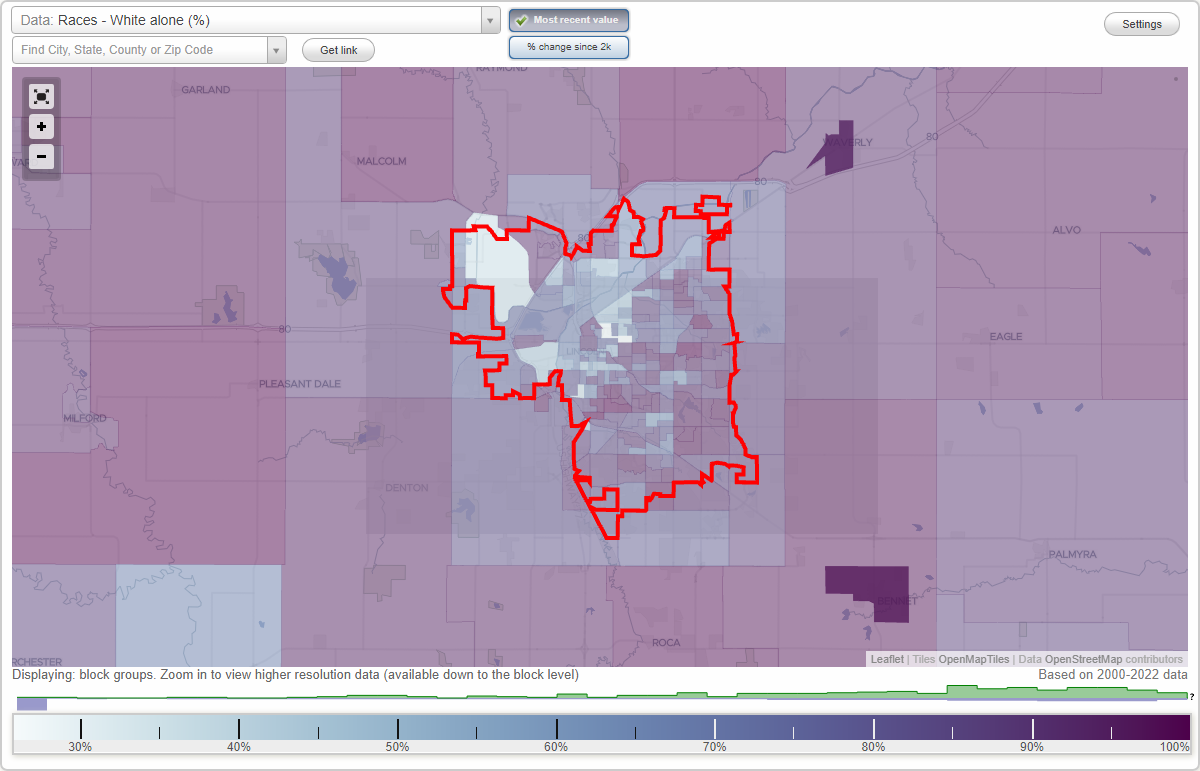
Races - White alone (%)
Races - White alone (% change since 2000)
Races - Black alone (%)
Races - Black alone (% change since 2000)
Races - American Indian alone (%)
Races - American Indian alone (% change since 2000)
Races - Asian alone (%)
Races - Asian alone (% change since 2000)
Races - Hispanic (%)
Races - Hispanic (% change since 2000)
Races - Native Hawaiian and Other Pacific Islander alone (%)
Races - Native Hawaiian and Other Pacific Islander alone (% change since 2000)
Races - Two or more races(%)
Races - Two or more races(% change since 2000)
Races - Other race alone (%)
Races - Other race alone (% change since 2000)
Racial diversity
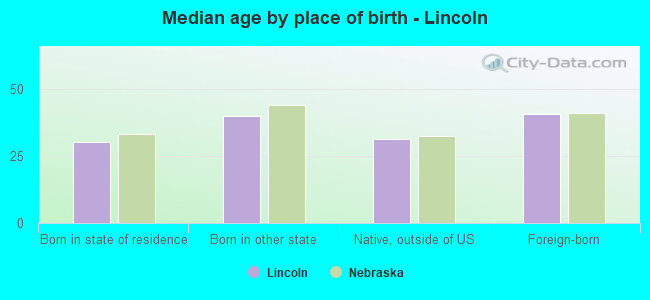
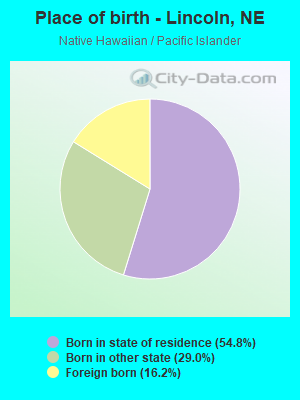
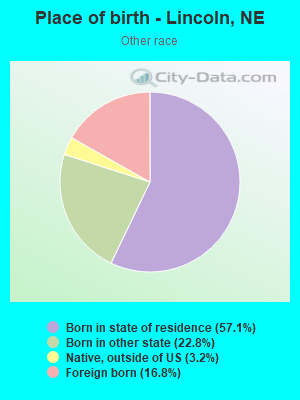
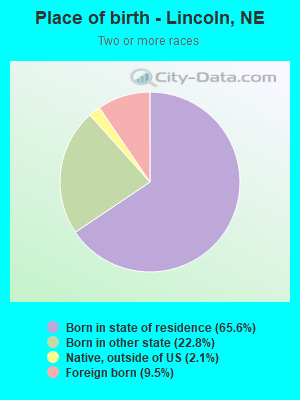
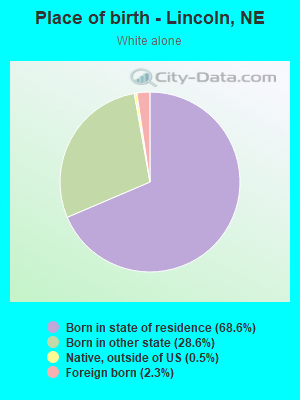
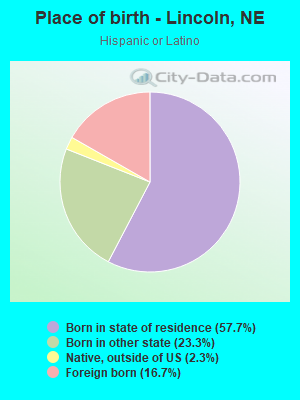
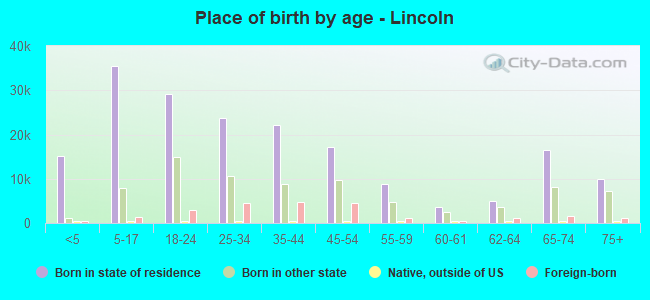
Place of birth - Born in state of residence (%)
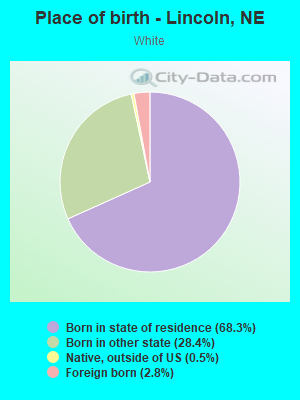
Place of birth - Born in state of residence (%) - White
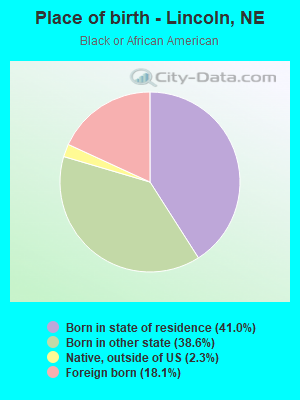
Place of birth - Born in state of residence (%) - Black or African American
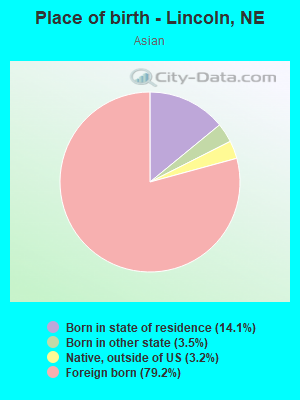
Place of birth - Born in state of residence (%) - Asian
Place of birth - Born in state of residence (%) - Hispanic or Latino
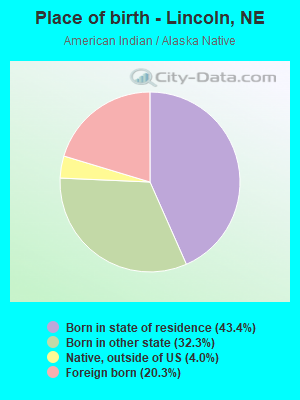
Place of birth - Born in state of residence (%) - American Indian and Alaska Native
Place of birth - Born in state of residence (%) - Multirace
Place of birth - Born in state of residence (%) - Other Race
Place of birth - Born in other state (%)
Place of birth - Born in other state (%) - White
Place of birth - Born in other state (%) - Black or African American
Place of birth - Born in other state (%) - Asian
Place of birth - Born in other state (%) - Hispanic or Latino
Place of birth - Born in other state (%) - American Indian and Alaska Native
Place of birth - Born in other state (%) - Multirace
Place of birth - Born in other state (%) - Other Race
Place of birth - Native, outside of US (%)
Place of birth - Native, outside of US (%) - White
Place of birth - Native, outside of US (%) - Black or African American
Place of birth - Native, outside of US (%) - Asian
Place of birth - Native, outside of US (%) - Hispanic or Latino
Place of birth - Native, outside of US (%) - American Indian and Alaska Native
Place of birth - Native, outside of US (%) - Multirace
Place of birth - Native, outside of US (%) - Other Race
Place of birth - Foreign born (%)
Place of birth - Foreign born (%) - White
Place of birth - Foreign born (%) - Black or African American
Place of birth - Foreign born (%) - Asian
Place of birth - Foreign born (%) - Hispanic or Latino
Place of birth - Foreign born (%) - American Indian and Alaska Native
Place of birth - Foreign born (%) - Multirace
Place of birth - Foreign born (%) - Other Race
Residents speaking English at home (%)
Residents speaking English at home - Born in the United States (%)
Residents speaking English at home - Native, born elsewhere (%)
Residents speaking English at home - Foreign born (%)
Residents speaking Spanish at home (%)
Residents speaking Spanish at home - Born in the United States (%)
Residents speaking Spanish at home - Native, born elsewhere (%)
Residents speaking Spanish at home - Foreign born (%)
Residents speaking other language at home (%)
Residents speaking other language at home - Born in the United States (%)
Residents speaking other language at home - Native, born elsewhere (%)
Residents speaking other language at home - Foreign born (%)
Marital status - Never married (%)
Marital status - Now married (%)
Marital status - Separated (%)
Marital status - Widowed (%)
Marital status - Divorced (%)
Ancestries Reported - Arab (%)
Ancestries Reported - Czech (%)
Ancestries Reported - Danish (%)
Ancestries Reported - Dutch (%)
Ancestries Reported - English (%)
Ancestries Reported - French (%)
Ancestries Reported - French Canadian (%)
Ancestries Reported - German (%)
Ancestries Reported - Greek (%)
Ancestries Reported - Hungarian (%)
Ancestries Reported - Irish (%)
Ancestries Reported - Italian (%)
Ancestries Reported - Lithuanian (%)
Ancestries Reported - Norwegian (%)
Ancestries Reported - Polish (%)
Ancestries Reported - Portuguese (%)
Ancestries Reported - Russian (%)
Ancestries Reported - Scotch-Irish (%)
Ancestries Reported - Scottish (%)
Ancestries Reported - Slovak (%)
Ancestries Reported - Subsaharan African (%)
Ancestries Reported - Swedish (%)
Ancestries Reported - Swiss (%)
Ancestries Reported - Ukrainian (%)
Ancestries Reported - United States (%)
Ancestries Reported - Welsh (%)
Ancestries Reported - West Indian (%)
Ancestries Reported - Other (%)
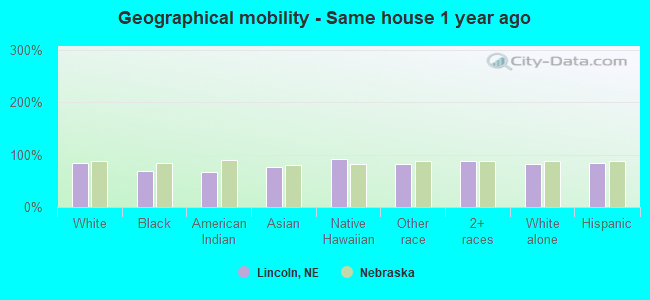
Geographical mobility - Same house 1 year ago (%)
Geographical mobility - Same house 1 year ago (%) - White
Geographical mobility - Same house 1 year ago (%) - Black or African American
Geographical mobility - Same house 1 year ago (%) - Asian
Geographical mobility - Same house 1 year ago (%) - Hispanic or Latino
Geographical mobility - Same house 1 year ago (%) - American Indian and Alaska Native
Geographical mobility - Same house 1 year ago (%) - Multirace
Geographical mobility - Same house 1 year ago (%) - Other Race
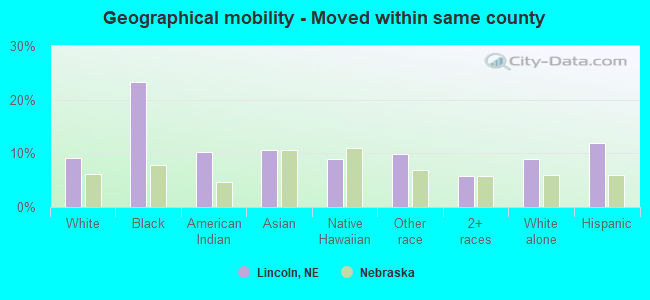
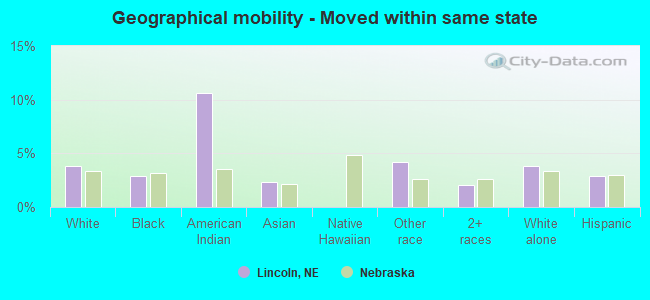
Geographical mobility - Moved within same county (%)
Geographical mobility - Moved within same county (%) - White
Geographical mobility - Moved within same county (%) - Black or African American
Geographical mobility - Moved within same county (%) - Asian
Geographical mobility - Moved within same county (%) - Hispanic or Latino
Geographical mobility - Moved within same county (%) - American Indian and Alaska Native
Geographical mobility - Moved within same county (%) - Multirace
Geographical mobility - Moved within same county (%) - Other Race
Geographical mobility - Moved from different county within same state (%)
Geographical mobility - Moved from different county within same state (%) - White
Geographical mobility - Moved from different county within same state (%) - Black or African American
Geographical mobility - Moved from different county within same state (%) - Asian
Geographical mobility - Moved from different county within same state (%) - Hispanic or Latino
Geographical mobility - Moved from different county within same state (%) - American Indian and Alaska Native
Geographical mobility - Moved from different county within same state (%) - Multirace
Geographical mobility - Moved from different county within same state (%) - Other Race
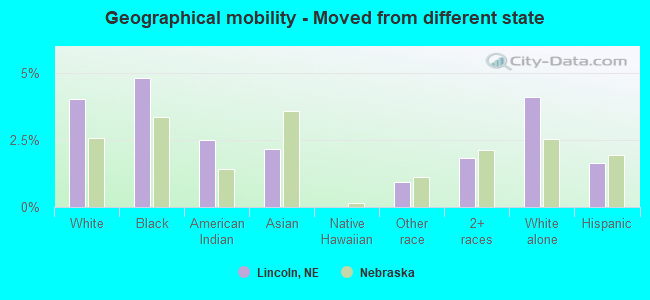
Geographical mobility - Moved from different state (%)
Geographical mobility - Moved from different state (%) - White
Geographical mobility - Moved from different state (%) - Black or African American
Geographical mobility - Moved from different state (%) - Asian
Geographical mobility - Moved from different state (%) - Hispanic or Latino
Geographical mobility - Moved from different state (%) - American Indian and Alaska Native
Geographical mobility - Moved from different state (%) - Multirace
Geographical mobility - Moved from different state (%) - Other Race
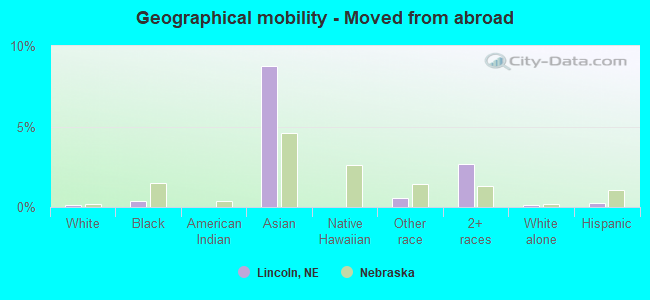
Geographical mobility - Moved from abroad (%)
Geographical mobility - Moved from abroad (%) - White
Geographical mobility - Moved from abroad (%) - Black or African American
Geographical mobility - Moved from abroad (%) - Asian
Geographical mobility - Moved from abroad (%) - Hispanic or Latino
Geographical mobility - Moved from abroad (%) - American Indian and Alaska Native
Geographical mobility - Moved from abroad (%) - Multirace
Geographical mobility - Moved from abroad (%) - Other Race
Place of birth for the foreign-born population - Ireland (%)
Place of birth for the foreign-born population - Denmark (%)
Place of birth for the foreign-born population - Norway (%)
Place of birth for the foreign-born population - Sweden (%)
Place of birth for the foreign-born population - United Kingdom (%)
Place of birth for the foreign-born population - England (%)
Place of birth for the foreign-born population - Scotland (%)
Place of birth for the foreign-born population - Other Northern Europe (%)
Place of birth for the foreign-born population - Austria (%)
Place of birth for the foreign-born population - Belgium (%)
Place of birth for the foreign-born population - France (%)
Place of birth for the foreign-born population - Germany (%)
Place of birth for the foreign-born population - Netherlands (%)
Place of birth for the foreign-born population - Switzerland (%)
Place of birth for the foreign-born population - Other Western Europe (%)
Place of birth for the foreign-born population - Greece (%)
Place of birth for the foreign-born population - Italy (%)
Place of birth for the foreign-born population - Portugal (%)
Place of birth for the foreign-born population - Spain (%)
Place of birth for the foreign-born population - Other Southern Europe (%)
Place of birth for the foreign-born population - Albania (%)
Place of birth for the foreign-born population - Belarus (%)
Place of birth for the foreign-born population - Bosnia and Herzegovina (%)
Place of birth for the foreign-born population - Bulgaria (%)
Place of birth for the foreign-born population - Croatia (%)
Place of birth for the foreign-born population - Czechoslovakia (%)
Place of birth for the foreign-born population - Hungary (%)
Place of birth for the foreign-born population - Latvia (%)
Place of birth for the foreign-born population - Lithuania (%)
Place of birth for the foreign-born population - North Macedonia (Macedonia) (%)
Place of birth for the foreign-born population - Moldova (%)
Place of birth for the foreign-born population - Poland (%)
Place of birth for the foreign-born population - Romania (%)
Place of birth for the foreign-born population - Russia (%)
Place of birth for the foreign-born population - Serbia (%)
Place of birth for the foreign-born population - Ukraine (%)
Place of birth for the foreign-born population - Other Eastern Europe (%)
Place of birth for the foreign-born population - China (%)
Place of birth for the foreign-born population - Hong Kong (%)
Place of birth for the foreign-born population - Taiwan (%)
Place of birth for the foreign-born population - Japan (%)
Place of birth for the foreign-born population - Korea (%)
Place of birth for the foreign-born population - Other Eastern Asia (%)
Place of birth for the foreign-born population - Afghanistan (%)
Place of birth for the foreign-born population - Bangladesh (%)
Place of birth for the foreign-born population - India (%)
Place of birth for the foreign-born population - Iran (%)
Place of birth for the foreign-born population - Kazakhstan (%)
Place of birth for the foreign-born population - Nepal (%)
Place of birth for the foreign-born population - Pakistan (%)
Place of birth for the foreign-born population - Sri Lanka (%)
Place of birth for the foreign-born population - Uzbekistan (%)
Place of birth for the foreign-born population - Other South Central Asia (%)
Place of birth for the foreign-born population - Burma (%)
Place of birth for the foreign-born population - Cambodia (%)
Place of birth for the foreign-born population - Indonesia (%)
Place of birth for the foreign-born population - Laos (%)
Place of birth for the foreign-born population - Malaysia (%)
Place of birth for the foreign-born population - Philippines (%)
Place of birth for the foreign-born population - Singapore (%)
Place of birth for the foreign-born population - Thailand (%)
Place of birth for the foreign-born population - Vietnam (%)
Place of birth for the foreign-born population - Other South Eastern Asia (%)
Place of birth for the foreign-born population - Armenia (%)
Place of birth for the foreign-born population - Iraq (%)
Place of birth for the foreign-born population - Israel (%)
Place of birth for the foreign-born population - Jordan (%)
Place of birth for the foreign-born population - Kuwait (%)
Place of birth for the foreign-born population - Lebanon (%)
Place of birth for the foreign-born population - Saudi Arabia (%)
Place of birth for the foreign-born population - Syria (%)
Place of birth for the foreign-born population - Turkey (%)
Place of birth for the foreign-born population - Yemen (%)
Place of birth for the foreign-born population - Other Western Asia (%)
Place of birth for the foreign-born population - Eritrea (%)
Place of birth for the foreign-born population - Ethiopia (%)
Place of birth for the foreign-born population - Kenya (%)
Place of birth for the foreign-born population - Somalia (%)
Place of birth for the foreign-born population - Uganda (%)
Place of birth for the foreign-born population - Zimbabwe (%)
Place of birth for the foreign-born population - Other Eastern Africa (%)
Place of birth for the foreign-born population - Cameroon (%)
Place of birth for the foreign-born population - Congo (%)
Place of birth for the foreign-born population - Democratic Republic of Congo (Zaire) (%)
Place of birth for the foreign-born population - Other Middle Africa (%)
Place of birth for the foreign-born population - Egypt (%)
Place of birth for the foreign-born population - Morocco (%)
Place of birth for the foreign-born population - Sudan (%)
Place of birth for the foreign-born population - Other Northern Africa (%)
Place of birth for the foreign-born population - South Africa (%)
Place of birth for the foreign-born population - Other Southern Africa (%)
Place of birth for the foreign-born population - Cabo Verde (%)
Place of birth for the foreign-born population - Ghana (%)
Place of birth for the foreign-born population - Liberia (%)
Place of birth for the foreign-born population - Nigeria (%)
Place of birth for the foreign-born population - Senegal (%)
Place of birth for the foreign-born population - Sierra Leone (%)
Place of birth for the foreign-born population - Other Western Africa (%)
Place of birth for the foreign-born population - Australia (%)
Place of birth for the foreign-born population - New Zealand (%)
Place of birth for the foreign-born population - Fiji (%)
Place of birth for the foreign-born population - Micronesia (%)
Place of birth for the foreign-born population - Bahamas (%)
Place of birth for the foreign-born population - Barbados (%)
Place of birth for the foreign-born population - Cuba (%)
Place of birth for the foreign-born population - Dominica (%)
Place of birth for the foreign-born population - Dominican Republic (%)
Place of birth for the foreign-born population - Grenada (%)
Place of birth for the foreign-born population - Haiti (%)
Place of birth for the foreign-born population - Jamaica (%)
Place of birth for the foreign-born population - St. Vincent and the Grenadines (%)
Place of birth for the foreign-born population - Trinidad and Tobago (%)
Place of birth for the foreign-born population - West Indies (%)
Place of birth for the foreign-born population - Other Caribbean (%)
Place of birth for the foreign-born population - Belize (%)
Place of birth for the foreign-born population - Costa Rica (%)
Place of birth for the foreign-born population - El Salvador (%)
Place of birth for the foreign-born population - Guatemala (%)
Place of birth for the foreign-born population - Honduras (%)
Place of birth for the foreign-born population - Mexico (%)
Place of birth for the foreign-born population - Nicaragua (%)
Place of birth for the foreign-born population - Panama (%)
Place of birth for the foreign-born population - Other Central America (%)
Place of birth for the foreign-born population - Argentina (%)
Place of birth for the foreign-born population - Bolivia (%)
Place of birth for the foreign-born population - Brazil (%)
Place of birth for the foreign-born population - Chile (%)
Place of birth for the foreign-born population - Colombia (%)
Place of birth for the foreign-born population - Ecuador (%)
Place of birth for the foreign-born population - Guyana (%)
Place of birth for the foreign-born population - Peru (%)
Place of birth for the foreign-born population - Uruguay (%)
Place of birth for the foreign-born population - Venezuela (%)
Place of birth for the foreign-born population - Other South America (%)
Place of birth for the foreign-born population - Canada (%)
Place of birth for the foreign-born population - Other Northern America (%)
Place of birth for the foreign-born population - Other (%)
Latest news about races in Lincoln, NE collected exclusively by city-data.com from local newspapers, TV, and radio stations
According to 2022 data, the most numerous races in Lincoln, NE are White alone (227,012 residents), Hispanic (25,895 residents), and Black alone (12,103 residents). 87.8% of Lincoln residents speak English at home. 9.2% of Lincoln, NE residents are foreign-born (4.8% born in Asia, 2.5% born in Latin America), which is 24.2% greater than the foreign-born rate of 7.0% across the entire state of Nebraska.
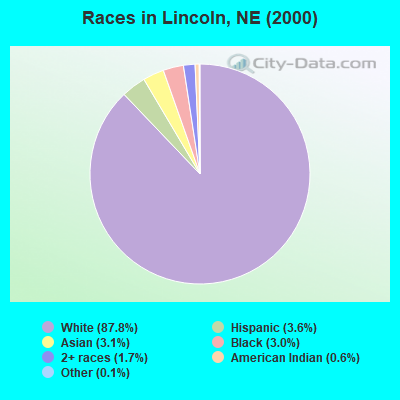
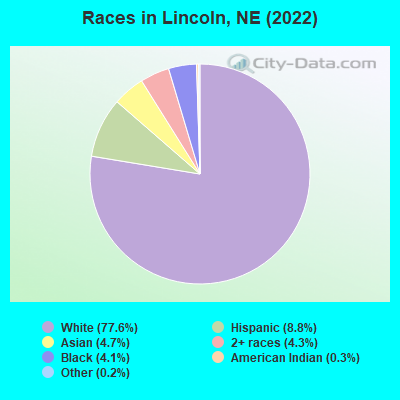
Race distribution in Lincoln
2000 2022
198,087 87.8% White alone 8,154 3.6% Hispanic 7,006 3.1% Asian alone 6,803 3.0% Black alone 3,724 1.7% Two or more races 1,354 0.6% American Indian alone 326 0.1% Other race alone 127 0.06% Native Hawaiian and Other
227,012 77.6% White alone 25,895 8.8% Hispanic 13,788 4.7% Asian alone 12,464 4.3% Two or more races 12,103 4.1% Black alone 881 0.3% American Indian alone 480 0.2% Other race alone
2000 2022
1,494,494 87.3% White alone 94,425 5.5% Hispanic 67,537 3.9% Black alone 21,677 1.3% Asian alone 17,696 1.0% Two or more races 13,460 0.8% American Indian alone 1,327 0.08% Other race alone 647 0.04% Native Hawaiian and Other
1,492,005 75.8% White alone 241,898 12.3% Hispanic 89,520 4.5% Black alone 76,499 3.9% Two or more races 49,261 2.5% Asian alone 10,249 0.5% American Indian alone 7,425 0.4% Other race alone 1,066 0.05% Native Hawaiian and Other
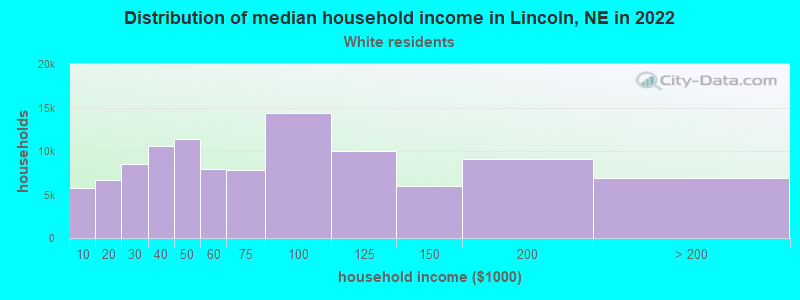
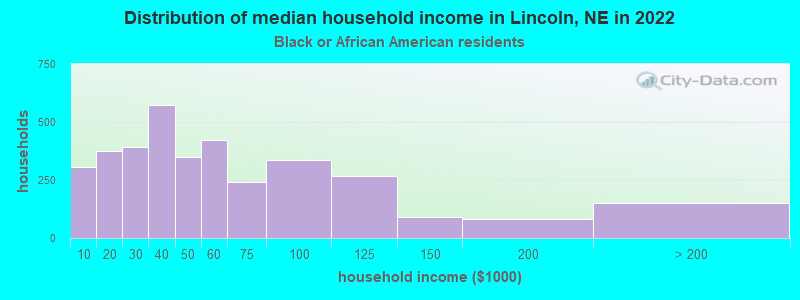
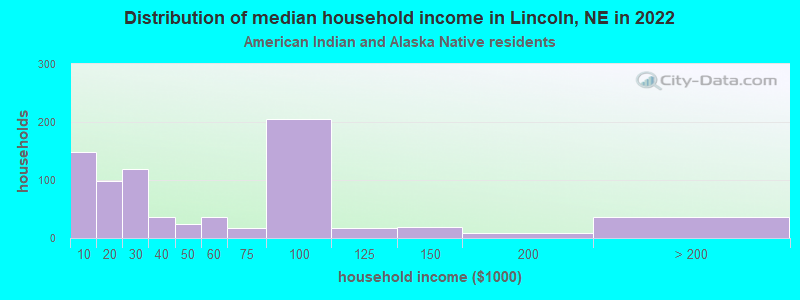
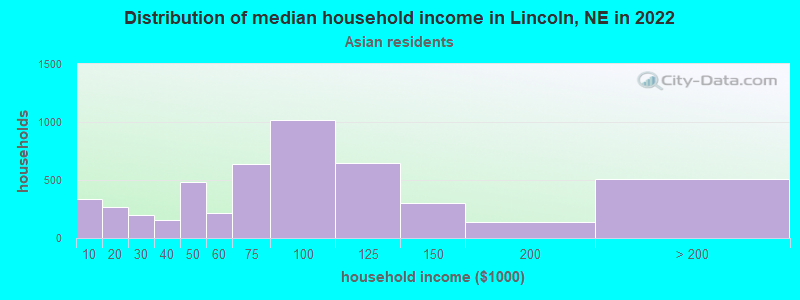
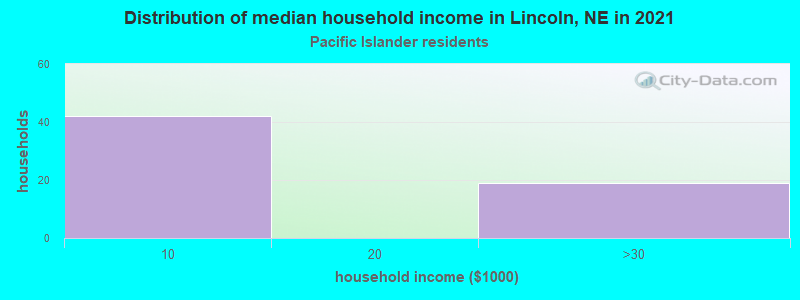
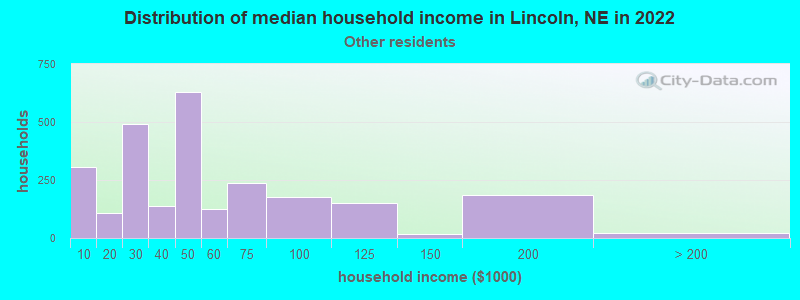
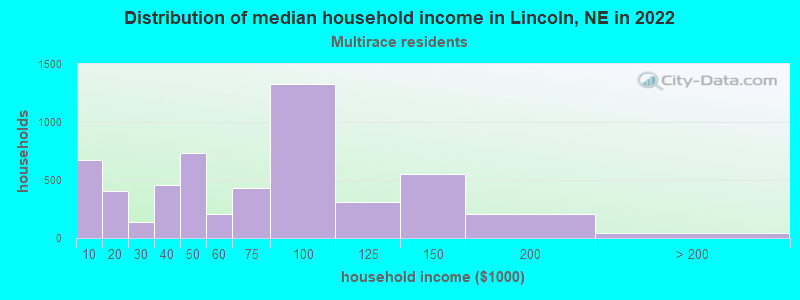
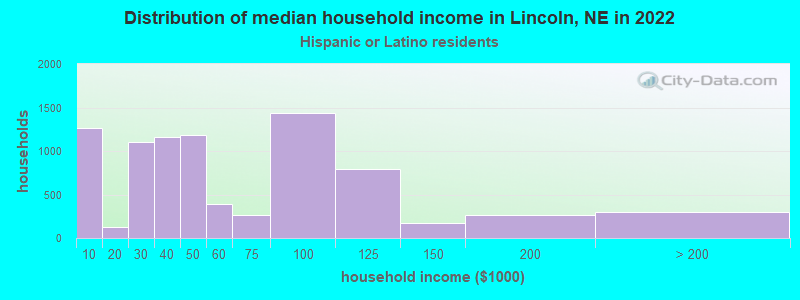
Income and house value in Lincoln Median household income in 2022 $62,264 White non-Hispanic householders$76,186 Black householders$27,872 American Indian and Alaska Native householders$85,588 Asian householders$44,559 Some other race householders$62,909 Two or more races householders$43,461 Hispanic or Latino race householdersMedian 2022 house value $262,735 White Non-Hispanic householders$255,200 Black or African American householders$217,774 American Indian or Alaska Native householders $257,962 Asian householders$214,759 Some other race householders$253,944 Two or more races householders$216,266 Hispanic or Latino householders
Median age by race in Lincoln
36.1 Median age for White residents35.4 37.3 25.8 Median age for Black or African American residents27.4 22.6 26.8 Median age for American Indian / Alaska Native residents32.1 26.7 32.0 Median age for Asian residents29.1 33.8 -666,666,666.0 Median age for Native Hawaiian / Pacific Islander residents-666,666,666.0 -666,666,666.0 26.1 Median age for Other race residents26.7 25.4 20.5 Median age for Two or more races residents20.3 21.5 36.9 Median age for White alone residents35.7 37.9 21.7 Median age for Hispanic or Latino residents20.8 22.6
Owner/renter occupied households by race in Lincoln
House owners and renters - White residents 60,434 57.5% Owner occupied44,692 42.5% Renter occupiedHouse owners and renters - Black or African American residents 1,499 43.2% Owner occupied1,968 56.8% Renter occupiedHouse owners and renters - American Indian / Alaska Native residents 226 23.5% Owner occupied737 76.5% Renter occupiedHouse owners and renters - Asian residents 2,402 50.7% Owner occupied2,335 49.3% Renter occupiedHouse owners and renters - Native Hawaiian / Pacific Islander residents 26 46.4% Owner occupied30 53.6% Renter occupiedHouse owners and renters - Other race residents 946 44.0% Owner occupied1,204 56.0% Renter occupiedHouse owners and renters - Two or more races residents 3,026 55.2% Owner occupied2,452 44.8% Renter occupiedHouse owners and renters - White alone residents 58,838 57.7% Owner occupied43,102 42.3% Renter occupiedHouse owners and renters - Hispanic or Latino residents 3,972 46.9% Owner occupied4,497 53.1% Renter occupied
Language usage in Lincoln
English speakers - Total 87.8% of residents of Lincoln speak English at home.
4.0% of residents speak Spanish at home 7,903 71.9% Speak English very well3,087 28.1% Speak English less than very well8.2% of residents speak other language at home 13,851 60.9% Speak English very well8,878 39.1% Speak English less than very well
English speakers - Born in the United States 95.1% of residents of Lincoln speak English at home.
2.9% of residents speak Spanish at home 1,924 85.7% Speak English very well320 14.3% Speak English less than very well2.0% of residents speak other language at home 1,339 85.1% Speak English very well234 14.9% Speak English less than very well
English speakers - Native, born elsewhere 56.6% of residents of Lincoln speak English at home.
19.4% of residents speak Spanish at home 484 100.0% Speak English very well24.0% of residents speak other language at home 541 90.5% Speak English very well57 9.5% Speak English less than very well
English speakers - Foreign-born 12.8% of residents of Lincoln speak English at home.
17.6% of residents speak Spanish at home 1,705 41.8% Speak English very well2,376 58.2% Speak English less than very well69.6% of residents speak other language at home 8,391 52.0% Speak English very well7,749 48.0% Speak English less than very well
White (Caucasian) - Speak only English Native:
96.7% (211,108)Foreign-born:
14.8% (996)
White (Caucasian) - Speak another language Native:
3.3% (7,309)Foreign-born:
85.2% (5,736)
Black or African American - Speak only English Native:
86.8% (7,782)Foreign-born:
9.4% (210)
Black or African American - Speak another language Native:
13.2% (1,185)Foreign-born:
90.6% (2,023)
American Indian / Alaska Native - Speak only English Native:
77.6% (1,208)Foreign-born:
1.3% (5)
American Indian / Alaska Native - Speak another language Native:
23.0% (358)Foreign-born:
100.0% (380)
Asian - Speak only English Native:
46.3% (1,146)Foreign-born:
13.4% (1,426)
Asian - Speak another language Native:
53.7% (1,328)Foreign-born:
86.6% (9,186)
Native Hawaiian / Pacific Islander - Speak another language Native:
5.0% (8)Foreign-born:
100.0% (36)
Other race - Speak only English Native:
56.4% (2,628)Foreign-born:
14.4% (164)
Other race - Speak another language Native:
43.6% (2,033)Foreign-born:
85.6% (971)
Two or more races - Speak only English Native:
92.3% (14,768)Foreign-born:
8.4% (163)
Two or more races - Speak another language Native:
7.7% (1,226)Foreign-born:
91.6% (1,768)
White alone - Speak only English Native:
97.7% (205,981)Foreign-born:
18.9% (996)
White alone - Speak another language Native:
2.3% (4,777)Foreign-born:
81.1% (4,279)
Hispanic or Latino - Speak only English Native:
67.4% (12,674)Foreign-born:
7.5% (327)
Hispanic or Latino - Speak another language Native:
32.6% (6,117)Foreign-born:
92.5% (4,007)
Foreign-born residents in Lincoln 27,062 residents are foreign born (4.8% Asia , 2.5% Latin America ).
This city:
9.2%Nebraska:
7.5%
Marital status for residents in Lincoln Marital status - White (Caucasian) population 15 years and over
Males 43.2% Never married45.9% Now married0.4% Separated2.3% Widowed8.2% DivorcedFemales 37.3% Never married42.1% Now married0.5% Separated6.9% Widowed13.2% DivorcedWomen who gave birth in the past 12 months Now married:
83.9% (1,949)Unmarried:
16.1% (373)
Women who did not give birth in the past 12 months Now married:
34.5% (19,661)Unmarried:
65.5% (37,379)
Marital status - Black or African American population 15 years and over
Males 50.3% Never married30.9% Now married9.4% Separated4.5% Widowed4.8% DivorcedFemales 43.7% Never married46.1% Now married5.7% Separated0.0% Widowed4.4% DivorcedWomen who gave birth in the past 12 months Now married:
100.0% (309)Unmarried:
0.0% (0)
Women who did not give birth in the past 12 months Now married:
35.0% (817)Unmarried:
65.0% (1,518)
Marital status - American Indian / Alaska Native population 15 years and over
Males 53.8% Never married28.3% Now married1.2% Separated3.0% Widowed13.7% DivorcedFemales 40.1% Never married35.8% Now married4.8% Separated2.1% Widowed17.3% DivorcedWomen who gave birth in the past 12 months Now married:
40.9% (10)Unmarried:
59.1% (14)
Women who did not give birth in the past 12 months Now married:
43.2% (258)Unmarried:
56.8% (340)
Marital status - Asian population 15 years and over
Males 45.7% Never married50.8% Now married0.0% Separated1.8% Widowed1.7% DivorcedFemales 29.6% Never married58.4% Now married3.5% Separated5.4% Widowed3.1% DivorcedWomen who gave birth in the past 12 months Now married:
100.0% (370)Unmarried:
0.0% (0)
Women who did not give birth in the past 12 months Now married:
56.0% (2,393)Unmarried:
44.0% (1,883)
Marital status - Native Hawaiian / Pacific Islander population 15 years and over
Males 84.0% Never married16.0% Now married0.0% Separated0.0% Widowed0.0% DivorcedFemales 20.6% Never married38.2% Now married41.2% Separated0.0% Widowed0.0% DivorcedWomen who gave birth in the past 12 months Now married:
100.0% (29)Unmarried:
0.0% (0)
Women who did not give birth in the past 12 months Now married:
65.0% (27)Unmarried:
35.0% (15)
Marital status - Other race population 15 years and over
Males 57.4% Never married34.5% Now married0.0% Separated1.5% Widowed6.7% DivorcedFemales 44.8% Never married40.7% Now married4.9% Separated5.0% Widowed4.5% DivorcedWomen who gave birth in the past 12 months Now married:
56.2% (132)Unmarried:
43.8% (103)
Women who did not give birth in the past 12 months Now married:
39.0% (584)Unmarried:
61.0% (913)
Marital status - Two or more races population 15 years and over
Males 51.7% Never married38.5% Now married1.1% Separated2.7% Widowed5.9% DivorcedFemales 56.8% Never married29.3% Now married0.0% Separated2.7% Widowed11.1% DivorcedWomen who gave birth in the past 12 months Now married:
52.4% (142)Unmarried:
47.6% (129)
Women who did not give birth in the past 12 months Now married:
23.5% (1,206)Unmarried:
76.5% (3,926)
Marital status - White alone, not Hispanic / Latino population 15 years and over
Males 42.5% Never married46.3% Now married0.4% Separated2.3% Widowed8.6% DivorcedFemales 37.1% Never married42.0% Now married0.5% Separated7.1% Widowed13.3% DivorcedWomen who gave birth in the past 12 months Now married:
83.0% (1,824)Unmarried:
17.0% (373)
Women who did not give birth in the past 12 months Now married:
34.2% (18,731)Unmarried:
65.8% (35,975)
Marital status - Hispanic or Latino population 15 years and over
Males 53.7% Never married36.6% Now married0.9% Separated6.1% Widowed2.7% DivorcedFemales 46.7% Never married37.5% Now married2.7% Separated6.4% Widowed6.7% DivorcedWomen who gave birth in the past 12 months Now married:
32.1% (147)Unmarried:
67.9% (311)
Women who did not give birth in the past 12 months Now married:
40.5% (2,605)Unmarried:
59.5% (3,828)
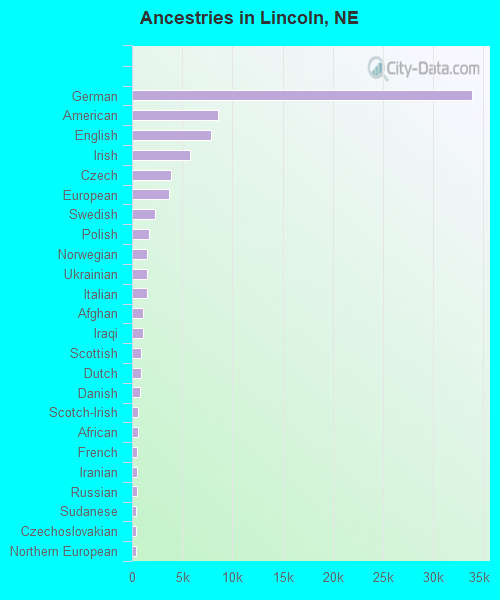
Ancestries in Lincoln
33,880 28.1% German8,571 7.1% American7,884 6.5% English5,753 4.8% Irish3,856 3.2% Czech3,657 3.0% European2,281 1.9% Swedish1,659 1.4% Polish1,530 1.3% Norwegian1,498 1.2% Ukrainian1,453 1.2% Italian1,116 0.9% Afghan1,099 0.9% Iraqi900 0.7% Scottish867 0.7% Dutch821 0.7% Danish612 0.5% Scotch-Irish588 0.5% African517 0.4% French471 0.4% Iranian454 0.4% Russian398 0.3% Sudanese383 0.3% Czechoslovakian354 0.3% Northern European296 0.2% Welsh291 0.2% British241 0.2% Scandinavian224 0.2% Hungarian223 0.2% Haitian219 0.2% Arab199 0.2% Nigerian177 0.1% British West Indian149 0.1% Greek142 0.1% Yugoslavian142 0.1% German Russian140 0.1% Eastern European124 0.1% Canadian123 0.1% Lebanese114 0.09% French Canadian111 0.09% Latvian109 0.09% Ethiopian104 0.09% Austrian94 0.08% Romanian93 0.08% Brazilian84 0.07% Ghanaian83 0.07% Swiss83 0.07% Portuguese81 0.07% Kenyan71 0.06% Armenian67 0.06% Slavic60 0.05% Somali56 0.05% Pennsylvania German56 0.05% Jamaican47 0.04% Serbian46 0.04% Lithuanian42 0.03% West Indian41 0.03% Liberian36 0.03% Luxembourger32 0.03% Albanian30 0.02% Finnish27 0.02% Ugandan26 0.02% Jordanian23 0.02% Slovak20 0.02% Bulgarian19 0.02% Macedonian16 0.01% Trinidadian and Tobagonian15 0.01% Syrian11 0.01% Croatian7 0.01% Moroccan7 0.01% Egyptian
Geographical mobility in Lincoln Same house 1 year ago 194,563 83.0% White (Caucasian)8,395 68.6% Black or African American1,367 67.1% American Indian / Alaska Native10,318 76.2% Asian173 91.4% Native Hawaiian / Pacific Islander6,007 82.9% Other race17,497 87.6% Two or more races186,437 82.9% White alone, not Hispanic / Latino21,028 83.3% Hispanic or LatinoMoved within same county 21,304 9.1% White / Caucasian2,855 23.3% Black or African American208 10.2% American Indian / Alaska Native1,430 10.6% Asian17 9.0% Native Hawaiian / Pacific Islander714 9.9% Other race1,166 5.8% Two or more races20,225 9.0% White alone, not Hispanic / Latino3,017 12.0% Hispanic or LatinoMoved within same state 8,853 3.8% White / Caucasian350 2.9% Black or African American217 10.6% American Indian / Alaska Native319 2.4% Asian301 4.2% Other race403 2.0% Two or more races8,617 3.8% White alone, not Hispanic / Latino724 2.9% Hispanic or LatinoMoved from different state 9,446 4.0% White / Caucasian587 4.8% Black or African American51 2.5% American Indian / Alaska Native291 2.1% Asian69 0.9% Other race363 1.8% Two or more races9,197 4.1% White alone, not Hispanic / Latino418 1.7% Hispanic or LatinoMoved from abroad 299 0.1% White46 0.4% Black or African American1,185 8.7% Asian41 0.6% Other race537 2.7% Two or more races299 0.1% White alone, not Hispanic / Latino59 0.2% Hispanic or Latino
Children Nativity (place of birth) in Lincoln
Children under 6 years - Living with two parents Both parents native 10,977 100.0% NativeBoth parents foreign-born 1,303 71.9% Native509 28.1% Foreign-bornOne native, one foreign-born parent 1,568 100.0% NativeChildren under 6 years - Living with one parent Native parent 4,980 100.0% NativeForeign-born parent 341 100.0% NativeChildren 6 to 17 years - Living with two parents Both parents native 23,263 99.7% Native75 0.3% Foreign-bornBoth parents foreign-born 3,474 78.5% Native951 21.5% Foreign-bornOne native, one foreign-born parent 1,078 93.7% Native72 6.3% Foreign-bornChildren 6 to 17 years - Living with one parent Native parent 9,570 100.0% NativeForeign-born parent 1,238 50.0% Native1,238 50.0% Foreign-born
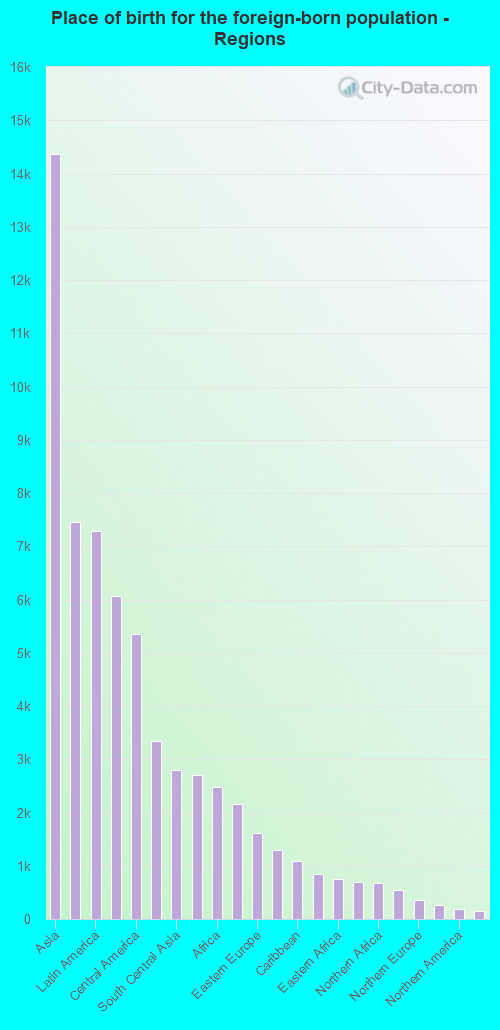
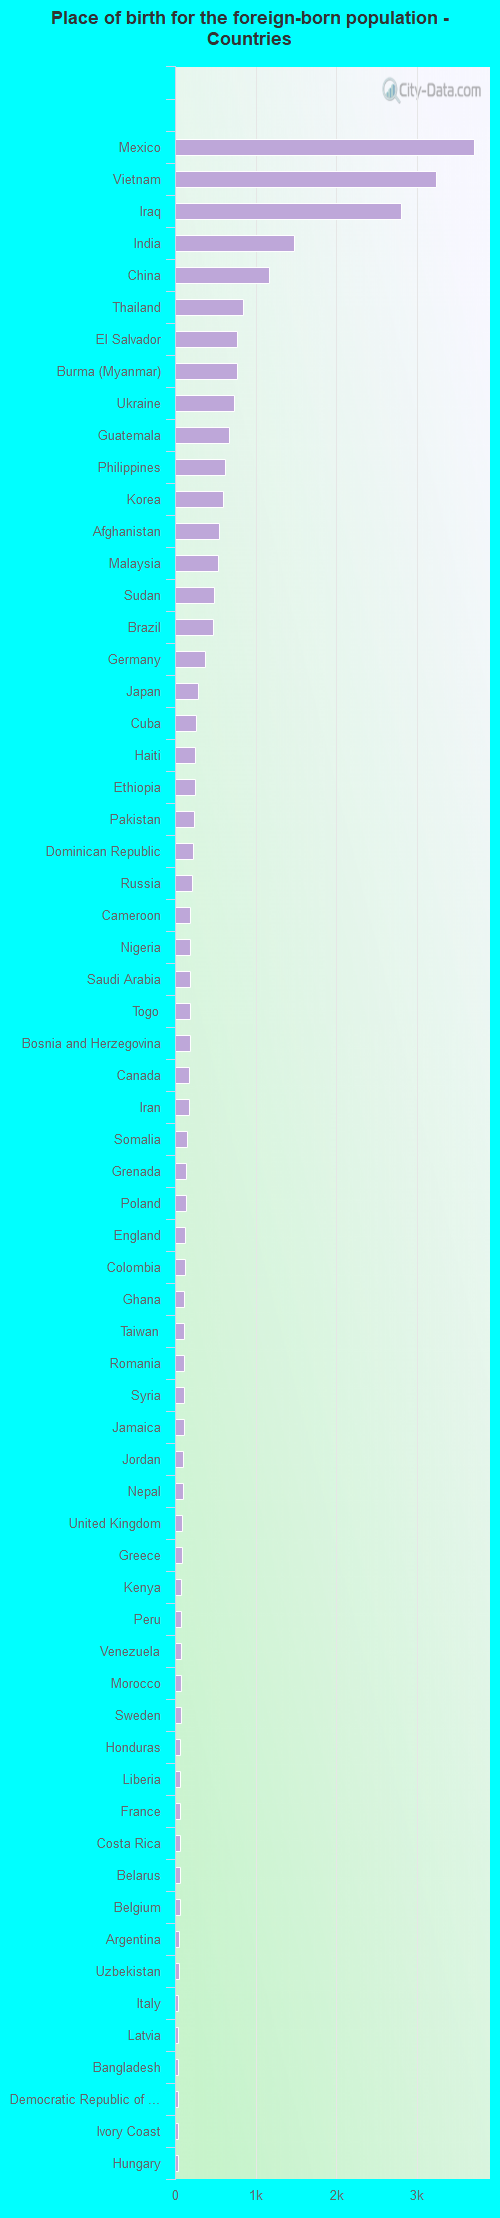
Place of birth for residents in Lincoln 14,369 Asia7,462 Americas7,283 Latin America6,065 South Eastern Asia5,357 Central America3,336 Western Asia2,792 South Central Asia2,708 Europe2,478 Africa2,161 Eastern Asia1,624 Eastern Europe1,287 China1,087 Caribbean838 South America746 Eastern Africa694 Western Africa670 Northern Africa540 Western Europe354 Northern Europe255 Middle Africa179 Northern America145 Southern Europe42 Oceania25 Australia and New Zealand Subregion17 Southern Africa3,711 Mexico3,245 Vietnam2,799 Iraq1,477 India1,165 China842 Thailand774 El Salvador767 Burma (Myanmar)731 Ukraine674 Guatemala625 Philippines593 Korea551 Afghanistan534 Malaysia483 Sudan477 Brazil370 Germany280 Japan258 Cuba245 Haiti243 Ethiopia232 Pakistan226 Dominican Republic208 Russia192 Cameroon191 Nigeria188 Saudi Arabia187 Togo181 Bosnia and Herzegovina179 Canada168 Iran151 Somalia135 Grenada131 Poland130 England124 Colombia117 Ghana111 Taiwan110 Romania107 Syria106 Jamaica101 Jordan95 Nepal92 United Kingdom88 Greece78 Kenya75 Peru75 Venezuela72 Morocco69 Sweden67 Honduras65 Liberia65 France64 Costa Rica57 Belarus56 Belgium47 Argentina45 Uzbekistan42 Italy40 Latvia36 Bangladesh34 Democratic Republic of Congo (Zaire)34 Ivory Coast34 Hungary32 Kazakhstan30 Nicaragua30 Serbia28 Uganda28 Kuwait27 Bhutan25 Panama25 Cambodia25 Australia25 Moldova23 Trinidad and Tobago23 Scotland22 Austria22 Lebanon19 Turkey19 Denmark19 North Macedonia (Macedonia)18 Azerbaijan17 South Africa17 Chile16 Netherlands15 Egypt14 Sri Lanka14 Spain14 Laos14 Albania13 Lithuania12 Eritrea10 Hong Kong10 Switzerland10 Belize10 Ireland10 Bulgaria10 Indonesia10 Ecuador9 Congo8 Bolivia6 Barbados2 Israel1 Zimbabwe
Grandparents responsible for own grandchildren in Lincoln
Grandparents (30 to 59 years) White / Caucasian 462 60.0% Responsible for grandchildren308 40.0% Not responsible for grandchildrenBlack or African American 163 72.2% Responsible for grandchildren63 27.8% Not responsible for grandchildrenAsian 17 28.4% Responsible for grandchildren42 71.6% Not responsible for grandchildrenOther race 36 32.0% Responsible for grandchildren75 68.0% Not responsible for grandchildrenTwo or more races 61 84.9% Responsible for grandchildren11 15.1% Not responsible for grandchildrenWhite alone, not Hispanic / Latino 450 72.7% Responsible for grandchildren169 27.3% Not responsible for grandchildrenHispanic or Latino 114 58.4% Responsible for grandchildren81 41.6% Not responsible for grandchildrenGrandparents (60 years and over) White / Caucasian 383 31.7% Responsible for grandchildren824 68.3% Not responsible for grandchildrenBlack or African American 30 100.0% Not responsible for grandchildrenAsian 156 35.4% Responsible for grandchildren284 64.6% Not responsible for grandchildrenOther race 59 100.0% Not responsible for grandchildrenTwo or more races 217 100.0% Not responsible for grandchildrenWhite alone, not Hispanic / Latino 385 32.5% Responsible for grandchildren799 67.5% Not responsible for grandchildrenHispanic or Latino 276 100.0% Not responsible for grandchildren
Zip codes: 68430 , 68502 , 68503 , 68504 , 68505 , 68506 , 68507 , 68508 , 68510 , 68512 , 68514 , 68516 , 68517 , 68520 , 68521 , 68522 , 68523 , 68524 , 68526 , 68528 , 68531 .