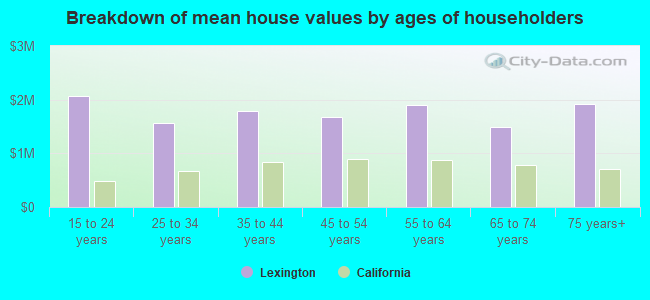
Median price asked for vacant for-sale houses and condos in 2022 in this county: $2,273,258.
Median contract rent in 2022: over $2,000 (lower quartile is $1,856, upper quartile is over $2,000)
Median rent asked for vacant for-rent units in 2022: $2,572
Median gross rent in Lexington, CA in 2022: over $2,000
Housing units in Lexington with a mortgage: 870 (128 second mortgage, 143 home equity loan, 17 both second mortgage and home equity loan) Houses without a mortgage: 166
In family households: 1,507,124 (310,117 male householders, 116,707 female householders)
330,540 spouses, 520,370 children (496,641 natural, 8,867 adopted, 14,862 stepchildren), 34,673 grandchildren, 32,375 brothers or sisters, 32,146 parents, foster children, 48,026 other relatives, 59,764 non-relatives
In nonfamily households: 244,168 (88,919 male householders (61,728 living alone)), 88,461 female householders (69,778 living alone)), 66,788 nonrelatives
In group quarters: 30,350 (9,342 institutionalized population)
295,456 married couples with children.
66,658 single-parent households (18,233 men, 48,425 women).
88.9% of residents of Lexington speak English at home.
5.3% of residents speak Spanish at home (83% speak English very well, 5% speak English well, 8% speak English not well, 4% don't speak English at all).
4.0% of residents speak other Indo-European language at home (72% speak English very well, 13% speak English well, 15% speak English not well).
1.2% of residents speak Asian or Pacific Island language at home (93% speak English very well, 7% speak English well).
0.6% of residents speak other language at home (23% speak English very well, 50% speak English not well, 27% don't speak English at all).
Foreign born population: 459 (10.5%)
(74.7% of them are naturalized citizens)
Percentage of workers working in this county: 90.4% Number of people working at home: 674 (24.8% of all workers)
Travel time to work (commute)
Less than 5 minutes: 35
5 to 9 minutes: 56
10 to 14 minutes: 74
15 to 19 minutes: 124
20 to 24 minutes: 232
25 to 29 minutes: 223
30 to 34 minutes: 505
35 to 39 minutes: 145
40 to 44 minutes: 243
45 to 59 minutes: 268
60 to 89 minutes: 229
90 or more minutes: 41
Means of transportation to work:
Drove a car alone: 1,909 (82.1%)
Carpooled: 236 (10.1%)
Bus or trolley bus: 14 (0.6%)
Motorcycle: 6 (0.3%)
Walked: 10 (0.4%)
Worked at home: 151 (6.5%)
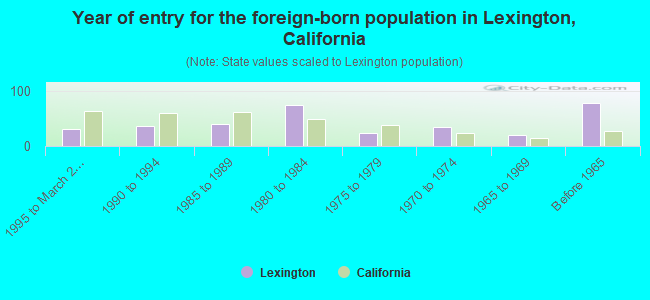
Year of entry for the foreign-born population in Lexington, California
311995 to March 2000
361990 to 1994
411985 to 1989
751980 to 1984
231975 to 1979
351970 to 1974
211965 to 1969
78Before 1965
Most common places of birth for foreign-born residents (%):
Canada
Lexington:
16.8% (57)
California:
1.6% (141,181)
United Kingdom
Lexington:
14.1% (48)
California:
1.5% (133,090)
Poland
Lexington:
7.4% (25)
California:
0.3% (24,638)
Germany
Lexington:
6.8% (23)
California:
1.1% (98,160)
India
Lexington:
5.3% (18)
California:
2.2% (198,201)
Romania
Lexington:
3.8% (13)
California:
0.3% (24,350)
Iran
Lexington:
3.8% (13)
California:
1.8% (158,613)
Malaysia
Lexington:
3.8% (13)
California:
0.1% (11,635)
Mexico
Lexington:
3.8% (13)
California:
44.3% (3,928,701)
Other Eastern Africa
Lexington:
3.2% (11)
California:
0.2% (20,704)
Other Northern Europe
Lexington:
2.4% (8)
California:
0.2% (18,478)
Philippines
Lexington:
2.4% (8)
California:
7.5% (664,935)
Sweden
Lexington:
2.1% (7)
California:
0.1% (11,383)
Austria
Lexington:
2.1% (7)
California:
0.1% (9,641)
Netherlands
Lexington:
2.1% (7)
California:
0.3% (22,311)
Other Western Europe
Lexington:
2.1% (7)
California:
0.2% (16,809)
Middle Africa
Lexington:
2.1% (7)
California:
0.0% (2,563)
Guatemala
Lexington:
2.1% (7)
California:
2.4% (211,458)
Egypt
Lexington:
1.8% (6)
California:
0.3% (25,147)
South Africa
Lexington:
1.8% (6)
California:
0.2% (14,359)
Chile
Lexington:
1.8% (6)
California:
0.2% (15,712)
Place of birth for U.S.-born residents:
This state: 2,339
Other state: 1,189
Northeast: 303
Midwest: 428
South: 225
West: 233
63% of Lexington residents lived in the same house 5 years ago. Out of people who lived in different houses, 53% lived in this county. Out of people who lived in different counties, 63% lived in California.
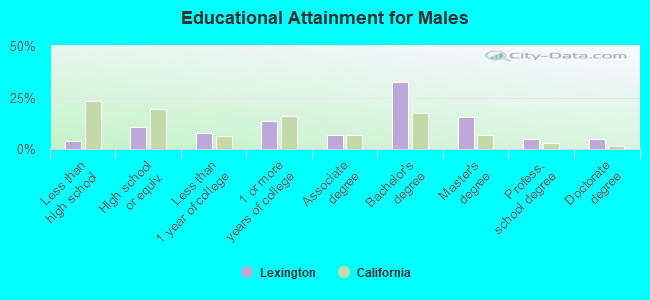
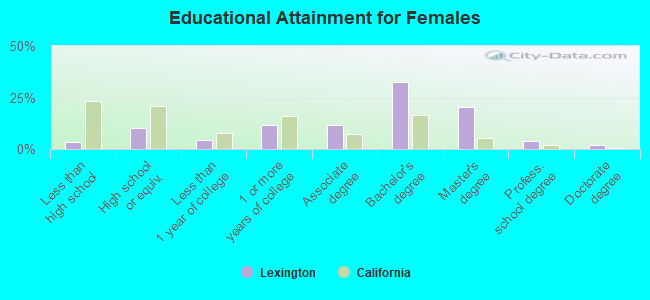
Education attainment for males 25 years and older:
No schooling: 6
Nursery to 4th grade: 0
5th and 6th grade: 0
7th and 8th grade: 8
9th grade: 0
10th grade: 7
11th grade: 20
12th grade, no diploma: 13
High school graduate (or equivalency): 154
Less than 1 year of college: 109
Some college more than 1 year, no degree: 194
Associate degree: 96
Bachelor's degree: 459
Master's degree: 220
Professional school degree: 68
Doctorate degree: 67
Education attainment for females 25 years and older: