Lexington, California (CA) income map, earnings map, and wages data
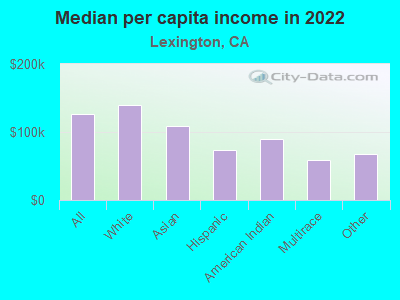
The median household income in Lexington, CA in 2022 was $212,363, which was 56.9% greater than the median annual income of $91,551 across the entire state of California. Compared to the median income of $104,655 in 2000 this represents an increase of 50.7%. The per capita income in 2022 was $126,378, which means an increase of 56.8% compared to 2000 when it was $54,623.
Income statistics for all residents
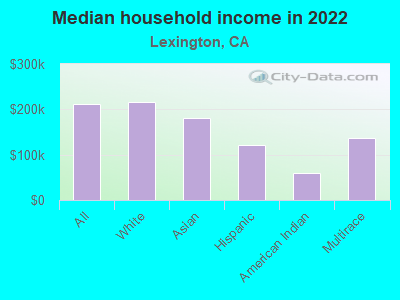
Median household income in Lexington, CA in 2022:| Lexington: | $212,364 |
| State: | $91,551 |
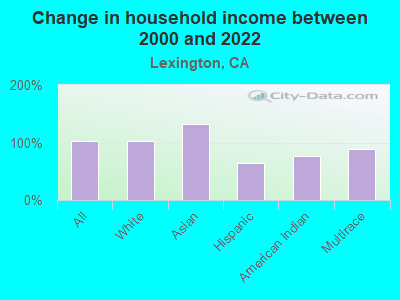
Change in median household income between 2000 and 2022:| Lexington, California: | +102.9% |
| State: | +92.8% |
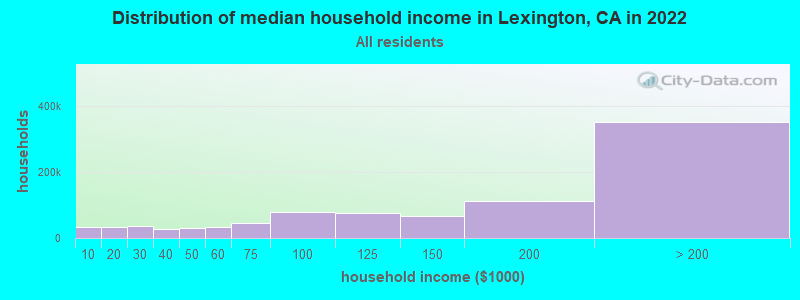
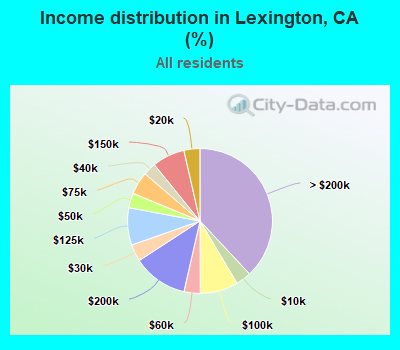
Number of households with income < $10k:| Lexington: | 3.4% (31,862) |
| California: | 4.8% (654,370) |
Number of households with income $10k - 20k:| Lexington: | 3.6% (33,007) |
| California: | 5.8% (789,493) |
Number of households with income $20k - 30k:| Lexington: | 3.8% (35,301) |
| State: | 5.7% (778,318) |
Number of households with income $30k - 40k:| Lexington: | 2.9% (26,459) |
| California: | 5.8% (783,170) |
Number of households with income $40k - 50k:| Lexington: | 3.3% (30,489) |
| State: | 5.8% (781,352) |
Number of households with income $50k - 60k:| Lexington: | 3.6% (33,481) |
| State: | 5.6% (760,175) |
Number of households with income $60k - 75k:| Lexington: | 5.1% (46,812) |
| State: | 8.2% (1,104,699) |
Number of households with income $75k - 100k:| Lexington: | 8.5% (78,222) |
| California: | 12.0% (1,627,633) |
Number of households with income $100k - 125k:| Lexington: | 8.3% (76,825) |
| California: | 10.0% (1,358,619) |
Number of households with income $125k - 150k:| Lexington: | 7.3% (67,056) |
| State: | 7.6% (1,027,455) |
Number of households with income $150k - 200k:| Lexington: | 12.3% (113,250) |
| State: | 10.6% (1,439,811) |
Number of households with income > $200k:| Lexington: | 38.0% (351,479) |
| California: | 18.0% (2,445,491) |
Aggregate household income in Lexington in 2022: $13,862,005,762
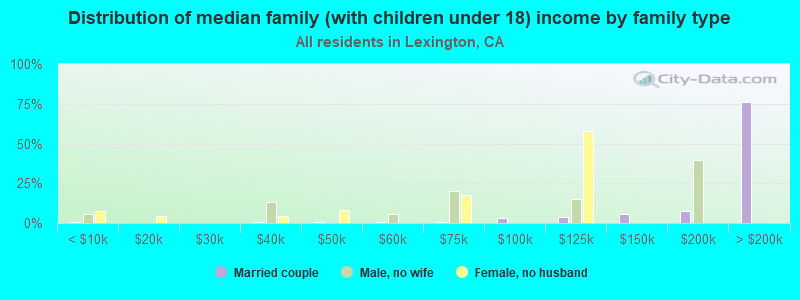
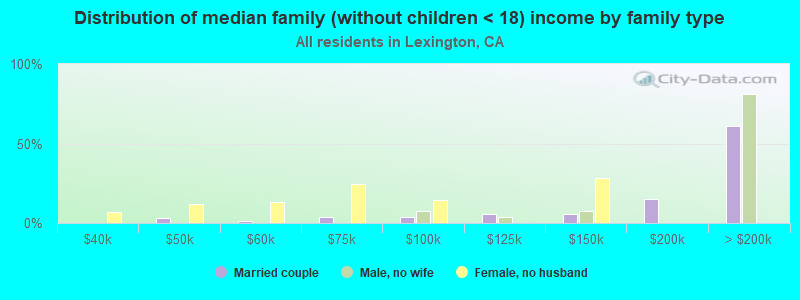
Median family income in Lexington in 2022:| Lexington: | $239,332 |
| State: | $104,823 |
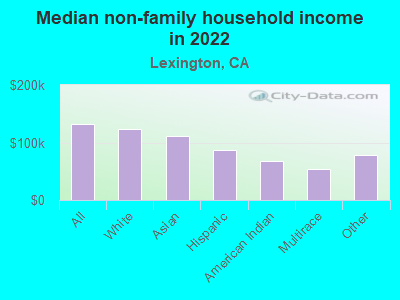
Median non-family income in Lexington in 2022:| Lexington: | $131,487 |
| California: | $59,348 |
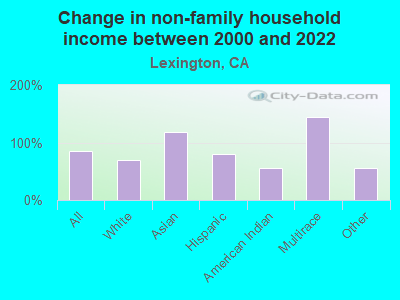
Change in median non-family income between 2000 and 2022:| Lexington, California: | +86.1% |
| State: | +85.3% |
Median per capita income in Lexington in 2022:| Lexington: | $126,378 |
| State: | $46,661 |
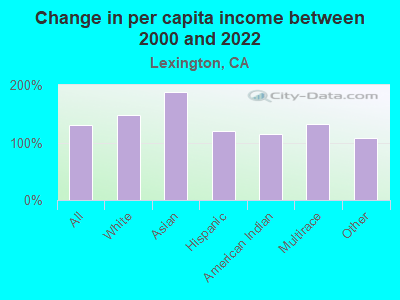
Change in median per capita income between 2000 and 2022:| Lexington, California: | +131.4% |
| State: | +105.5% |
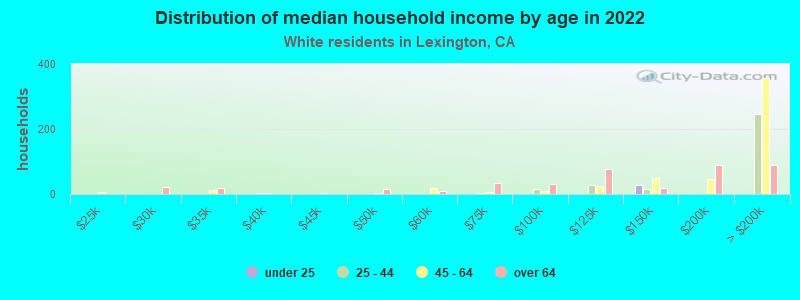
Income statistics for White residents
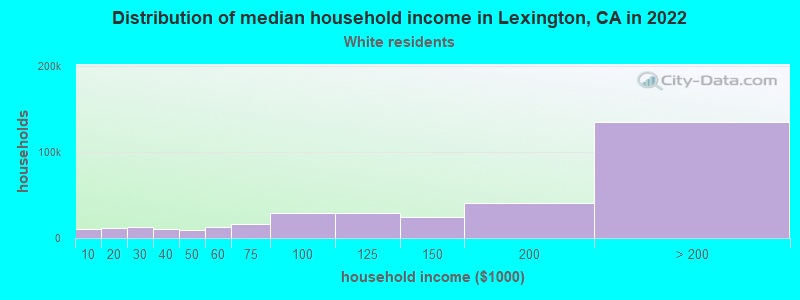
Median household income in Lexington, CA in 2022:| Lexington: | $216,413 |
| State: | $100,917 |
Change in median household income between 2000 and 2022:| Lexington, California: | +101.5% |
| California: | +96.8% |
Number of households with income < $10k:| Lexington: | 3.0% (10,128) |
| State: | 4.4% (284,109) |
Number of households with income $10k - 20k:| Lexington: | 3.4% (11,498) |
| State: | 5.3% (340,330) |
Number of households with income $20k - 30k:| Lexington: | 3.7% (12,465) |
| State: | 5.3% (343,145) |
Number of households with income $30k - 40k:| Lexington: | 3.1% (10,582) |
| State: | 5.1% (330,146) |
Number of households with income $40k - 50k:| Lexington: | 2.9% (9,907) |
| State: | 5.2% (335,310) |
Number of households with income $50k - 60k:| Lexington: | 3.6% (12,396) |
| State: | 5.1% (326,299) |
Number of households with income $60k - 75k:| Lexington: | 4.7% (15,927) |
| State: | 7.6% (487,640) |
Number of households with income $75k - 100k:| Lexington: | 8.5% (28,934) |
| State: | 11.5% (736,578) |
Number of households with income $100k - 125k:| Lexington: | 8.6% (29,369) |
| State: | 10.1% (648,782) |
Number of households with income $125k - 150k:| Lexington: | 7.1% (24,329) |
| California: | 7.8% (499,671) |
Number of households with income $150k - 200k:| Lexington: | 11.8% (40,320) |
| State: | 11.4% (729,603) |
Number of households with income > $200k:| Lexington: | 39.7% (135,262) |
| California: | 21.2% (1,364,246) |
Aggregate household income in Lexington in 2022: $5,227,052,769
Median family income in Lexington in 2022:| Lexington: | $269,371 |
| State: | $125,379 |
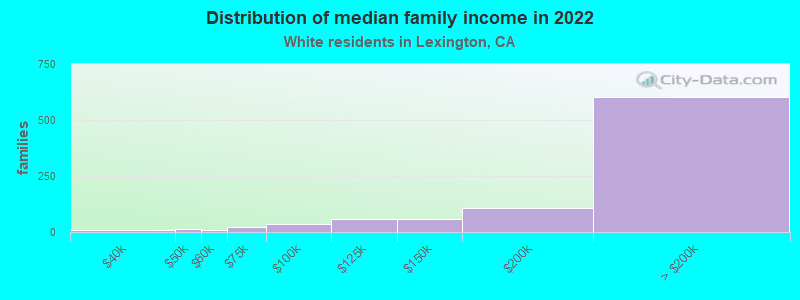
Number of families with income < $10k:| Lexington: | 0.4% (4) |
| State: | 2.2% (87,079) |
Number of families with income $10k - 20k:| Lexington: | 0.2% (2) |
| State: | 2.5% (97,716) |
Number of families with income $20k - 30k:| Lexington: | 0.1% (1) |
| California: | 3.5% (137,295) |
Number of families with income $30k - 40k:| Lexington: | 0.8% (7) |
| State: | 3.9% (152,947) |
Number of families with income $40k - 50k:| Lexington: | 1.3% (12) |
| California: | 4.3% (169,197) |
Number of families with income $50k - 60k:| Lexington: | 1.0% (9) |
| California: | 4.5% (176,192) |
Number of families with income $60k - 75k:| Lexington: | 2.6% (24) |
| State: | 7.0% (274,752) |
Number of families with income $75k - 100k:| Lexington: | 3.7% (34) |
| California: | 11.3% (445,632) |
Number of families with income $100k - 125k:| Lexington: | 6.5% (60) |
| California: | 10.7% (423,630) |
Number of families with income $125k - 150k:| Lexington: | 6.3% (58) |
| State: | 9.1% (357,408) |
Number of families with income $150k - 200k:| Lexington: | 11.9% (109) |
| State: | 13.5% (532,693) |
Number of families with income > $200k:| Lexington: | 65.3% (601) |
| State: | 27.6% (1,086,948) |
Median non-family income in Lexington in 2022:| Lexington: | $123,607 |
| California: | $62,819 |
Change in median non-family income between 2000 and 2022:| Lexington, California: | +70.1% |
| California: | +84.4% |
Median per capita income in Lexington in 2022:| Lexington: | $140,338 |
| State: | $61,706 |
Change in median per capita income between 2000 and 2022:| Lexington, California: | +146.6% |
| State: | +122.7% |
Income statistics for Asian residents
Median household income in Lexington, CA in 2022:| Lexington: | $179,851 |
| State: | $119,861 |
Change in median household income between 2000 and 2022:| Lexington, California: | +132.0% |
| California: | +116.5% |
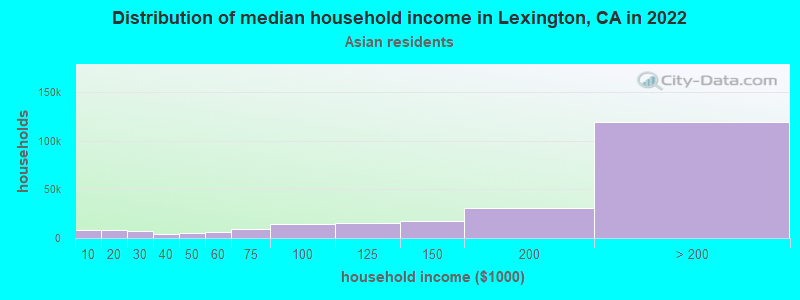
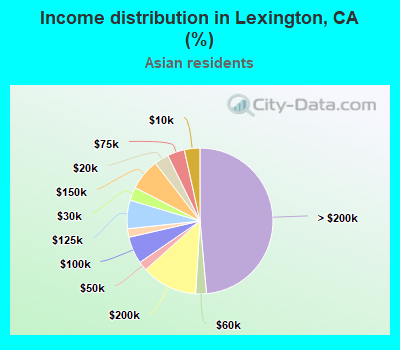
Number of households with income < $10k:| Lexington: | 3.5% (8,456) |
| California: | 5.1% (106,273) |
Number of households with income $10k - 20k:| Lexington: | 3.2% (7,829) |
| State: | 4.9% (101,815) |
Number of households with income $20k - 30k:| Lexington: | 3.0% (7,233) |
| California: | 4.6% (94,414) |
Number of households with income $30k - 40k:| Lexington: | 1.9% (4,583) |
| State: | 4.1% (84,491) |
Number of households with income $40k - 50k:| Lexington: | 2.0% (4,999) |
| California: | 4.0% (81,758) |
Number of households with income $50k - 60k:| Lexington: | 2.4% (5,862) |
| State: | 3.9% (80,971) |
Number of households with income $60k - 75k:| Lexington: | 3.8% (9,294) |
| California: | 6.0% (124,194) |
Number of households with income $75k - 100k:| Lexington: | 6.0% (14,744) |
| California: | 9.7% (200,337) |
Number of households with income $100k - 125k:| Lexington: | 6.3% (15,475) |
| State: | 9.4% (193,488) |
Number of households with income $125k - 150k:| Lexington: | 7.0% (17,129) |
| State: | 7.7% (158,253) |
Number of households with income $150k - 200k:| Lexington: | 12.4% (30,387) |
| State: | 12.2% (252,139) |
Number of households with income > $200k:| Lexington: | 48.6% (119,036) |
| California: | 28.4% (586,641) |
Aggregate household income in Lexington in 2022: $117,053,910
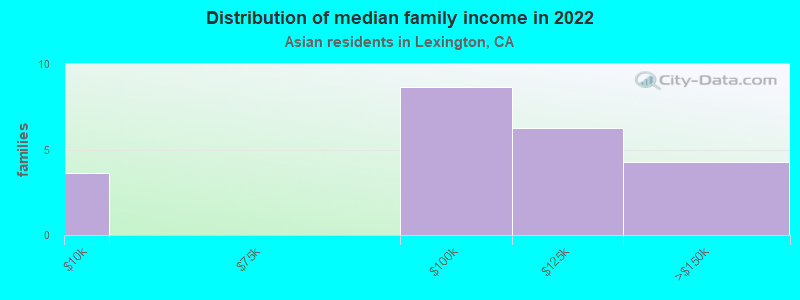
Median family income in Lexington in 2022:| Lexington: | $225,763 |
| State: | $136,040 |
Number of families with income < $10k:| Lexington: | 15.9% (4) |
| State: | 2.8% (42,046) |
Number of families with income $75k - 100k:| Lexington: | 38.0% (9) |
| State: | 9.5% (143,103) |
Number of families with income $100k - 125k:| Lexington: | 27.4% (6) |
| State: | 9.4% (142,085) |
Number of families with income $125k - 150k:| Lexington: | 18.7% (4) |
| State: | 8.0% (120,635) |
Median non-family income in Lexington in 2022:| Lexington: | $111,931 |
| State: | $74,216 |
Change in median non-family income between 2000 and 2022:| Lexington, California: | +118.4% |
| California: | +136.3% |
Median per capita income in Lexington in 2022:| Lexington: | $108,166 |
| State: | $58,824 |
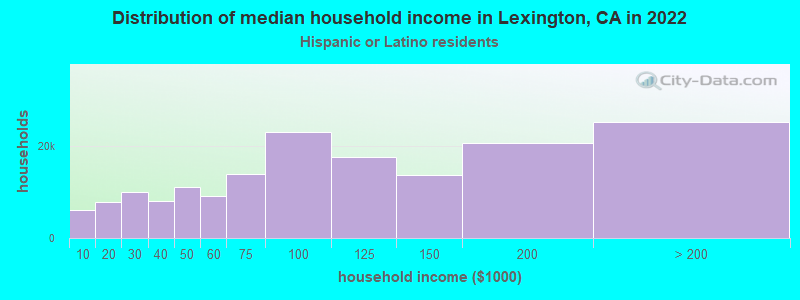
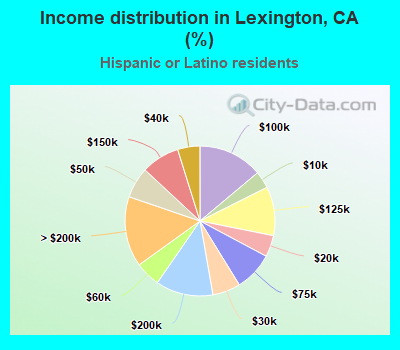
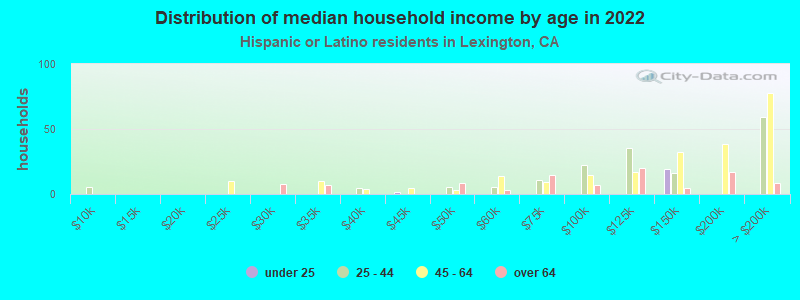
Income statistics for Hispanic or Latino residents
Median household income in Lexington, CA in 2022:| Lexington: | $121,448 |
| California: | $75,698 |
Change in median household income between 2000 and 2022:| Lexington, California: | +64.7% |
| State: | +107.2% |
Number of households with income < $10k:| Lexington: | 3.7% (6,107) |
| State: | 4.3% (183,294) |
Number of households with income $10k - 20k:| Lexington: | 4.6% (7,694) |
| California: | 6.0% (253,903) |
Number of households with income $20k - 30k:| Lexington: | 6.0% (9,998) |
| California: | 6.8% (286,386) |
Number of households with income $30k - 40k:| Lexington: | 4.8% (7,967) |
| California: | 7.4% (313,728) |
Number of households with income $40k - 50k:| Lexington: | 6.7% (11,051) |
| State: | 7.4% (313,199) |
Number of households with income $50k - 60k:| Lexington: | 5.4% (9,010) |
| State: | 7.2% (305,366) |
Number of households with income $60k - 75k:| Lexington: | 8.4% (13,915) |
| California: | 10.3% (434,937) |
Number of households with income $75k - 100k:| Lexington: | 13.9% (23,013) |
| State: | 14.4% (607,302) |
Number of households with income $100k - 125k:| Lexington: | 10.6% (17,461) |
| State: | 10.6% (447,424) |
Number of households with income $125k - 150k:| Lexington: | 8.3% (13,661) |
| State: | 7.5% (316,022) |
Number of households with income $150k - 200k:| Lexington: | 12.4% (20,488) |
| State: | 9.2% (386,269) |
Number of households with income > $200k:| Lexington: | 15.2% (25,101) |
| State: | 8.8% (372,651) |
Aggregate household income in Lexington in 2022: $31,915,954
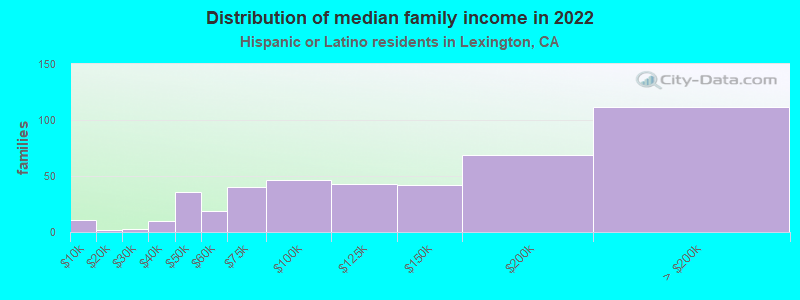
Median family income in Lexington in 2022:| Lexington: | $129,436 |
| California: | $77,589 |
Number of families with income < $10k:| Lexington: | 2.6% (11) |
| State: | 3.9% (129,468) |
Number of families with income $10k - 20k:| Lexington: | 0.5% (2) |
| State: | 4.6% (151,997) |
Number of families with income $20k - 30k:| Lexington: | 0.7% (3) |
| State: | 6.6% (216,764) |
Number of families with income $30k - 40k:| Lexington: | 2.4% (10) |
| California: | 7.6% (249,849) |
Number of families with income $40k - 50k:| Lexington: | 8.4% (36) |
| California: | 7.7% (254,822) |
Number of families with income $50k - 60k:| Lexington: | 4.4% (19) |
| California: | 7.4% (244,815) |
Number of families with income $60k - 75k:| Lexington: | 9.2% (40) |
| State: | 10.5% (345,838) |
Number of families with income $75k - 100k:| Lexington: | 10.6% (46) |
| State: | 14.9% (491,589) |
Number of families with income $100k - 125k:| Lexington: | 10.0% (43) |
| State: | 10.7% (355,400) |
Number of families with income $125k - 150k:| Lexington: | 9.7% (42) |
| State: | 7.8% (259,317) |
Number of families with income $150k - 200k:| Lexington: | 15.9% (69) |
| State: | 9.3% (306,566) |
Number of families with income > $200k:| Lexington: | 25.7% (112) |
| State: | 9.1% (299,984) |
Median non-family income in Lexington in 2022:| Lexington: | $87,559 |
| State: | $49,746 |
Change in median non-family income between 2000 and 2022:| Lexington, California: | +79.6% |
| State: | +100.7% |
Median per capita income in Lexington in 2022:| Lexington: | $73,458 |
| State: | $27,240 |
Change in median per capita income between 2000 and 2022:| Lexington, California: | +120.2% |
| State: | +133.3% |
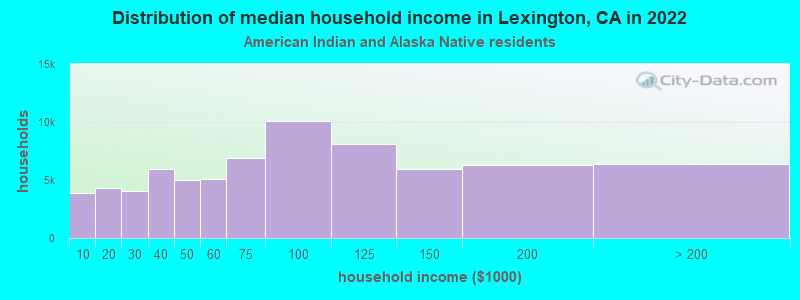
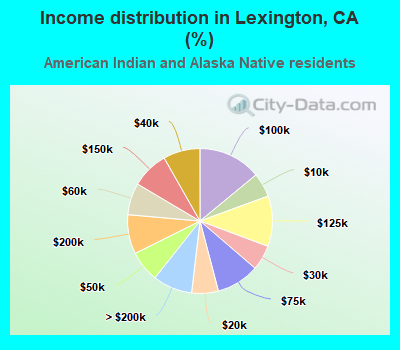
Income statistics for American Indian and Alaska Native residents
Median household income in Lexington, CA in 2022:| Lexington: | $59,653 |
| State: | $76,752 |
Change in median household income between 2000 and 2022:| Lexington, California: | +76.8% |
| State: | +110.0% |
Number of households with income < $10k:| Lexington: | 5.4% (3,894) |
| State: | 5.4% (8,471) |
Number of households with income $10k - 20k:| Lexington: | 6.0% (4,297) |
| State: | 6.0% (9,381) |
Number of households with income $20k - 30k:| Lexington: | 5.6% (4,036) |
| California: | 5.5% (8,668) |
Number of households with income $30k - 40k:| Lexington: | 8.2% (5,921) |
| State: | 8.3% (13,030) |
Number of households with income $40k - 50k:| Lexington: | 7.0% (5,011) |
| State: | 6.9% (10,908) |
Number of households with income $50k - 60k:| Lexington: | 7.1% (5,122) |
| California: | 7.1% (11,198) |
Number of households with income $60k - 75k:| Lexington: | 9.6% (6,918) |
| State: | 9.6% (15,190) |
Number of households with income $75k - 100k:| Lexington: | 14.0% (10,106) |
| State: | 14.1% (22,274) |
Number of households with income $100k - 125k:| Lexington: | 11.3% (8,119) |
| California: | 11.2% (17,643) |
Number of households with income $125k - 150k:| Lexington: | 8.3% (5,949) |
| State: | 8.3% (13,117) |
Number of households with income $150k - 200k:| Lexington: | 8.8% (6,322) |
| State: | 8.8% (13,853) |
Number of households with income > $200k:| Lexington: | 8.8% (6,348) |
| State: | 8.8% (13,925) |
Aggregate household income in Lexington in 2022: $1,397,958
Median family income in Lexington in 2022:| Lexington: | $24,500 |
| State: | $81,108 |
Median non-family income in Lexington in 2022:| Lexington: | $68,006 |
| State: | $51,296 |
Change in median non-family income between 2000 and 2022:| Lexington, California: | +55.4% |
| State: | +114.0% |
Median per capita income in Lexington in 2022:| Lexington: | $90,101 |
| California: | $30,289 |
Change in median per capita income between 2000 and 2022:| Lexington, California: | +115.0% |
| State: | +98.9% |
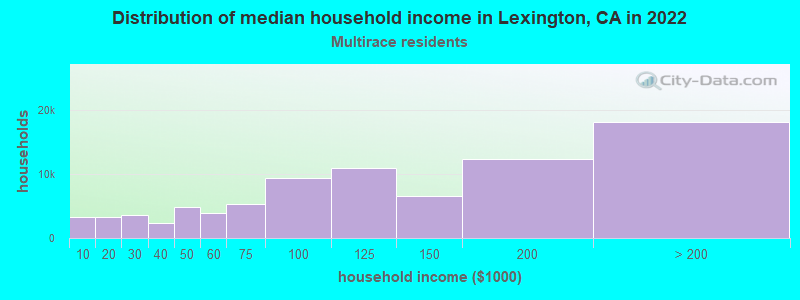
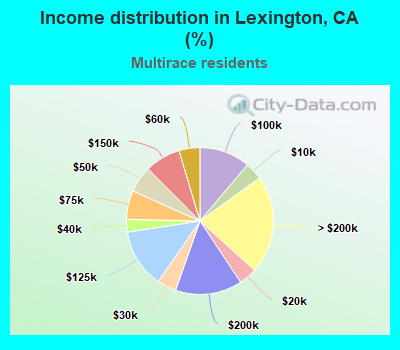
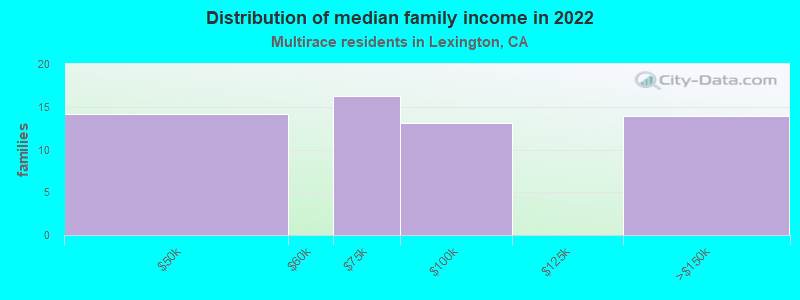
Income statistics for Multirace residents
Median household income in Lexington, CA in 2022:| Lexington: | $136,997 |
| California: | $83,153 |
Change in median household income between 2000 and 2022:| Lexington, California: | +87.9% |
| State: | +106.0% |
Number of households with income < $10k:| Lexington: | 3.9% (3,259) |
| State: | 4.2% (85,299) |
Number of households with income $10k - 20k:| Lexington: | 4.0% (3,336) |
| State: | 6.1% (122,966) |
Number of households with income $20k - 30k:| Lexington: | 4.2% (3,526) |
| State: | 6.4% (129,328) |
Number of households with income $30k - 40k:| Lexington: | 2.8% (2,335) |
| California: | 6.4% (130,070) |
Number of households with income $40k - 50k:| Lexington: | 5.8% (4,891) |
| State: | 6.5% (131,254) |
Number of households with income $50k - 60k:| Lexington: | 4.6% (3,870) |
| California: | 6.5% (132,382) |
Number of households with income $60k - 75k:| Lexington: | 6.3% (5,313) |
| State: | 9.4% (191,472) |
Number of households with income $75k - 100k:| Lexington: | 11.2% (9,376) |
| State: | 13.3% (269,691) |
Number of households with income $100k - 125k:| Lexington: | 13.0% (10,890) |
| State: | 10.2% (207,286) |
Number of households with income $125k - 150k:| Lexington: | 7.9% (6,591) |
| State: | 7.8% (158,259) |
Number of households with income $150k - 200k:| Lexington: | 14.7% (12,335) |
| State: | 10.3% (209,227) |
Number of households with income > $200k:| Lexington: | 21.7% (18,165) |
| State: | 13.0% (263,210) |
Aggregate household income in Lexington in 2022: $21,809,790
Median family income in Lexington in 2022:| Lexington: | $121,906 |
| State: | $87,642 |
Number of families with income $40k - 50k:| Lexington: | 24.6% (14) |
| California: | 6.8% (100,085) |
Number of families with income $60k - 75k:| Lexington: | 28.3% (16) |
| California: | 9.5% (140,131) |
Number of families with income $75k - 100k:| Lexington: | 22.9% (13) |
| California: | 13.8% (203,439) |
Number of families with income $125k - 150k:| Lexington: | 24.2% (14) |
| State: | 8.4% (124,115) |
Median non-family income in Lexington in 2022:| Lexington: | $53,652 |
| State: | $56,558 |
Change in median non-family income between 2000 and 2022:| Lexington, California: | +144.3% |
| California: | +100.2% |
Median per capita income in Lexington in 2022:| Lexington: | $58,745 |
| State: | $32,124 |
Change in median per capita income between 2000 and 2022:| Lexington, California: | +132.4% |
| State: | +120.4% |
Income statistics for other residents
Number of households with income < $10k:| Lexington: | 4.1% (2) |
| California: | 4.6% (93,035) |
Number of households with income $10k - 20k:| Lexington: | 6.1% (3) |
| California: | 6.3% (126,222) |
Number of households with income $20k - 30k:| Lexington: | 6.1% (3) |
| California: | 7.1% (142,656) |
Number of households with income $30k - 40k:| Lexington: | 6.1% (3) |
| State: | 8.2% (165,018) |
Number of households with income $40k - 50k:| Lexington: | 6.1% (3) |
| California: | 8.0% (161,732) |
Number of households with income $50k - 60k:| Lexington: | 6.1% (3) |
| State: | 7.6% (152,152) |
Number of households with income $60k - 75k:| Lexington: | 10.2% (5) |
| State: | 10.4% (209,951) |
Number of households with income $75k - 100k:| Lexington: | 14.3% (7) |
| State: | 14.7% (296,102) |
Number of households with income $100k - 125k:| Lexington: | 10.2% (5) |
| California: | 10.7% (214,281) |
Number of households with income $125k - 150k:| Lexington: | 8.2% (4) |
| California: | 7.1% (143,092) |
Number of households with income $150k - 200k:| Lexington: | 12.2% (6) |
| State: | 8.6% (172,215) |
Number of households with income > $200k:| Lexington: | 10.2% (5) |
| State: | 6.7% (134,102) |
Aggregate household income in Lexington in 2022: $5,282,614
Median family income in Lexington in 2022:| Lexington: | $62,835 |
| California: | $72,756 |
Median non-family income in Lexington in 2022:| Lexington: | $77,934 |
| State: | $43,881 |
Change in median non-family income between 2000 and 2022:| Lexington, California: | +56.4% |
| State: | +84.6% |
Median per capita income in Lexington in 2022:| Lexington: | $66,927 |
| State: | $25,164 |
Change in median per capita income between 2000 and 2022:| Lexington, California: | +107.0% |
| State: | +137.9% |