Lenexa, KS (Kansas) Houses and Residents
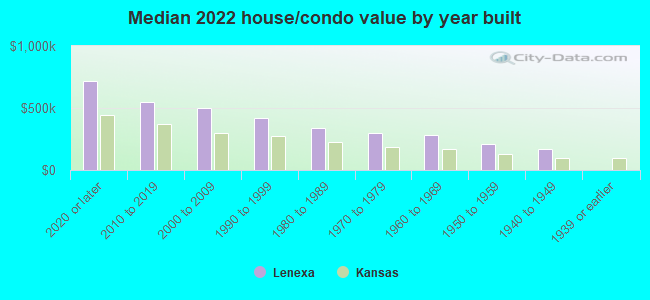
| Lenexa: | $375,103 |
| Kansas: | $206,600 |
Mean price in 2022:
Detached houses: $414,682
Here: $414,682 State: $264,181 Townhouses or other attached units: $230,656
Here: $230,656 State: $219,178 In 3-to-4-unit structures: $119,907
Here: $119,907 State: $161,859 In 5-or-more-unit structures: $197,747
Here: $197,747 State: $267,030 Mobile homes: $147,458
Here: $147,458 State: $74,712
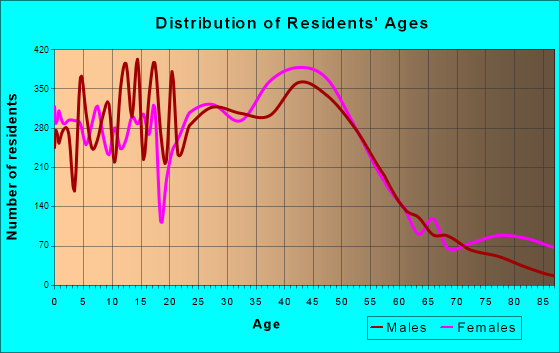
Total population: 51,042 (Urban population: 38,540, Rural population: 1,557 (87 farm, 1,470 nonfarm))
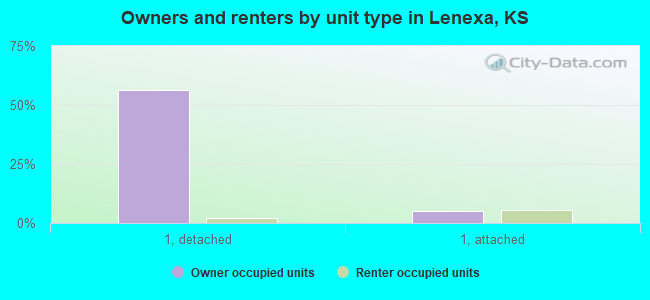
Houses: 26,093 (24,810 occupied: 14,268 owner occupied, 10,660 renter occupied)
| % of renters here: | 43% |
| State: | 32% |
Housing density: 761 houses/condos per square mile
Median price asked for vacant for-sale houses and condos in 2022: $298,386.
Median contract rent in 2022: $1,200 (lower quartile is $983, upper quartile is $1,495)
Median rent asked for vacant for-rent units in 2022: $2,472
Median gross rent in Lenexa, KS in 2022: $1,361
Housing units in Lenexa with a mortgage: 9,555 (1,086 second mortgage, 81 home equity loan, 836 both second mortgage and home equity loan)
Houses without a mortgage: 398
Median household income for houses/condos with a mortgage: $140,747
Median household income for apartments without a mortgage: $94,018
Median monthly housing costs: $1,487
Compare current foreclosures in Lenexa, KS:
| Photo | Address | Area | Beds / Baths | Price | Details |
|---|---|---|---|---|---|

|
#1
Candlelight Ln
Lenexa, KS 66215
|
1,572 sq. feet
|
2 baths 3 beds |
show details | |

|
#2
Swarner Dr
Lenexa, KS 66219
|
2,595 sq. feet
|
3 baths 4 beds |
show details | |

|
#3
Sunray Dr
Lenexa, KS 66227
|
2,775 sq. feet
|
2 baths 4 beds |
show details | |

|
#4
W 93rd St
Lenexa, KS 66215
|
1,912 sq. feet
|
3 baths 5 beds |
show details | |

|
#5
W 93rd Ter
Lenexa, KS 66215
|
1,867 sq. feet
|
2 baths 3 beds |
show details | |

|
#6
Haskins St
Lenexa, KS 66215
|
1,156 sq. feet
|
1 baths 3 beds |
show details | |

|
#7
Haskins St
Lenexa, KS 66215
|
1,365 sq. feet
|
1 baths 3 beds |
show details | |

|
#8
Caenen Lake Rd
Lenexa, KS 66215
|
2,962 sq. feet
|
4 baths 4 beds |
show details | |

|
#9
W 100th St
Lenexa, KS 66215
|
1,615 sq. feet
|
2 baths 3 beds |
show details | |

|
#10
Anderson St
Lenexa, KS 66227
|
1,670 sq. feet
|
2 baths 3 beds |
show details |
| Photo | Address | Area | Beds / Baths | Price | Details |
|---|---|---|---|---|---|

|
#11
Monrovia St
Lenexa, KS 66215
|
2,085 sq. feet
|
2 baths 4 beds |
show details | |

|
#12
W 104th Ct
Lenexa, KS 66215
|
1,930 sq. feet
|
2 baths 3 beds |
show details | |

|
#13
Monrovia St
Lenexa, KS 66215
|
2,261 sq. feet
|
4 baths 4 beds |
show details | |

|
#14
Gillette St
Lenexa, KS 66215
|
1,685 sq. feet
|
3 baths 3 beds |
show details | |

|
#15
W 105th St
Lenexa, KS 66215
|
1,916 sq. feet
|
2 baths 3 beds |
show details | |

|
#16
Greenwood St
Lenexa, KS 66215
|
1,991 sq. feet
|
2 baths 3 beds |
show details | |

|
#17
W 91st St
Lenexa, KS 66215
|
1,008 sq. feet
|
1 baths 2 beds |
show details | |

|
#18
Woodstone St
Lenexa, KS 66219
|
2,441 sq. feet
|
2 baths 4 beds |
show details | |

|
#19
Pennycross Rd
Lenexa, KS 66215
|
1,044 sq. feet
|
1 baths 3 beds |
show details | |

|
#20
Gallery St
Lenexa, KS 66215
|
3,012 sq. feet
|
4 baths 6 beds |
show details |
| Photo | Address | Area | Beds / Baths | Price | Details |
|---|---|---|---|---|---|

|
#21
W 89th St
Lenexa, KS 66215
|
2,828 sq. feet
|
3 baths 4 beds |
show details | |

|
#22
W 92nd Ter
Lenexa, KS 66215
|
1,782 sq. feet
|
2 baths 3 beds |
show details | |

|
#23
Lichtenauer Dr Apt 296
Lenexa, KS 66219
|
- sq. feet
|
- baths - beds |
show details | |

|
#24
W 112th Ter
Lenexa, KS 66215
|
- sq. feet
|
- baths - beds |
show details | |

|
#25
W 88th Ct Apt 232
Lenexa, KS 66215
|
- sq. feet
|
- baths - beds |
show details | |

|
#26
Renner Blvd Apt 3005
Lenexa, KS 66219
|
- sq. feet
|
- baths - beds |
show details | |

|
#27
W 84th St
Lenexa, KS 66219
|
- sq. feet
|
- baths - beds |
show details | |

|
#28
Noland Rd
Lenexa, KS 66215
|
- sq. feet
|
- baths - beds |
show details | |

|
#29
W 84th St
Lenexa, KS 66219
|
- sq. feet
|
- baths - beds |
show details | |

|
#30
Maurer Rd Apt 917
Lenexa, KS 66219
|
- sq. feet
|
- baths - beds |
show details |
| Photo | Address | Area | Beds / Baths | Price | Details |
|---|---|---|---|---|---|

|
#31
Maurer Rd Apt 1613
Lenexa, KS 66219
|
- sq. feet
|
- baths - beds |
show details | |

|
#32
Renner Rd Apt 4
Lenexa, KS 66219
|
- sq. feet
|
- baths - beds |
show details | |

|
#33
Legler Rd
Lenexa, KS 66219
|
- sq. feet
|
- baths - beds |
show details | |

|
#34
Renner Blvd Apt 1206
Lenexa, KS 66219
|
- sq. feet
|
- baths - beds |
show details | |

|
#35
Renner Blvd Apt 815
Lenexa, KS 66219
|
- sq. feet
|
- baths - beds |
show details | |

|
#36
Maurer Rd
Lenexa, KS 66219
|
- sq. feet
|
- baths - beds |
show details | |

|
#37
Penrose Ln, Apt 561
Lenexa, KS 66219
|
- sq. feet
|
- baths - beds |
show details | |

|
#38
Penrose Ln, Apt 245
Lenexa, KS 66219
|
- sq. feet
|
- baths - beds |
show details | |

|
#39
W 83rd St
Lenexa, KS 66227
|
- sq. feet
|
- baths - beds |
show details | |

|
#40
W 97th Ter Apt 200
Lenexa, KS 66215
|
- sq. feet
|
- baths - beds |
show details |
| Photo | Address | Area | Beds / Baths | Price | Details |
|---|---|---|---|---|---|

|
#41
Monrovia St Apt 528
Lenexa, KS 66215
|
- sq. feet
|
- baths - beds |
show details | |

|
#42
Monrovia St Apt 104
Lenexa, KS 66215
|
- sq. feet
|
- baths - beds |
show details | |

|
#43
Legler Cir Apt 507
Lenexa, KS 66219
|
- sq. feet
|
- baths - beds |
show details | |

|
#44
Monrovia St
Lenexa, KS 66215
|
- sq. feet
|
- baths - beds |
show details | |

|
#45
W 95th Ln Unit 606
Lenexa, KS 66227
|
- sq. feet
|
- baths - beds |
show details | |

|
#46
Penrose Ln
Lenexa, KS 66219
|
- sq. feet
|
- baths - beds |
show details | |

|
#47
Caenen Lake Rd
Lenexa, KS 66215
|
- sq. feet
|
- baths - beds |
show details | |

|
#48
Penrose Ln, Apt 317
Lenexa, KS 66219
|
- sq. feet
|
- baths - beds |
show details | |

|
#49
W 83rd Ter
Lenexa, KS 66219
|
- sq. feet
|
- baths - beds |
show details | |

|
Check over 1 million property listings on Foreclosure.com!
|
browse all offers | |||

Latest news about housing in Lenexa, KS collected exclusively by city-data.com from local newspapers, TV, and radio stations

 | A very affordable tiny house with a basement in a safe neighborhood (23 replies) |
| National Bio and Agro-Defense Facility aka NBAF (38 replies) |
| If You Live In KS and Pay Property Tax (25 replies) |
| Tallgrass Brewing suspends production, seeks investors (8 replies) |
| Kansas: an economic disaster area (161 replies) |
| Road Trip! (26 replies) |
Median year apartment built: 1997
Household type by relationship:
Households: 58,292- Male householders: 12,663 (2,967 living alone), Female householders: 11,870 (3,970 living alone)
12,521 spouses (12,480 opposite-sex spouses), 1,604 unmarried partners, (1,543 opposite-sex unmarried partners), 15,898 children (14,981 natural, 558 adopted, 357 stepchildren), 452 grandchildren, 494 brothers or sisters, 362 parents, 74 foster children, 429 other relatives, 1,455 non-relatives
- In group quarters: 464
Size of family households: 7,830 2-persons, 3,452 3-persons, 3,028 4-persons, 949 5-persons, 372 6-persons, 81 7-or-more-persons.
Size of nonfamily households: 7,687 1-person, 1,399 2-persons, 173 3-persons, 33 4-persons.
9,543 married couples with children.
2,210 single-parent households (582 men, 1,628 women).
91.4% of residents of Lenexa speak English at home.
4.1% of residents speak Spanish at home (66% speak English very well, 16% speak English well, 12% speak English not well, 6% don't speak English at all).
1.3% of residents speak other Indo-European language at home (82% speak English very well, 14% speak English well, 4% speak English not well).
2.0% of residents speak Asian or Pacific Island language at home (58% speak English very well, 18% speak English well, 16% speak English not well, 8% don't speak English at all).
1.4% of residents speak other language at home (71% speak English very well, 17% speak English well, 12% speak English not well).
Foreign born population: 4,199 (7.2%)
(47.8% of them are naturalized citizens)
| Here: | 8.0 |
| State: | 6.9 |
| Here: | 4.1 |
| State: | 4.4 |
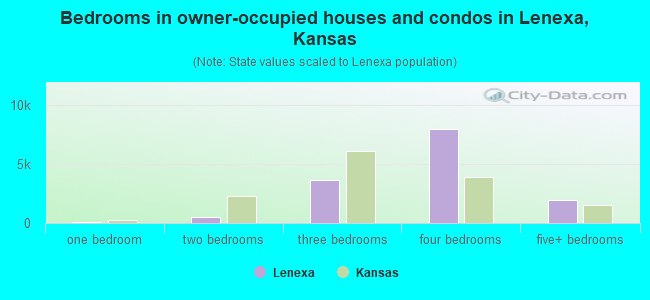
- Bedrooms in owner-occupied houses and condos in Lenexa, Kansas
- 60no bedroom
- 601 bedroom
- 5412 bedrooms
- 3,6883 bedrooms
- 7,9924 bedrooms
- 1,9285+ bedrooms
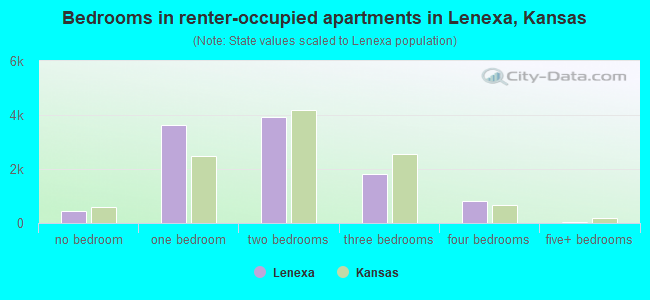
- Bedrooms in renter-occupied apartments in Lenexa, Kansas
- 446no bedroom
- 3,6131 bedroom
- 3,9282 bedrooms
- 1,8093 bedrooms
- 8244 bedrooms
- 405+ bedrooms
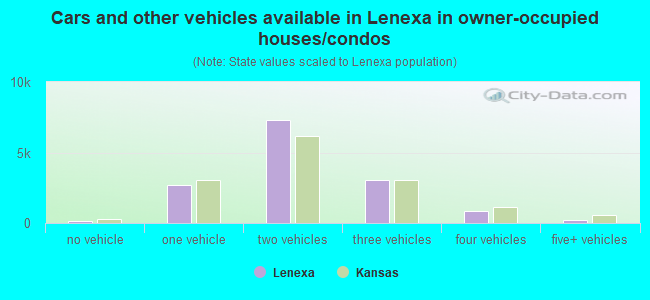
- Cars and other vehicles available in Lenexa in owner-occupied houses/condos
- 114no vehicle
- 2,6741 vehicle
- 7,2982 vehicles
- 3,0833 vehicles
- 8674 vehicles
- 2325+ vehicles
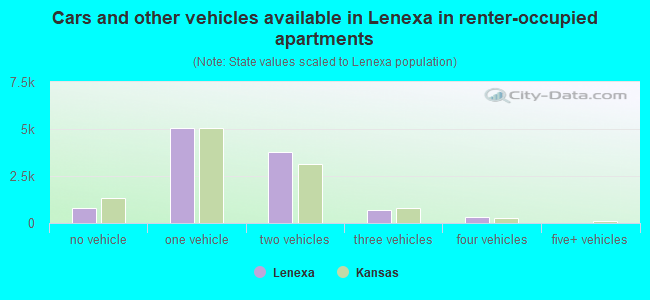
- Cars and other vehicles available in Lenexa in renter-occupied apartments
- 804no vehicle
- 5,0381 vehicle
- 3,7822 vehicles
- 7173 vehicles
- 3204 vehicles
- 05+ vehicles
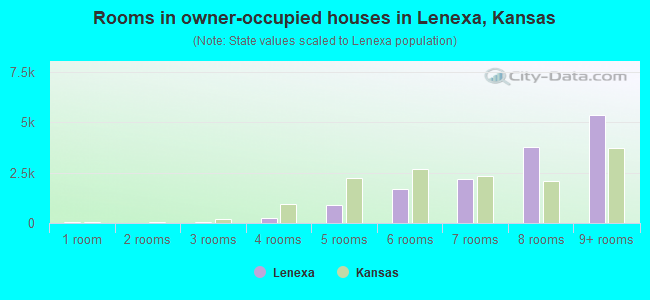
- Rooms in owner-occupied houses in Lenexa, Kansas
- 601 room
- 162 rooms
- 463 rooms
- 2654 rooms
- 8975 rooms
- 1,6756 rooms
- 2,1967 rooms
- 3,7558 rooms
- 5,3589+ rooms
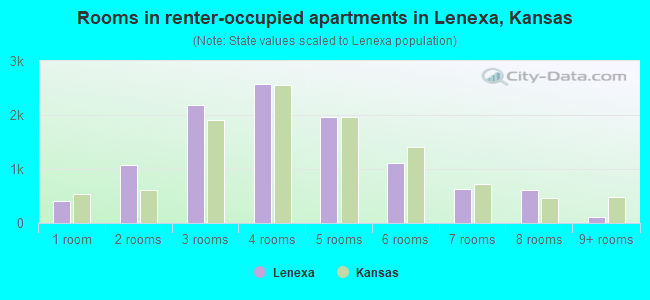
- Rooms in renter-occupied apartments in Lenexa, Kansas
- 4111 room
- 1,0782 rooms
- 2,1933 rooms
- 2,5704 rooms
- 1,9655 rooms
- 1,1086 rooms
- 6217 rooms
- 6068 rooms
- 1089+ rooms
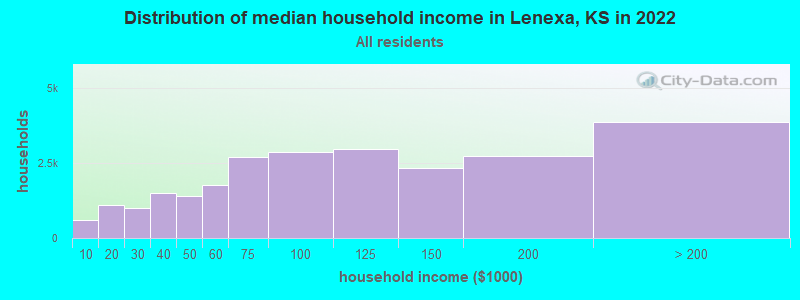
Lenexa, KS household income distribution

- 609Less than $10,000
- 1,096$10,000 to $19,999
- 998$20,000 to $29,999
- 1,515$30,000 to $39,999
- 1,415$40,000 to $49,999
- 1,759$50,000 to $59,999
- 2,721$60,000 to $74,999
- 2,888$75,000 to $99,999
- 2,978$100,000 to $124,999
- 2,330$125,000 to $149,999
- 2,735$150,000 to $199,999
- 3,876$200,000 or more
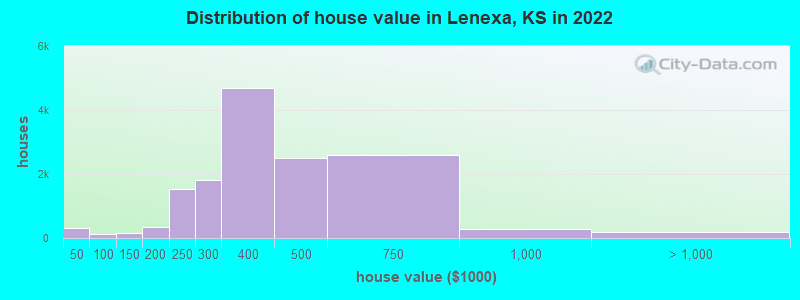
Home value of owner - occupied houses in 2022 in Lenexa, KS
-
- 45Less than $10,000
- 1$10,000 to $14,999
- 98$15,000 to $19,999
- 40$20,000 to $24,999
- 0$25,000 to $29,999
- 15$30,000 to $34,999
- 30$35,000 to $39,999
- 64$40,000 to $49,999
- 24$50,000 to $59,999
- 18$80,000 to $89,999
- 9$90,000 to $99,999
- 47$100,000 to $124,999
- 102$125,000 to $149,999
- 119$150,000 to $174,999
- 214$175,000 to $199,999
- 1,524$200,000 to $249,999
- 1,798$250,000 to $299,999
- 4,687$300,000 to $399,999
- 2,505$400,000 to $499,999
- 2,588$500,000 to $749,999
- 276$750,000 to $999,999
- 150$1,000,000 to $1,499,999
- 33$2,000,000 or more
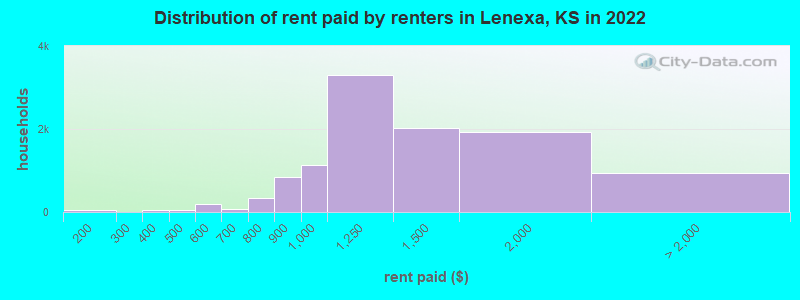
Rent paid by renters in 2022 in Lenexa, KS
-
- 49$150 to $199
- 7$200 to $249
- 50$350 to $399
- 30$400 to $449
- 7$450 to $499
- 46$500 to $549
- 151$550 to $599
- 65$600 to $649
- 16$650 to $699
- 123$700 to $749
- 218$750 to $799
- 853$800 to $899
- 1,126$900 to $999
- 3,301$1,000 to $1,249
- 2,034$1,250 to $1,499
- 1,923$1,500 to $1,999
- 158$2,000 to $2,499
- 66$2,500 to $2,999
- 267$3,000 to $3,499
- 310$3,500 or more
- 142No cash rent
Percentage of workers working in this county: 80.2%
Number of people working at home: 8,397 (24.9% of all workers)
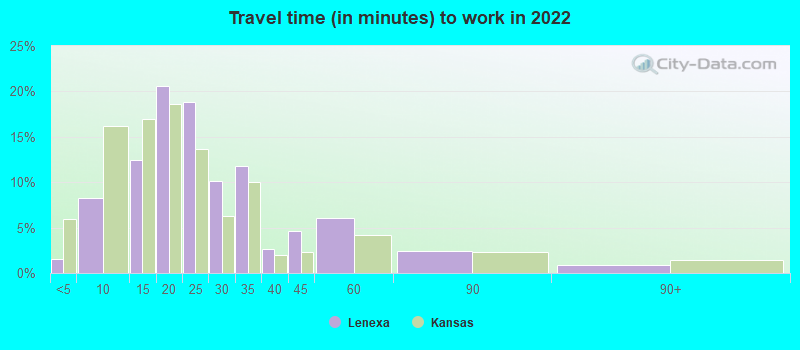
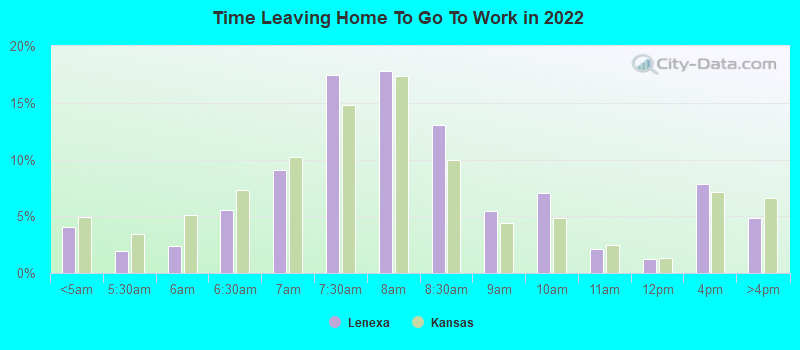
Travel time to work (commute)
- Less than 5 minutes: 530
- 5 to 9 minutes: 3,081
- 10 to 14 minutes: 4,477
- 15 to 19 minutes: 5,821
- 20 to 24 minutes: 4,854
- 25 to 29 minutes: 2,335
- 30 to 34 minutes: 2,579
- 35 to 39 minutes: 343
- 40 to 44 minutes: 492
- 45 to 59 minutes: 558
- 60 to 89 minutes: 320
- 90 or more minutes: 120
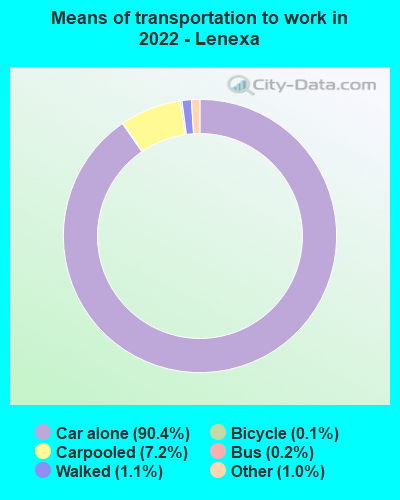
Means of transportation to work:
- Drove a car alone: 42,932 (74.9%)
- Carpooled: 3,224 (5.6%)
- Bus: 169 (0.3%)
- Subway or elevated rail: 43 (0.1%)
- Taxi: 729 (1.3%)
- Bicycle: 46 (0.1%)
- Walked: 534 (0.9%)
- Worked at home: 8,397 (14.6%)
- Unemployment by race in 2022
- Unemployment rate for White non-Hispanic residents
- 2.6%Males
- 1.1%Females
- Unemployment rate for Black residents
- 2.4%Males
- 2.5%Females
- Unemployment rate for American Indian and Alaska Native residents
- 4.1%Females
- Unemployment rate for Asian residents
- 0.5%Females
- Unemployment rate for other race residents
- 2.6%Females
- Unemployment rate for two or more race residents
- 4.8%Males
- 10.1%Females
- Unemployment rate for Hispanic or Latino residents
- 2.5%Males
- 10.3%Females
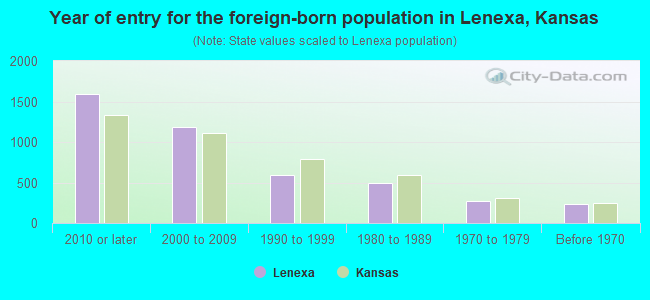
- Year of entry for the foreign-born population in Lenexa, Kansas
- 1,5922010 or later
- 1,1892000 to 2009
- 5871990 to 1999
- 4991980 to 1989
- 2771970 to 1979
- 229Before 1970
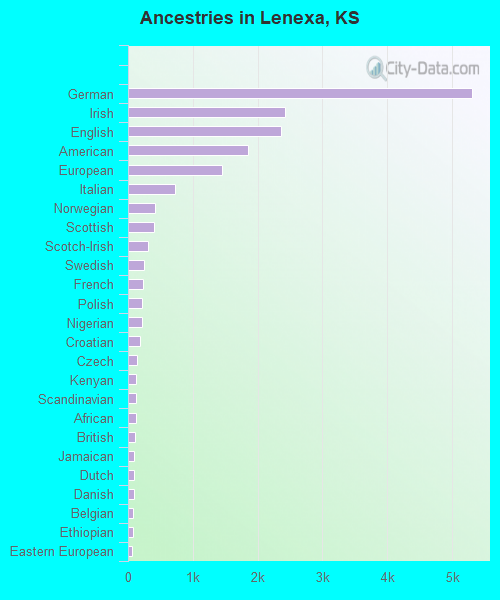
First ancestries reported:
- German: 5,305 (20.1%)
- Irish: 2,416 (9.2%)
- English: 2,355 (8.9%)
- American: 1,848 (7.0%)
- European: 1,458 (5.5%)
- Italian: 726 (2.8%)
- Norwegian: 414 (1.6%)
- Scottish: 396 (1.5%)
- Scotch-Irish: 314 (1.2%)
- Swedish: 242 (0.9%)
- French: 225 (0.9%)
- Polish: 221 (0.8%)
- Nigerian: 220 (0.8%)
- Croatian: 191 (0.7%)
- Czech: 133 (0.5%)
- Kenyan: 124 (0.5%)
- Scandinavian: 124 (0.5%)
- African: 119 (0.5%)
- British: 101 (0.4%)
- Jamaican: 92 (0.3%)
- Dutch: 86 (0.3%)
- Danish: 85 (0.3%)
- Belgian: 77 (0.3%)
- Ethiopian: 77 (0.3%)
- Eastern European: 66 (0.3%)
- Lebanese: 62 (0.2%)
- Swiss: 60 (0.2%)
- Welsh: 60 (0.2%)
- Ukrainian: 53 (0.2%)
- Northern European: 48 (0.2%)
- Ghanaian: 42 (0.2%)
- Hungarian: 41 (0.2%)
- Slovak: 27 (0.1%)
- Brazilian: 27 (0.1%)
- Russian: 25 (0.09%)
- Lithuanian: 21 (0.08%)
- Iranian: 21 (0.08%)
- Austrian: 19 (0.07%)
- Arab: 16 (0.06%)
- Luxembourger: 11 (0.04%)
- Turkish: 11 (0.04%)
- German Russian: 10 (0.04%)
- Pennsylvania German: 7 (0.03%)
- French Canadian: 7 (0.03%)
- Slavic: 7 (0.03%)
- Romanian: 6 (0.02%)
- Slovene: 2 (0.01%)
Most common places of birth for foreign-born residents (%):
| Lenexa: | 19.9% (868) |
| Kansas: | 39.2% (81,282) |
| Lenexa: | 10.5% (459) |
| Kansas: | 6.5% (13,547) |
| Lenexa: | 5.6% (244) |
| Kansas: | 1.6% (3,322) |
| Lenexa: | 5.1% (224) |
| Kansas: | 3.5% (7,355) |
| Lenexa: | 4.5% (195) |
| Kansas: | 3.9% (8,053) |
| Lenexa: | 4.4% (193) |
| Kansas: | 0.9% (1,901) |
| Lenexa: | 4.4% (192) |
| Kansas: | 5.5% (11,323) |
| Lenexa: | 3.6% (158) |
| Kansas: | 0.5% (1,058) |
| Lenexa: | 3.5% (151) |
| Kansas: | 0.8% (1,646) |
| Lenexa: | 3.1% (136) |
| Kansas: | 1.6% (3,353) |
| Lenexa: | 2.9% (128) |
| Kansas: | 0.9% (1,963) |
| Lenexa: | 2.8% (124) |
| Kansas: | 0.8% (1,695) |
| Lenexa: | 2.7% (119) |
| Kansas: | 0.7% (1,362) |
| Lenexa: | 2.1% (90) |
| Kansas: | 0.2% (518) |
| Lenexa: | 2.0% (89) |
| Kansas: | 1.6% (3,349) |
| Lenexa: | 1.7% (74) |
| Kansas: | 0.5% (1,022) |
| Lenexa: | 1.7% (72) |
| Kansas: | 1.5% (3,082) |
| Lenexa: | 1.6% (68) |
| Kansas: | 2.6% (5,492) |
| Lenexa: | 1.5% (67) |
| Kansas: | 0.8% (1,732) |
Place of birth for U.S.-born residents:
- This state: 26,126
- Other state: 27,486
- Northeast: 1,701
- Midwest: 16,514
- South: 5,282
- West: 4,029
84.8% of Lenexa residents lived in the same house 1 years ago.
Out of people who lived in different houses, 36.5% lived in this county.
Out of people who lived in different counties, 23.1% lived in Kansas.
| Lenexa: | 84.8% |
| State average: | 85.3% |
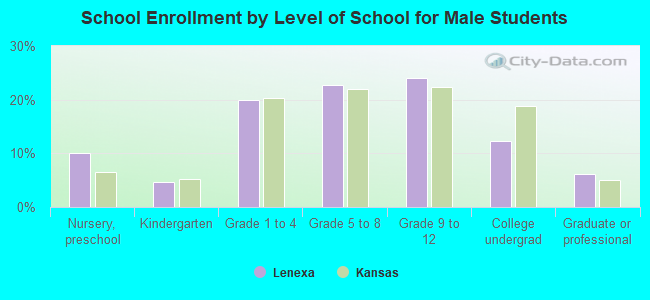
Education attainment for males 25 years and older:
- No schooling: 189
- Nursery to 4th grade: 15
- 5th and 6th grade: 8
- 7th and 8th grade: 7
- 9th grade: 40
- 10th grade: 31
- 11th grade: 9
- 12th grade, no diploma: 173
- High school graduate (or equivalency): 2,892
- Less than 1 year of college: 1,357
- Some college more than 1 year, no degree: 2,234
- Associate degree: 1,345
- Bachelor's degree: 7,619
- Master's degree: 2,933
- Professional school degree: 921
- Doctorate degree: 485

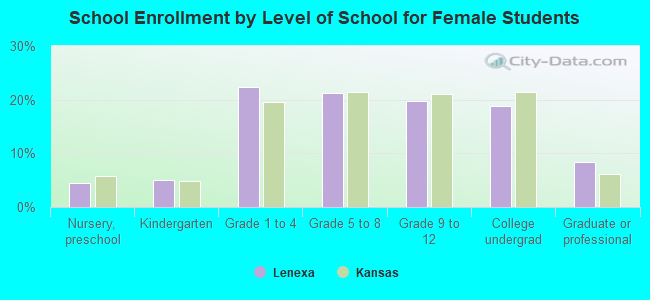
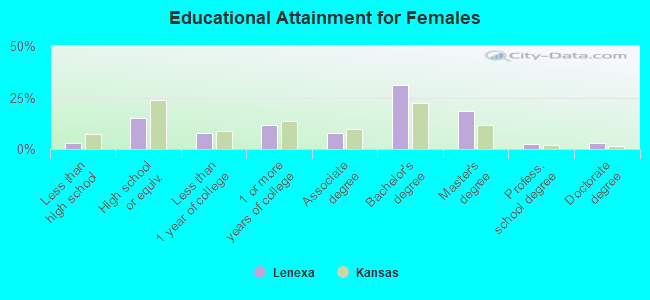
Education attainment for females 25 years and older:
- No schooling: 166
- Nursery to 4th grade: 80
- 5th and 6th grade: 27
- 7th and 8th grade: 35
- 9th grade: 23
- 10th grade: 19
- 11th grade: 83
- 12th grade, no diploma: 180
- High school graduate (or equivalency): 3,058
- Less than 1 year of college: 1,565
- Some college more than 1 year, no degree: 2,350
- Associate degree: 1,622
- Bachelor's degree: 6,392
- Master's degree: 3,739
- Professional school degree: 541
- Doctorate degree: 584
Housing units in structures:
- One, detached: 14,721
- One, attached: 2,294
- Two: 264
- 3 or 4: 998
- 5 to 9: 2,203
- 10 to 19: 2,369
- 20 to 49: 1,629
- 50 or more: 1,587
- Mobile homes: 25
Housing units lacking complete kitchen facilities in 2022: 1.1%
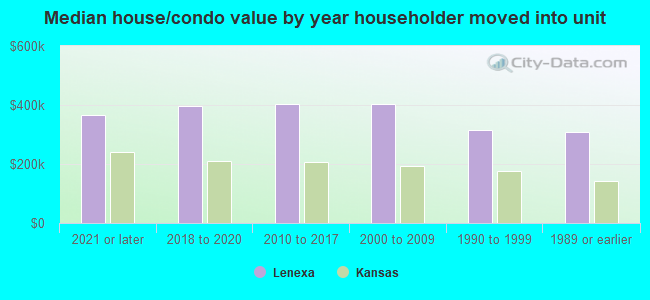
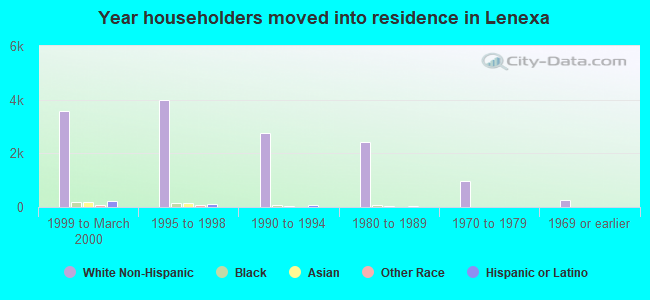
House/condo owner moved in on average 11 years ago
Renter moved in on average 1 years ago
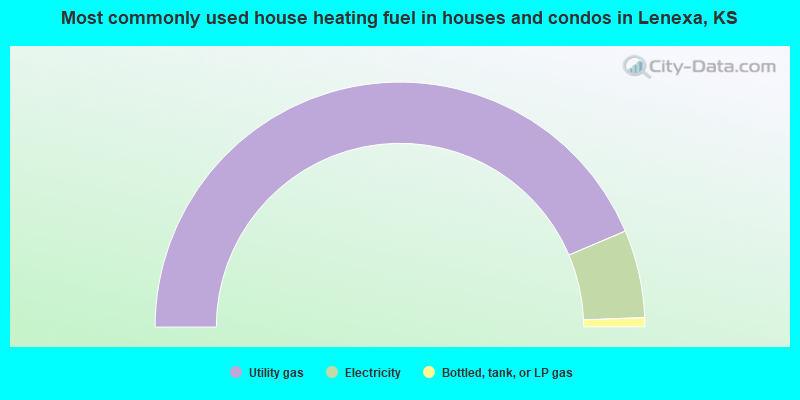
- 87.2%Utility gas
- 11.6%Electricity
- 1.2%Bottled, tank, or LP gas
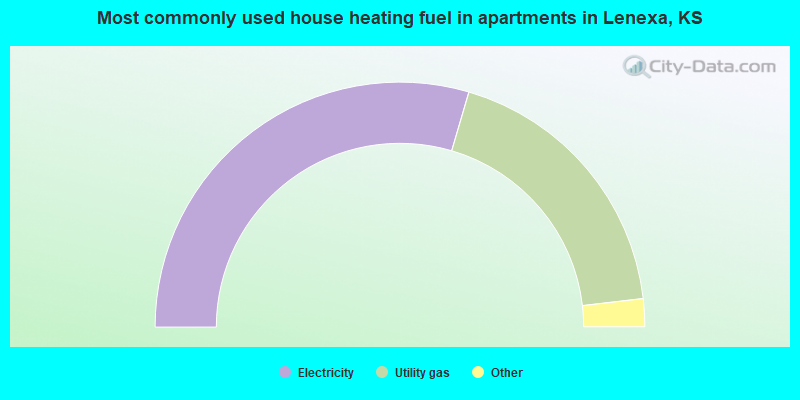
- 59.1%Electricity
- 37.2%Utility gas
- 3.1%Bottled, tank, or LP gas
- 0.4%No fuel used
- 0.2%Fuel oil, kerosene, etc.
Private vs. public school enrollment:
| Here: | 19.1% |
| Kansas: | 14.1% |
| Here: | 10.3% |
| Kansas: | 10.8% |
| Here: | 14.1% |
| Kansas: | 15.4% |