Races in Lenexa, Kansas (KS) Detailed Stats
Data:
Races - White alone (%)
Races - White alone (% change since 2000)
Races - Black alone (%)
Races - Black alone (% change since 2000)
Races - American Indian alone (%)
Races - American Indian alone (% change since 2000)
Races - Asian alone (%)
Races - Asian alone (% change since 2000)
Races - Hispanic (%)
Races - Hispanic (% change since 2000)
Races - Native Hawaiian and Other Pacific Islander alone (%)
Races - Native Hawaiian and Other Pacific Islander alone (% change since 2000)
Races - Two or more races(%)
Races - Two or more races(% change since 2000)
Races - Other race alone (%)
Races - Other race alone (% change since 2000)
Racial diversity
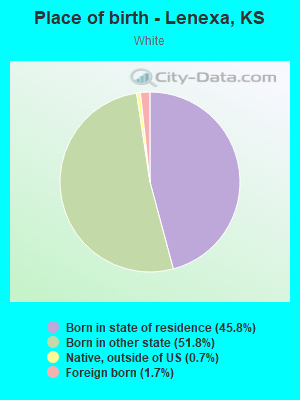
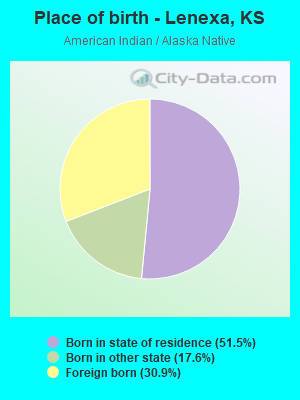
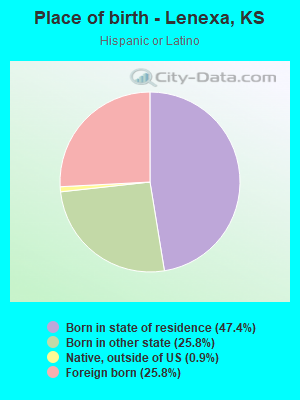
Place of birth - Born in state of residence (%)
Place of birth - Born in state of residence (%) - White
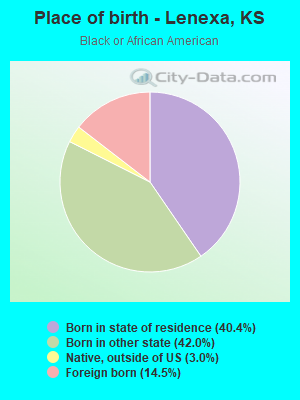
Place of birth - Born in state of residence (%) - Black or African American
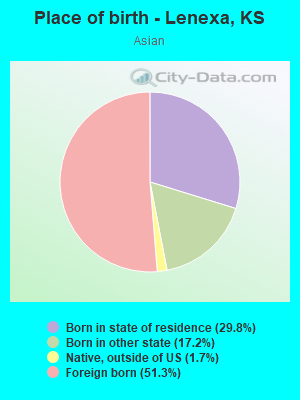
Place of birth - Born in state of residence (%) - Asian
Place of birth - Born in state of residence (%) - Hispanic or Latino
Place of birth - Born in state of residence (%) - American Indian and Alaska Native
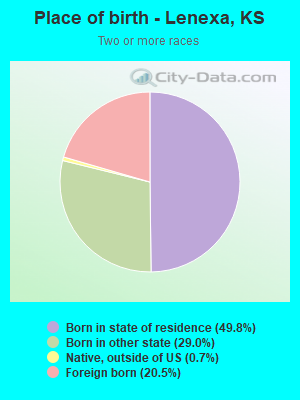
Place of birth - Born in state of residence (%) - Multirace
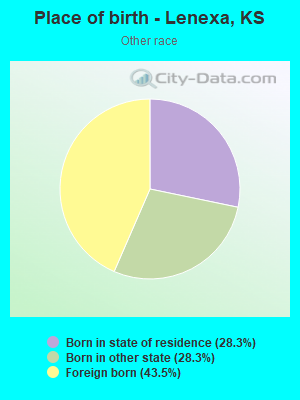
Place of birth - Born in state of residence (%) - Other Race
Place of birth - Born in other state (%)
Place of birth - Born in other state (%) - White
Place of birth - Born in other state (%) - Black or African American
Place of birth - Born in other state (%) - Asian
Place of birth - Born in other state (%) - Hispanic or Latino
Place of birth - Born in other state (%) - American Indian and Alaska Native
Place of birth - Born in other state (%) - Multirace
Place of birth - Born in other state (%) - Other Race
Place of birth - Native, outside of US (%)
Place of birth - Native, outside of US (%) - White
Place of birth - Native, outside of US (%) - Black or African American
Place of birth - Native, outside of US (%) - Asian
Place of birth - Native, outside of US (%) - Hispanic or Latino
Place of birth - Native, outside of US (%) - American Indian and Alaska Native
Place of birth - Native, outside of US (%) - Multirace
Place of birth - Native, outside of US (%) - Other Race
Place of birth - Foreign born (%)
Place of birth - Foreign born (%) - White
Place of birth - Foreign born (%) - Black or African American
Place of birth - Foreign born (%) - Asian
Place of birth - Foreign born (%) - Hispanic or Latino
Place of birth - Foreign born (%) - American Indian and Alaska Native
Place of birth - Foreign born (%) - Multirace
Place of birth - Foreign born (%) - Other Race
Residents speaking English at home (%)
Residents speaking English at home - Born in the United States (%)
Residents speaking English at home - Native, born elsewhere (%)
Residents speaking English at home - Foreign born (%)
Residents speaking Spanish at home (%)
Residents speaking Spanish at home - Born in the United States (%)
Residents speaking Spanish at home - Native, born elsewhere (%)
Residents speaking Spanish at home - Foreign born (%)
Residents speaking other language at home (%)
Residents speaking other language at home - Born in the United States (%)
Residents speaking other language at home - Native, born elsewhere (%)
Residents speaking other language at home - Foreign born (%)
Marital status - Never married (%)
Marital status - Now married (%)
Marital status - Separated (%)
Marital status - Widowed (%)
Marital status - Divorced (%)
Ancestries Reported - Arab (%)
Ancestries Reported - Czech (%)
Ancestries Reported - Danish (%)
Ancestries Reported - Dutch (%)
Ancestries Reported - English (%)
Ancestries Reported - French (%)
Ancestries Reported - French Canadian (%)
Ancestries Reported - German (%)
Ancestries Reported - Greek (%)
Ancestries Reported - Hungarian (%)
Ancestries Reported - Irish (%)
Ancestries Reported - Italian (%)
Ancestries Reported - Lithuanian (%)
Ancestries Reported - Norwegian (%)
Ancestries Reported - Polish (%)
Ancestries Reported - Portuguese (%)
Ancestries Reported - Russian (%)
Ancestries Reported - Scotch-Irish (%)
Ancestries Reported - Scottish (%)
Ancestries Reported - Slovak (%)
Ancestries Reported - Subsaharan African (%)
Ancestries Reported - Swedish (%)
Ancestries Reported - Swiss (%)
Ancestries Reported - Ukrainian (%)
Ancestries Reported - United States (%)
Ancestries Reported - Welsh (%)
Ancestries Reported - West Indian (%)
Ancestries Reported - Other (%)
Geographical mobility - Same house 1 year ago (%)
Geographical mobility - Same house 1 year ago (%) - White
Geographical mobility - Same house 1 year ago (%) - Black or African American
Geographical mobility - Same house 1 year ago (%) - Asian
Geographical mobility - Same house 1 year ago (%) - Hispanic or Latino
Geographical mobility - Same house 1 year ago (%) - American Indian and Alaska Native
Geographical mobility - Same house 1 year ago (%) - Multirace
Geographical mobility - Same house 1 year ago (%) - Other Race
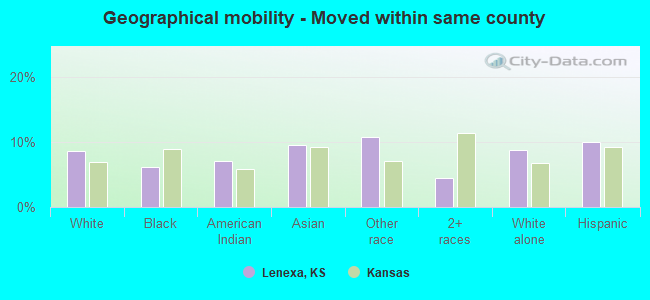
Geographical mobility - Moved within same county (%)
Geographical mobility - Moved within same county (%) - White
Geographical mobility - Moved within same county (%) - Black or African American
Geographical mobility - Moved within same county (%) - Asian
Geographical mobility - Moved within same county (%) - Hispanic or Latino
Geographical mobility - Moved within same county (%) - American Indian and Alaska Native
Geographical mobility - Moved within same county (%) - Multirace
Geographical mobility - Moved within same county (%) - Other Race
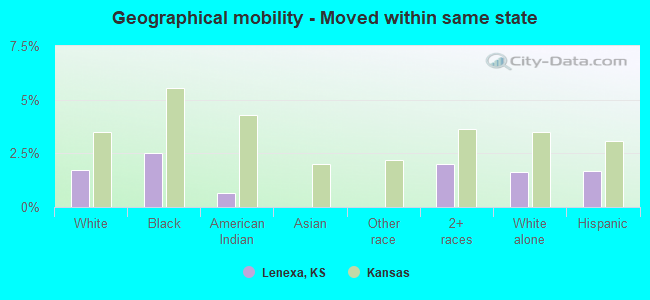
Geographical mobility - Moved from different county within same state (%)
Geographical mobility - Moved from different county within same state (%) - White
Geographical mobility - Moved from different county within same state (%) - Black or African American
Geographical mobility - Moved from different county within same state (%) - Asian
Geographical mobility - Moved from different county within same state (%) - Hispanic or Latino
Geographical mobility - Moved from different county within same state (%) - American Indian and Alaska Native
Geographical mobility - Moved from different county within same state (%) - Multirace
Geographical mobility - Moved from different county within same state (%) - Other Race
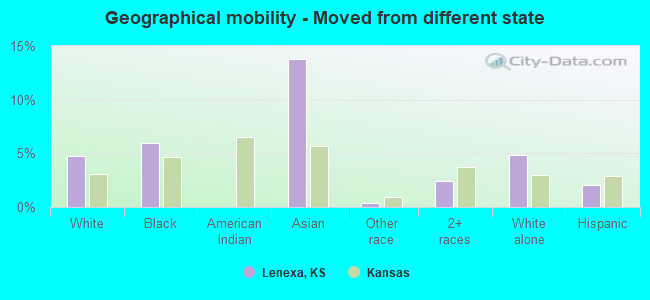
Geographical mobility - Moved from different state (%)
Geographical mobility - Moved from different state (%) - White
Geographical mobility - Moved from different state (%) - Black or African American
Geographical mobility - Moved from different state (%) - Asian
Geographical mobility - Moved from different state (%) - Hispanic or Latino
Geographical mobility - Moved from different state (%) - American Indian and Alaska Native
Geographical mobility - Moved from different state (%) - Multirace
Geographical mobility - Moved from different state (%) - Other Race
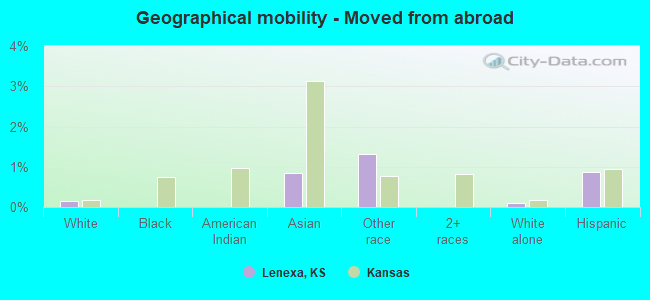
Geographical mobility - Moved from abroad (%)
Geographical mobility - Moved from abroad (%) - White
Geographical mobility - Moved from abroad (%) - Black or African American
Geographical mobility - Moved from abroad (%) - Asian
Geographical mobility - Moved from abroad (%) - Hispanic or Latino
Geographical mobility - Moved from abroad (%) - American Indian and Alaska Native
Geographical mobility - Moved from abroad (%) - Multirace
Geographical mobility - Moved from abroad (%) - Other Race
Place of birth for the foreign-born population - Ireland (%)
Place of birth for the foreign-born population - Denmark (%)
Place of birth for the foreign-born population - Norway (%)
Place of birth for the foreign-born population - Sweden (%)
Place of birth for the foreign-born population - United Kingdom (%)
Place of birth for the foreign-born population - England (%)
Place of birth for the foreign-born population - Scotland (%)
Place of birth for the foreign-born population - Other Northern Europe (%)
Place of birth for the foreign-born population - Austria (%)
Place of birth for the foreign-born population - Belgium (%)
Place of birth for the foreign-born population - France (%)
Place of birth for the foreign-born population - Germany (%)
Place of birth for the foreign-born population - Netherlands (%)
Place of birth for the foreign-born population - Switzerland (%)
Place of birth for the foreign-born population - Other Western Europe (%)
Place of birth for the foreign-born population - Greece (%)
Place of birth for the foreign-born population - Italy (%)
Place of birth for the foreign-born population - Portugal (%)
Place of birth for the foreign-born population - Spain (%)
Place of birth for the foreign-born population - Other Southern Europe (%)
Place of birth for the foreign-born population - Albania (%)
Place of birth for the foreign-born population - Belarus (%)
Place of birth for the foreign-born population - Bosnia and Herzegovina (%)
Place of birth for the foreign-born population - Bulgaria (%)
Place of birth for the foreign-born population - Croatia (%)
Place of birth for the foreign-born population - Czechoslovakia (%)
Place of birth for the foreign-born population - Hungary (%)
Place of birth for the foreign-born population - Latvia (%)
Place of birth for the foreign-born population - Lithuania (%)
Place of birth for the foreign-born population - North Macedonia (Macedonia) (%)
Place of birth for the foreign-born population - Moldova (%)
Place of birth for the foreign-born population - Poland (%)
Place of birth for the foreign-born population - Romania (%)
Place of birth for the foreign-born population - Russia (%)
Place of birth for the foreign-born population - Serbia (%)
Place of birth for the foreign-born population - Ukraine (%)
Place of birth for the foreign-born population - Other Eastern Europe (%)
Place of birth for the foreign-born population - China (%)
Place of birth for the foreign-born population - Hong Kong (%)
Place of birth for the foreign-born population - Taiwan (%)
Place of birth for the foreign-born population - Japan (%)
Place of birth for the foreign-born population - Korea (%)
Place of birth for the foreign-born population - Other Eastern Asia (%)
Place of birth for the foreign-born population - Afghanistan (%)
Place of birth for the foreign-born population - Bangladesh (%)
Place of birth for the foreign-born population - India (%)
Place of birth for the foreign-born population - Iran (%)
Place of birth for the foreign-born population - Kazakhstan (%)
Place of birth for the foreign-born population - Nepal (%)
Place of birth for the foreign-born population - Pakistan (%)
Place of birth for the foreign-born population - Sri Lanka (%)
Place of birth for the foreign-born population - Uzbekistan (%)
Place of birth for the foreign-born population - Other South Central Asia (%)
Place of birth for the foreign-born population - Burma (%)
Place of birth for the foreign-born population - Cambodia (%)
Place of birth for the foreign-born population - Indonesia (%)
Place of birth for the foreign-born population - Laos (%)
Place of birth for the foreign-born population - Malaysia (%)
Place of birth for the foreign-born population - Philippines (%)
Place of birth for the foreign-born population - Singapore (%)
Place of birth for the foreign-born population - Thailand (%)
Place of birth for the foreign-born population - Vietnam (%)
Place of birth for the foreign-born population - Other South Eastern Asia (%)
Place of birth for the foreign-born population - Armenia (%)
Place of birth for the foreign-born population - Iraq (%)
Place of birth for the foreign-born population - Israel (%)
Place of birth for the foreign-born population - Jordan (%)
Place of birth for the foreign-born population - Kuwait (%)
Place of birth for the foreign-born population - Lebanon (%)
Place of birth for the foreign-born population - Saudi Arabia (%)
Place of birth for the foreign-born population - Syria (%)
Place of birth for the foreign-born population - Turkey (%)
Place of birth for the foreign-born population - Yemen (%)
Place of birth for the foreign-born population - Other Western Asia (%)
Place of birth for the foreign-born population - Eritrea (%)
Place of birth for the foreign-born population - Ethiopia (%)
Place of birth for the foreign-born population - Kenya (%)
Place of birth for the foreign-born population - Somalia (%)
Place of birth for the foreign-born population - Uganda (%)
Place of birth for the foreign-born population - Zimbabwe (%)
Place of birth for the foreign-born population - Other Eastern Africa (%)
Place of birth for the foreign-born population - Cameroon (%)
Place of birth for the foreign-born population - Congo (%)
Place of birth for the foreign-born population - Democratic Republic of Congo (Zaire) (%)
Place of birth for the foreign-born population - Other Middle Africa (%)
Place of birth for the foreign-born population - Egypt (%)
Place of birth for the foreign-born population - Morocco (%)
Place of birth for the foreign-born population - Sudan (%)
Place of birth for the foreign-born population - Other Northern Africa (%)
Place of birth for the foreign-born population - South Africa (%)
Place of birth for the foreign-born population - Other Southern Africa (%)
Place of birth for the foreign-born population - Cabo Verde (%)
Place of birth for the foreign-born population - Ghana (%)
Place of birth for the foreign-born population - Liberia (%)
Place of birth for the foreign-born population - Nigeria (%)
Place of birth for the foreign-born population - Senegal (%)
Place of birth for the foreign-born population - Sierra Leone (%)
Place of birth for the foreign-born population - Other Western Africa (%)
Place of birth for the foreign-born population - Australia (%)
Place of birth for the foreign-born population - New Zealand (%)
Place of birth for the foreign-born population - Fiji (%)
Place of birth for the foreign-born population - Micronesia (%)
Place of birth for the foreign-born population - Bahamas (%)
Place of birth for the foreign-born population - Barbados (%)
Place of birth for the foreign-born population - Cuba (%)
Place of birth for the foreign-born population - Dominica (%)
Place of birth for the foreign-born population - Dominican Republic (%)
Place of birth for the foreign-born population - Grenada (%)
Place of birth for the foreign-born population - Haiti (%)
Place of birth for the foreign-born population - Jamaica (%)
Place of birth for the foreign-born population - St. Vincent and the Grenadines (%)
Place of birth for the foreign-born population - Trinidad and Tobago (%)
Place of birth for the foreign-born population - West Indies (%)
Place of birth for the foreign-born population - Other Caribbean (%)
Place of birth for the foreign-born population - Belize (%)
Place of birth for the foreign-born population - Costa Rica (%)
Place of birth for the foreign-born population - El Salvador (%)
Place of birth for the foreign-born population - Guatemala (%)
Place of birth for the foreign-born population - Honduras (%)
Place of birth for the foreign-born population - Mexico (%)
Place of birth for the foreign-born population - Nicaragua (%)
Place of birth for the foreign-born population - Panama (%)
Place of birth for the foreign-born population - Other Central America (%)
Place of birth for the foreign-born population - Argentina (%)
Place of birth for the foreign-born population - Bolivia (%)
Place of birth for the foreign-born population - Brazil (%)
Place of birth for the foreign-born population - Chile (%)
Place of birth for the foreign-born population - Colombia (%)
Place of birth for the foreign-born population - Ecuador (%)
Place of birth for the foreign-born population - Guyana (%)
Place of birth for the foreign-born population - Peru (%)
Place of birth for the foreign-born population - Uruguay (%)
Place of birth for the foreign-born population - Venezuela (%)
Place of birth for the foreign-born population - Other South America (%)
Place of birth for the foreign-born population - Canada (%)
Place of birth for the foreign-born population - Other Northern America (%)
Place of birth for the foreign-born population - Other (%)
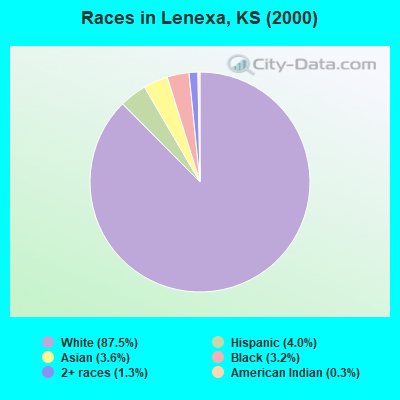
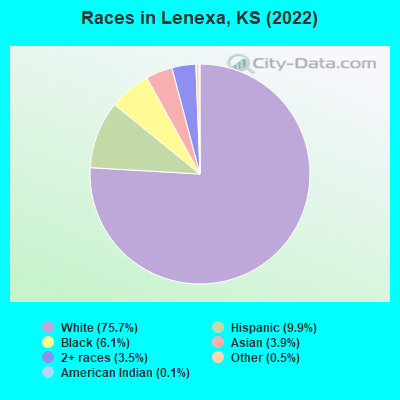
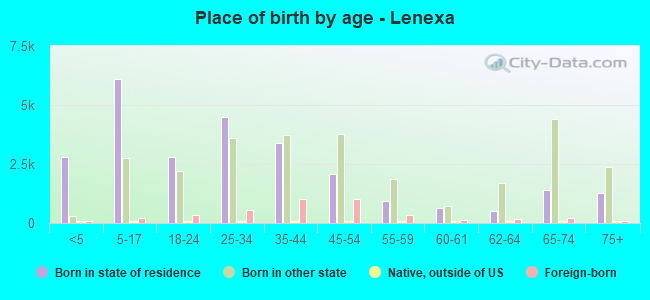
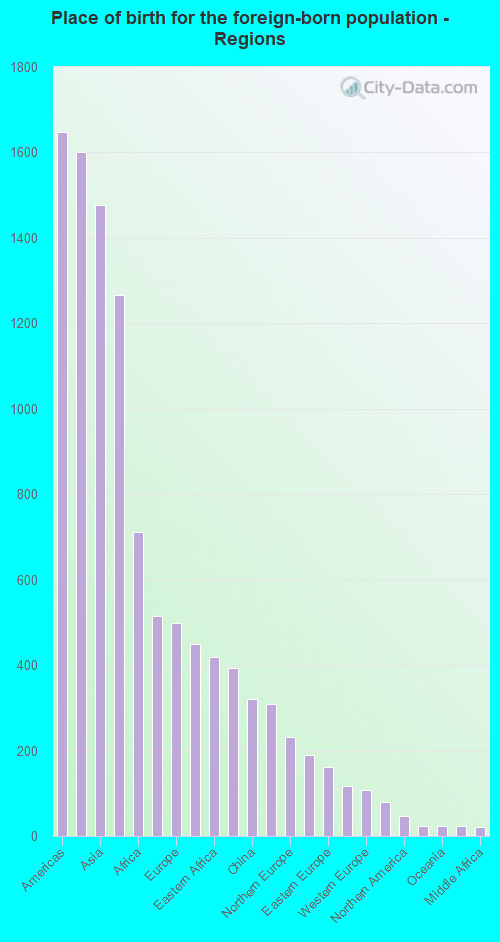
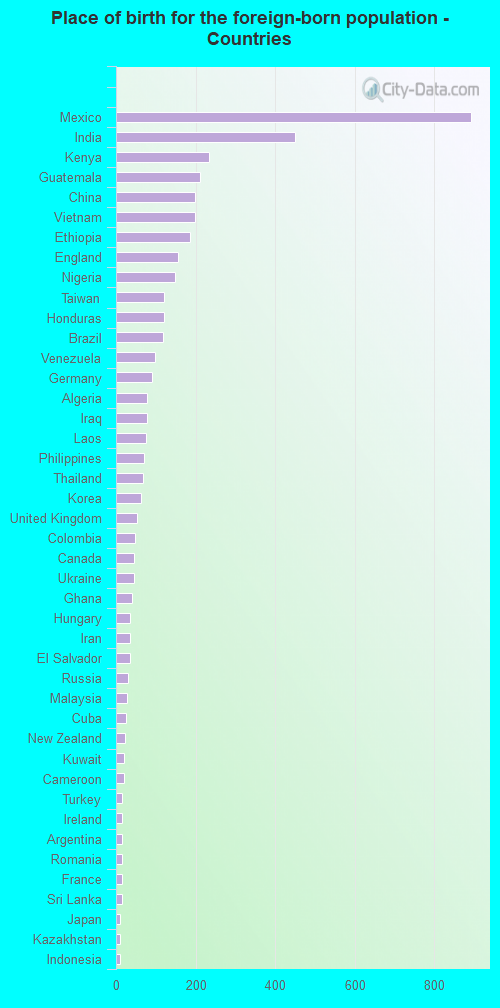
According to 2022 data, the most numerous races in Lenexa, KS are White alone (44,153 residents), Hispanic (5,774 residents), and Black alone (3,543 residents). 91.4% of Lenexa residents speak English at home. 7.5% of Lenexa, KS residents are foreign-born (2.7% born in Latin America, 2.5% born in Asia, 1.2% born in Africa, 0.9% born in Europe), which is 6.4% greater than the foreign-born rate of 7.0% across the entire state of Kansas.
Race distribution in Lenexa
2000 2022
2,233,997 83.1% White alone 188,252 7.0% Hispanic 151,407 5.6% Black alone 46,301 1.7% Asian alone 42,508 1.6% Two or more races 22,322 0.8% American Indian alone 2,477 0.09% Other race alone 1,154 0.04% Native Hawaiian and Other
2,147,943 73.1% White alone 381,746 13.0% Hispanic 147,666 5.0% Black alone 145,362 4.9% Two or more races 85,085 2.9% Asian alone 13,263 0.5% Other race alone 12,065 0.4% American Indian alone 4,020 0.1% Native Hawaiian and Other
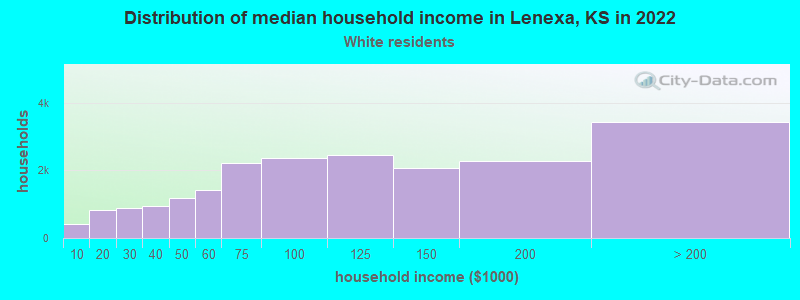
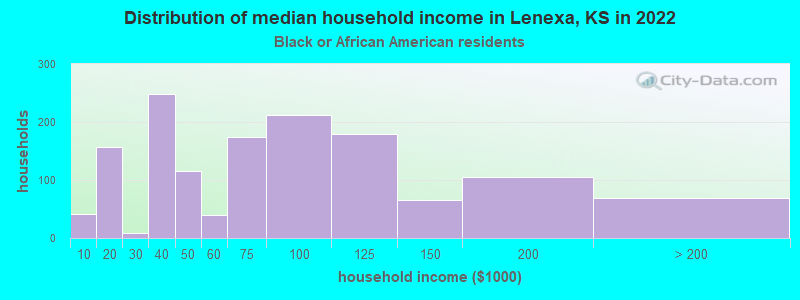
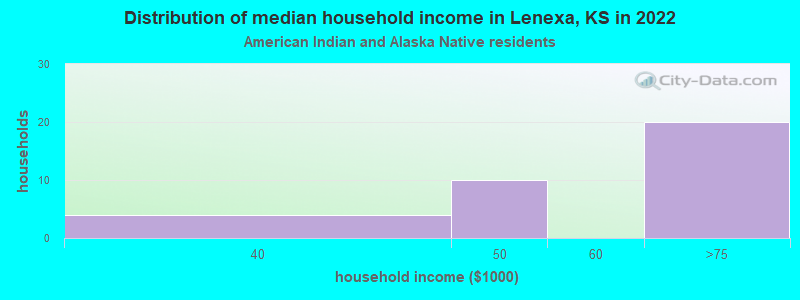
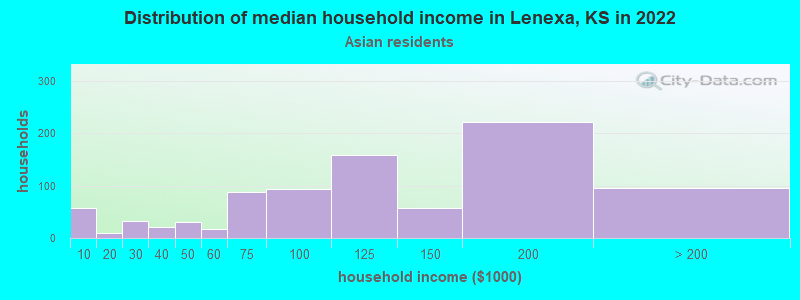
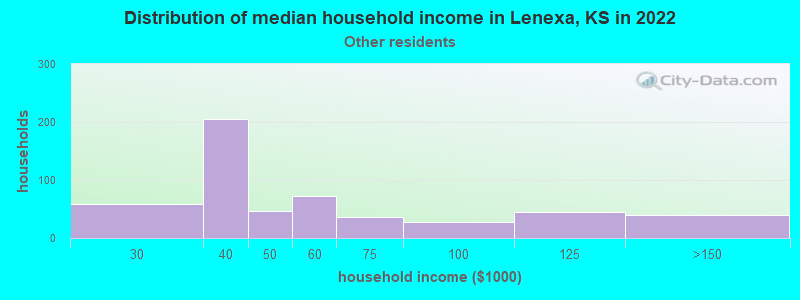
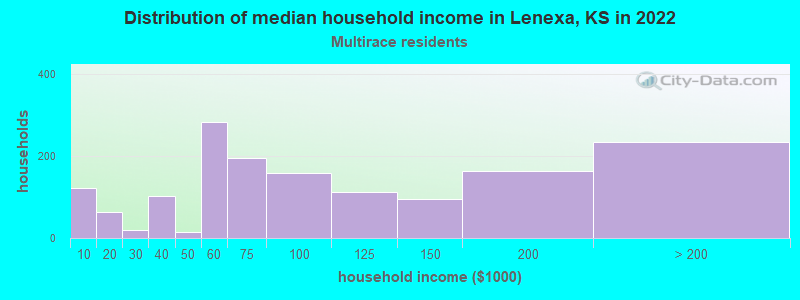
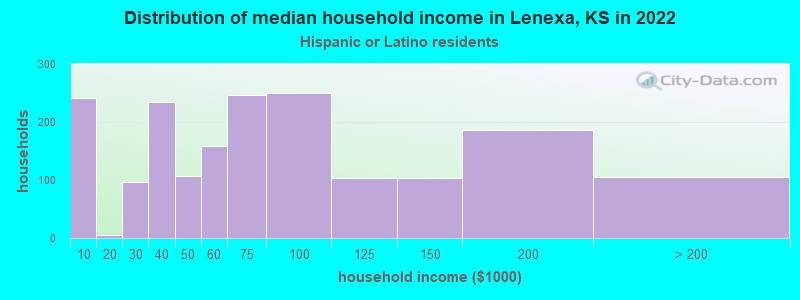
Income and house value in Lenexa Median household income in 2022 $99,443 White non-Hispanic householders$72,185 Black householders$93,964 American Indian and Alaska Native householders$109,639 Asian householders$47,850 Some other race householders$78,031 Two or more races householders$65,829 Hispanic or Latino race householdersMedian 2022 house value $377,742 White Non-Hispanic householders$404,621 Black or African American householders$221,989 American Indian or Alaska Native householders $356,623 Asian householders$325,425 Some other race householders$329,984 Two or more races householders$340,304 Hispanic or Latino householders
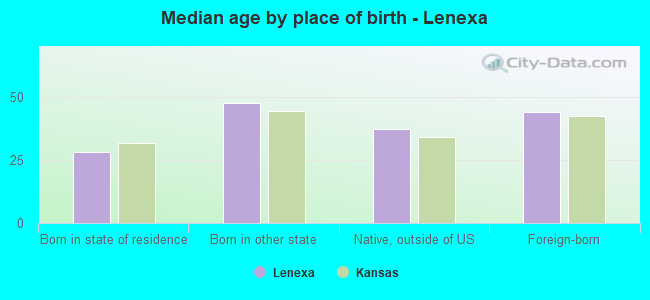
Median age by race in Lenexa
40.9 Median age for White residents40.1 42.0 31.6 Median age for Black or African American residents27.7 37.6 29.2 Median age for American Indian / Alaska Native residents17.2 36.0 40.6 Median age for Asian residents37.5 43.2 -1,068,376,067.3 Median age for Native Hawaiian / Pacific Islander residents-669,240,668.6 -641,269,840.6 30.5 Median age for Other race residents30.1 41.7 23.7 Median age for Two or more races residents25.3 22.6 41.2 Median age for White alone residents40.1 43.6 25.1 Median age for Hispanic or Latino residents24.9 25.4
Owner/renter occupied households by race in Lenexa
House owners and renters - White residents 12,360 60.0% Owner occupied8,236 40.0% Renter occupiedHouse owners and renters - Black or African American residents 255 18.4% Owner occupied1,133 81.6% Renter occupiedHouse owners and renters - American Indian / Alaska Native residents 33 100.0% Renter occupiedHouse owners and renters - Asian residents 541 63.5% Owner occupied311 36.5% Renter occupiedHouse owners and renters - Other race residents 139 22.7% Owner occupied474 77.3% Renter occupiedHouse owners and renters - Two or more races residents 801 49.4% Owner occupied822 50.6% Renter occupiedHouse owners and renters - White alone residents 12,201 59.9% Owner occupied8,179 40.1% Renter occupiedHouse owners and renters - Hispanic or Latino residents 673 37.9% Owner occupied1,101 62.1% Renter occupied
Language usage in Lenexa
English speakers - Total 91.4% of residents of Lenexa speak English at home.
4.0% of residents speak Spanish at home 1,477 66.5% Speak English very well745 33.5% Speak English less than very well4.7% of residents speak other language at home 1,787 68.6% Speak English very well817 31.4% Speak English less than very well
English speakers - Born in the United States 96.9% of residents of Lenexa speak English at home.
1.7% of residents speak Spanish at home 425 90.6% Speak English very well44 9.4% Speak English less than very well1.4% of residents speak other language at home 368 98.7% Speak English very well5 1.3% Speak English less than very well
English speakers - Native, born elsewhere 89.2% of residents of Lenexa speak English at home.
1.2% of residents speak Spanish at home 6 100.0% Speak English less than very well11.6% of residents speak other language at home 51 89.5% Speak English very well6 10.5% Speak English less than very well
English speakers - Foreign-born 24.5% of residents of Lenexa speak English at home.
35.0% of residents speak Spanish at home 821 56.7% Speak English very well627 43.3% Speak English less than very well42.9% of residents speak other language at home 1,036 58.4% Speak English very well739 41.6% Speak English less than very well
White (Caucasian) - Speak only English Native:
98.4% (41,392)Foreign-born:
55.9% (417)
White (Caucasian) - Speak another language Native:
1.7% (720)Foreign-born:
50.5% (377)
Black or African American - Speak only English Native:
94.8% (2,966)Foreign-born:
15.6% (91)
Black or African American - Speak another language Native:
5.2% (164)Foreign-born:
80.5% (469)
American Indian / Alaska Native - Speak another language Native:
27.7% (63)Foreign-born:
100.0% (131)
Asian - Speak only English Native:
85.4% (1,002)Foreign-born:
18.8% (227)
Asian - Speak another language Native:
21.5% (253)Foreign-born:
80.7% (974)
Other race - Speak only English Native:
70.6% (638)Foreign-born:
9.7% (68)
Other race - Speak another language Native:
27.7% (250)Foreign-born:
81.4% (572)
Two or more races - Speak only English Native:
92.6% (3,368)Foreign-born:
15.9% (182)
Two or more races - Speak another language Native:
6.5% (238)Foreign-born:
83.2% (950)
White alone - Speak only English Native:
98.4% (40,714)Foreign-born:
52.4% (387)
White alone - Speak another language Native:
1.6% (662)Foreign-born:
47.9% (353)
Hispanic or Latino - Speak only English Native:
85.0% (2,979)Foreign-born:
16.4% (244)
Hispanic or Latino - Speak another language Native:
18.6% (652)Foreign-born:
85.9% (1,273)
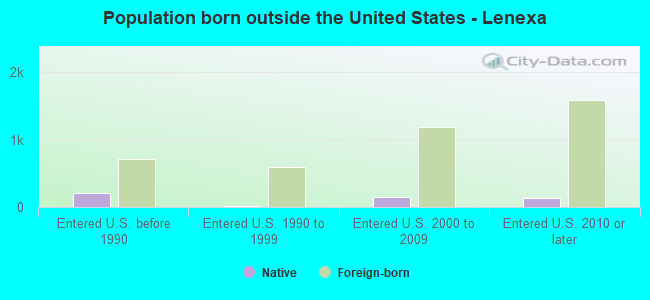
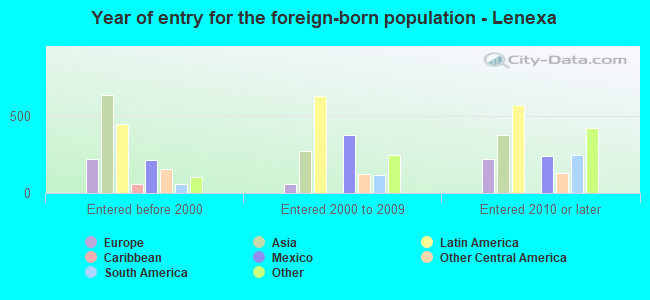
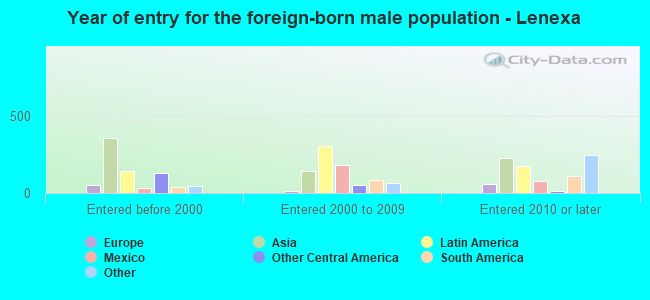
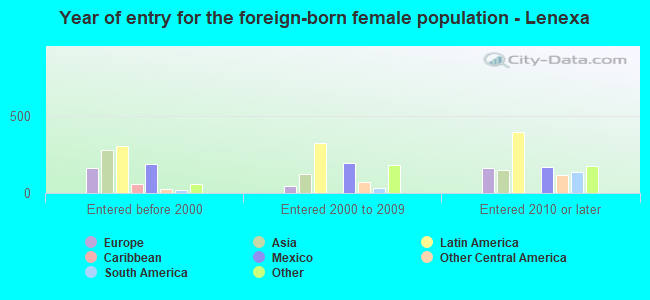
Foreign-born residents in Lenexa 4,360 residents are foreign born (2.7% Latin America , 2.5% Asia , 1.2% Africa , 0.9% Europe ).
This city:
7.5%Kansas:
7.1%
Marital status for residents in Lenexa Marital status - White (Caucasian) population 15 years and over
Males 31.0% Never married57.4% Now married1.2% Separated1.9% Widowed8.6% DivorcedFemales 23.0% Never married54.7% Now married1.2% Separated8.9% Widowed12.3% DivorcedWomen who gave birth in the past 12 months Now married:
94.3% (601)Unmarried:
5.7% (37)
Women who did not give birth in the past 12 months Now married:
48.4% (4,546)Unmarried:
51.6% (4,847)
Marital status - Black or African American population 15 years and over
Males 50.6% Never married38.7% Now married0.0% Separated0.4% Widowed10.3% DivorcedFemales 37.4% Never married39.5% Now married1.4% Separated8.3% Widowed13.4% DivorcedWomen who gave birth in the past 12 months Now married:
35.0% (8)Unmarried:
65.0% (14)
Women who did not give birth in the past 12 months Now married:
44.6% (506)Unmarried:
55.4% (629)
Marital status - American Indian / Alaska Native population 15 years and over
Males 34.4% Never married29.5% Now married29.5% Separated0.0% Widowed6.6% DivorcedFemales 32.8% Never married33.3% Now married0.0% Separated18.4% Widowed15.5% DivorcedWomen who did not give birth in the past 12 months Now married:
29.4% (40)Unmarried:
70.6% (95)
Marital status - Asian population 15 years and over
Males 34.1% Never married59.6% Now married0.1% Separated0.0% Widowed6.3% DivorcedFemales 26.8% Never married65.4% Now married0.0% Separated3.5% Widowed4.2% DivorcedWomen who gave birth in the past 12 months Now married:
100.0% (15)Unmarried:
0.0% (0)
Women who did not give birth in the past 12 months Now married:
55.1% (365)Unmarried:
44.9% (297)
Marital status - Other race population 15 years and over
Males 48.9% Never married32.0% Now married0.0% Separated0.0% Widowed19.1% DivorcedFemales 46.5% Never married39.3% Now married12.2% Separated0.4% Widowed1.6% DivorcedWomen who gave birth in the past 12 months Now married:
100.0% (67)Unmarried:
0.0% (0)
Women who did not give birth in the past 12 months Now married:
51.2% (257)Unmarried:
48.8% (245)
Marital status - Two or more races population 15 years and over
Males 35.2% Never married63.2% Now married0.4% Separated0.0% Widowed1.2% DivorcedFemales 39.8% Never married53.0% Now married4.4% Separated1.4% Widowed1.5% DivorcedWomen who gave birth in the past 12 months Now married:
5.4% (5)Unmarried:
94.6% (88)
Women who did not give birth in the past 12 months Now married:
56.0% (660)Unmarried:
44.0% (519)
Marital status - White alone, not Hispanic / Latino population 15 years and over
Males 31.1% Never married57.3% Now married1.1% Separated1.9% Widowed8.5% DivorcedFemales 22.1% Never married55.1% Now married1.2% Separated9.1% Widowed12.4% DivorcedWomen who gave birth in the past 12 months Now married:
95.1% (592)Unmarried:
4.9% (31)
Women who did not give birth in the past 12 months Now married:
49.1% (4,517)Unmarried:
50.9% (4,683)
Marital status - Hispanic or Latino population 15 years and over
Males 37.1% Never married56.0% Now married2.2% Separated0.0% Widowed4.6% DivorcedFemales 50.3% Never married39.2% Now married5.6% Separated0.9% Widowed3.9% DivorcedWomen who gave birth in the past 12 months Now married:
45.8% (58)Unmarried:
54.2% (69)
Women who did not give birth in the past 12 months Now married:
40.0% (663)Unmarried:
60.0% (994)
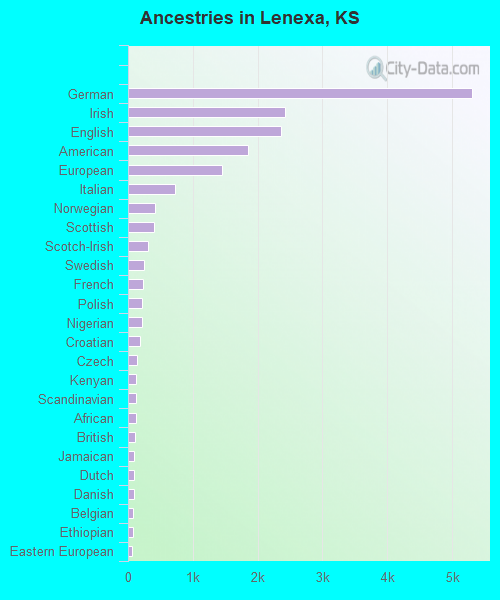
Ancestries in Lenexa
5,305 20.1% German2,416 9.2% Irish2,355 8.9% English1,848 7.0% American1,458 5.5% European726 2.8% Italian414 1.6% Norwegian396 1.5% Scottish314 1.2% Scotch-Irish242 0.9% Swedish225 0.9% French221 0.8% Polish220 0.8% Nigerian191 0.7% Croatian133 0.5% Czech124 0.5% Kenyan124 0.5% Scandinavian119 0.5% African101 0.4% British92 0.3% Jamaican86 0.3% Dutch85 0.3% Danish77 0.3% Belgian77 0.3% Ethiopian66 0.3% Eastern European62 0.2% Lebanese60 0.2% Swiss60 0.2% Welsh53 0.2% Ukrainian48 0.2% Northern European42 0.2% Ghanaian41 0.2% Hungarian27 0.1% Slovak27 0.1% Brazilian25 0.09% Russian21 0.08% Lithuanian21 0.08% Iranian19 0.07% Austrian16 0.06% Arab11 0.04% Luxembourger11 0.04% Turkish10 0.04% German Russian7 0.03% Pennsylvania German7 0.03% French Canadian7 0.03% Slavic6 0.02% Romanian2 0.01% Slovene
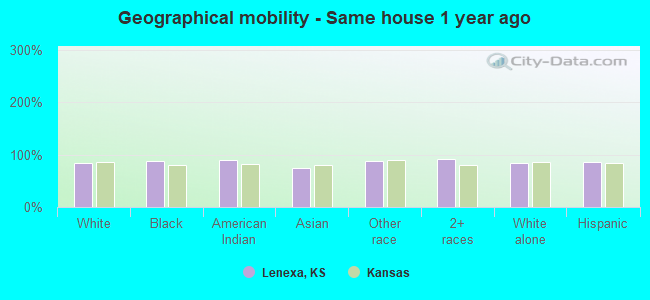
Geographical mobility in Lenexa Same house 1 year ago 37,273 84.5% White (Caucasian)3,425 88.0% Black or African American327 89.3% American Indian / Alaska Native1,805 75.2% Asian1,361 87.4% Other race4,855 91.0% Two or more races36,752 84.5% White alone, not Hispanic / Latino4,889 86.2% Hispanic or LatinoMoved within same county 3,807 8.6% White / Caucasian237 6.1% Black or African American26 7.1% American Indian / Alaska Native231 9.6% Asian168 10.8% Other race239 4.5% Two or more races3,790 8.7% White alone, not Hispanic / Latino564 9.9% Hispanic or LatinoMoved within same state 752 1.7% White / Caucasian98 2.5% Black or African American2 0.6% American Indian / Alaska Native107 2.0% Two or more races711 1.6% White alone, not Hispanic / Latino95 1.7% Hispanic or LatinoMoved from different state 2,104 4.8% White / Caucasian231 5.9% Black or African American332 13.8% Asian6 0.4% Other race132 2.5% Two or more races2,100 4.8% White alone, not Hispanic / Latino116 2.0% Hispanic or LatinoMoved from abroad 61 0.1% White20 0.8% Asian20 1.3% Other race42 0.1% White alone, not Hispanic / Latino49 0.9% Hispanic or Latino
Children Nativity (place of birth) in Lenexa
Children under 6 years - Living with two parents Both parents native 2,626 98.7% Native35 1.3% Foreign-bornBoth parents foreign-born 303 86.0% Native49 14.0% Foreign-bornOne native, one foreign-born parent 78 90.7% Native8 9.3% Foreign-bornChildren under 6 years - Living with one parent Native parent 373 100.0% NativeForeign-born parent 45 100.0% NativeChildren 6 to 17 years - Living with two parents Both parents native 5,165 99.5% Native24 0.5% Foreign-bornBoth parents foreign-born 468 73.1% Native172 26.9% Foreign-bornOne native, one foreign-born parent 641 97.6% Native16 2.4% Foreign-bornChildren 6 to 17 years - Living with one parent Native parent 2,019 100.0% NativeForeign-born parent 132 55.0% Native108 45.0% Foreign-born
Grandparents responsible for own grandchildren in Lenexa
Grandparents (30 to 59 years) White / Caucasian 69 37.4% Responsible for grandchildren116 62.6% Not responsible for grandchildrenWhite alone, not Hispanic / Latino 73 40.2% Responsible for grandchildren108 59.8% Not responsible for grandchildrenHispanic or Latino 25 100.0% Not responsible for grandchildrenGrandparents (60 years and over) White / Caucasian 19 7.4% Responsible for grandchildren237 92.6% Not responsible for grandchildrenWhite alone, not Hispanic / Latino 19 6.9% Responsible for grandchildren256 93.1% Not responsible for grandchildrenHispanic or Latino 2 100.0% Responsible for grandchildren