La Vista, NE (Nebraska) Houses and Residents
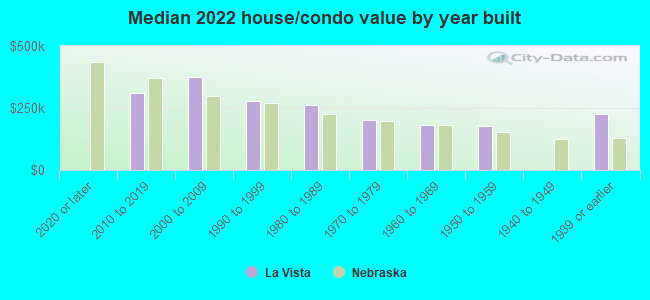
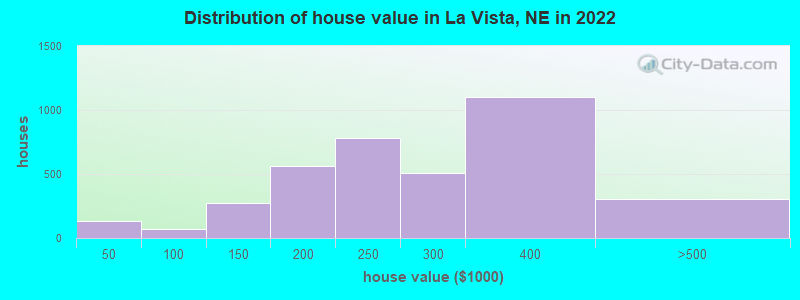
Estimated median house or condo value in 2022: $250,529 (it was $92,600 in 2000 )
La Vista:
$250,529Nebraska:
$232,400
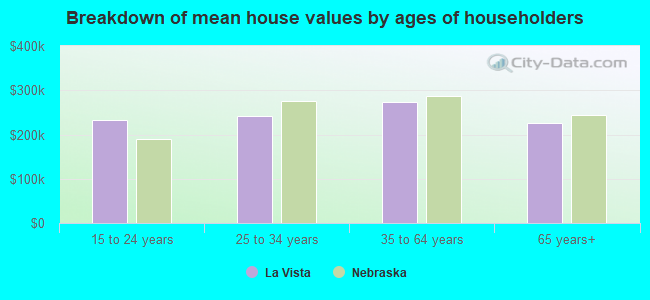
Lower value quartile - upper value quartile: $181,734 - $334,407Mean price in 2022: Detached houses: $252,330 Here:
$252,330State:
$274,677
Townhouses or other attached units: $77,992 Here:
$77,992State:
$245,619
In 5-or-more-unit structures: $369,466 Here:
$369,466State:
$476,911
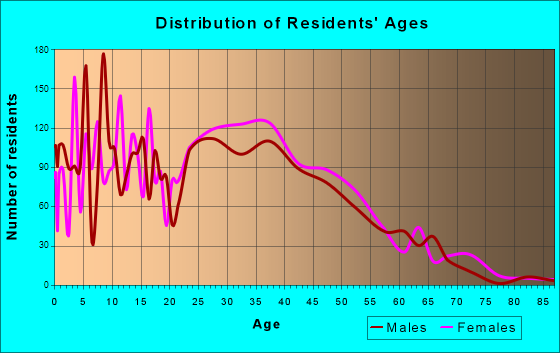
Total population: 17,636 (Urban population: 11,719, Rural population: 0)
Houses: 7,797 (7,532 occupied: 4,180 owner occupied, 3,439 renter occupied )
% of renters here:
45%State:
34%
Housing density: 2,742 houses/condos per square mile
Median price asked for vacant for-sale houses and condos in 2022: $186,523.
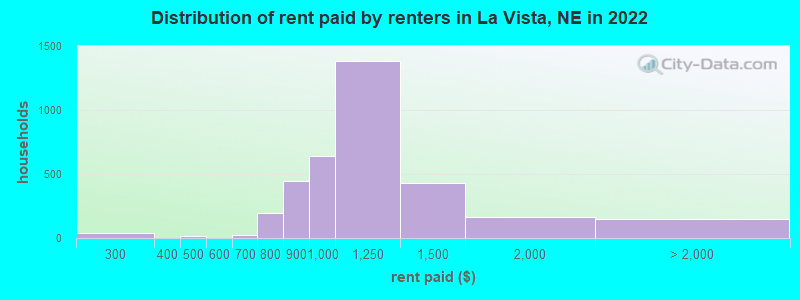
Median contract rent in 2022: $1,074 (lower quartile is $942, upper quartile is $1,260)
Median rent asked for vacant for-rent units in 2022: $910
Median gross rent in La Vista, NE in 2022: $1,213
Housing units in La Vista with a mortgage: 3,111 (244 second mortgage, 0 home equity loan, 206 both second mortgage and home equity loan )Houses without a mortgage: 42
Median household income for houses/condos with a mortgage: $110,723
Median household income for apartments without a mortgage: $97,444
Median monthly housing costs: $1,260
Data:
Median house or condo value ($)
Median house or condo value ($ change since 2000)
Median house or condo value ($) - White
Median house or condo value ($) - Black or African American
Median house or condo value ($) - Asian
Median house or condo value ($) - Hispanic or Latino
Median house or condo value ($) - American Indian and Alaska Native
Median house or condo value ($) - Multirace
Median house or condo value ($) - Other Race
Median price asked for mobile homes ($)
Household density (households per square mile)
Mean house or condo value by units in structure - 1, detached ($)
Mean house or condo value by units in structure - 1, attached ($)
Mean house or condo value by units in structure - 2 ($)
Mean house or condo value by units in structure by units in structure - 3 or 4 ($)
Mean house or condo value by units in structure - 5 or more ($)
Mean house or condo value by units in structure - Boat, RV, van, etc. ($)
Mean house or condo value by units in structure - Mobile home ($)
Median contract rent ($)
Median contract rent - Lower quartile ($)
Median contract rent - Upper quartile ($)
Median gross rent ($)
Urban houses (%)
Rural houses (%)
Houses occupied (%)
Houses occupied (% change since 2000)
Houses owner occupied (%)
Houses owner occupied (% change since 2000)
Houses renter occupied (%)
Houses renter occupied (% change since 2000)
Vacant housing units - For rent (%)
Vacant housing units - For rent (% change since 2000)
Vacant housing units - For sale only (%)
Vacant housing units - For sale only (% change since 2000)
Vacant housing units - Rented or sold, not occupied (%)
Vacant housing units - Rented or sold, not occupied (% change since 2000)
Vacant housing units - For seasonal, recreational, or occasional use (%)
Vacant housing units - For seasonal, recreational, or occasional use (% change since 2000)
Vacant housing units - For migrant workers (%)
Vacant housing units - For migrant workers (% change since 2000)
Vacant housing units - Other vacant (%)
Vacant housing units - Other vacant (% change since 2000)
Median monthly housing costs ($)
Median household income for houses/condos with a mortgage ($)
Median household income for houses/condos without a mortgage ($)
Median household income ($)
Median household income ($) - White
Median household income ($) - Black or African American
Median household income ($) - Asian
Median household income ($) - Hispanic or Latino
Median household income ($) - American Indian and Alaska Native
Median household income ($) - Multirace
Median household income ($) - Other Race
Mortgage status - with mortgage (%)
Mortgage status - with second mortgage (%)
Mortgage status - with home equity loan (%)
Mortgage status - with both second mortgage and home equity loan (%)
Mortgage status - without a mortgage (%)
Median year house/condo built
Median year apartment built
Household type by relationship - Male householder living alone (%)
Household type by relationship - Male householder not living alone (%)
Household type by relationship - Female householder living alone (%)
Household type by relationship - Female householder not living alone (%)
Household type by relationship - Opposite-Sex spouse (%)
Household type by relationship - Same-Sex spouse (%)
Household type by relationship - Opposite-Sex unmarried partner (%)
Household type by relationship - Same-Sex unmarried partner (%)
Household type by relationship - In group quarters (%)
Size of family households - 2-person household (%)
Size of family households - 3-person household (%)
Size of family households - 4-person household (%)
Size of family households - 5-person household (%)
Size of family households - 6-person household (%)
Size of family households - 7-or-more-person household (%)
Size of nonfamily households - 1-person household (%)
Size of nonfamily households - 2-person household (%)
Size of nonfamily households - 3-person household (%)
Size of nonfamily households - 4-person household (%)
Size of nonfamily households - 5-person household (%)
Size of nonfamily households - 6-person household (%)
Size of nonfamily households - 7-or-moreperson household (%)
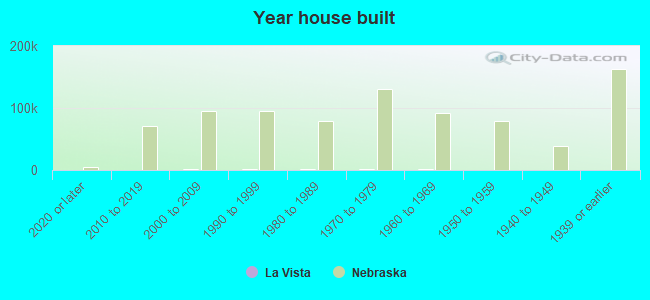
Year house built - Built 2010 or later (%)
Year house built - Built 2000 to 2009 (%)
Year house built - Built 1990 to 1999 (%)
Year house built - Built 1980 to 1989 (%)
Year house built - Built 1970 to 1979 (%)
Year house built - Built 1960 to 1969 (%)
Year house built - Built 1950 to 1959 (%)
Year house built - Built 1940 to 1949 (%)
Year house built - Built 1939 or earlier (%)
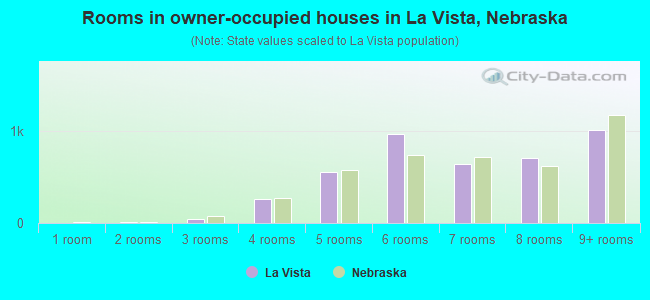
Median number of rooms in houses and condos
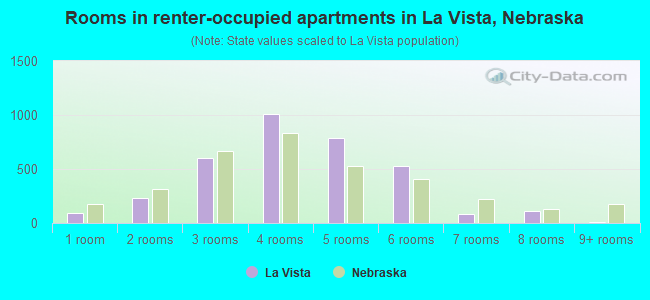
Median number of rooms in apartments
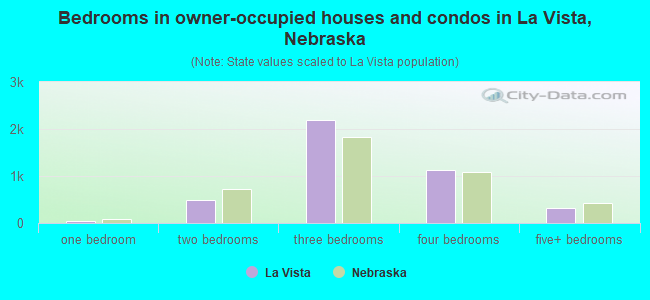
Median number of bedrooms in owner occupied houses
Mean number of bedrooms in owner occupied houses
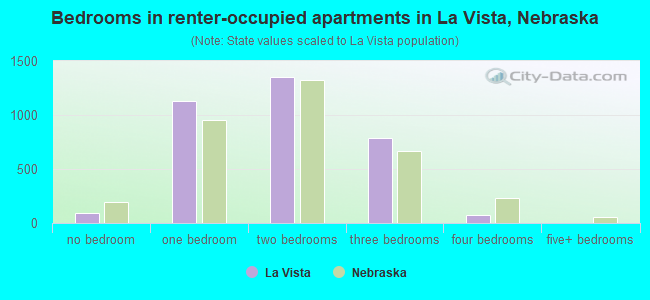
Median number of bedrooms in renter occupied houses
Mean number of bedrooms in renter occupied houses
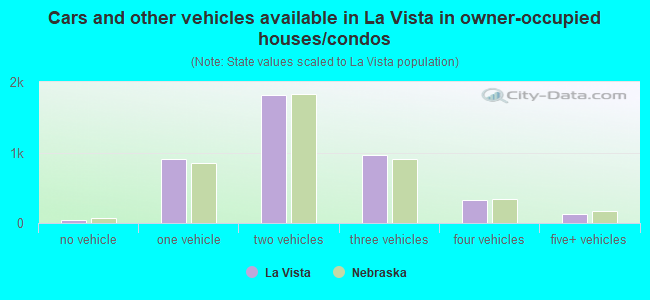
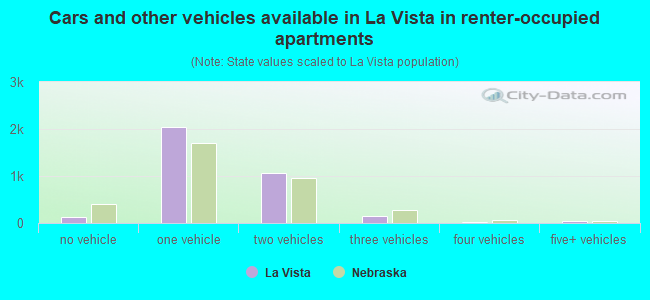
Median number of vehichles in owner occupied houses
Mean number of vehichles in owner occupied houses
Median number of vehichles in renter occupied houses
Mean number of vehichles in renter occupied houses
Rooms in owner-occupied houses - 1 room (%)
Rooms in owner-occupied houses - 2 rooms (%)
Rooms in owner-occupied houses - 3 rooms (%)
Rooms in owner-occupied houses - 4 rooms (%)
Rooms in owner-occupied houses - 5 rooms (%)
Rooms in owner-occupied houses - 6 rooms (%)
Rooms in owner-occupied houses - 7 rooms (%)
Rooms in owner-occupied houses - 8 rooms (%)
Rooms in owner-occupied houses - 9+ rooms (%)
Rooms in renter-occupied houses - 1 room (%)
Rooms in renter-occupied houses - 2 rooms (%)
Rooms in renter-occupied houses - 3 rooms (%)
Rooms in renter-occupied houses - 4 rooms (%)
Rooms in renter-occupied houses - 5 rooms (%)
Rooms in renter-occupied houses - 6 rooms (%)
Rooms in renter-occupied houses - 7 rooms (%)
Rooms in renter-occupied houses - 8 rooms (%)
Rooms in renter-occupied houses - 9+ rooms (%)
Bedrooms in owner-occupied houses - no bedrooms (%)
Bedrooms in owner-occupied houses - 1 bedroom (%)
Bedrooms in owner-occupied houses - 2 bedrooms (%)
Bedrooms in owner-occupied houses - 3 bedrooms (%)
Bedrooms in owner-occupied houses - 4 bedrooms (%)
Bedrooms in owner-occupied houses - 5+ bedrooms (%)
Bedrooms in renter-occupied houses - no bedrooms (%)
Bedrooms in renter-occupied houses - 1 bedroom (%)
Bedrooms in renter-occupied houses - 2 bedrooms (%)
Bedrooms in renter-occupied houses - 3 bedrooms (%)
Bedrooms in renter-occupied houses - 4 bedrooms (%)
Bedrooms in renter-occupied houses - 5+ bedrooms (%)
Vehicles available in owner-occupied houses - no vehicle available (%)
Vehicles available in owner-occupied houses - 1 vehicle available(%)
Vehicles available in owner-occupied houses - 2 Vehicles available (%)
Vehicles available in owner-occupied houses - 3 Vehicles available (%)
Vehicles available in owner-occupied houses - 4 Vehicles available (%)
Vehicles available in owner-occupied houses - 5+ Vehicles available (%)
Vehicles available in renter-occupied houses - no vehicle available (%)
Vehicles available in renter-occupied houses - 1 vehicle available (%)
Vehicles available in renter-occupied houses - 2 Vehicles available (%)
Vehicles available in renter-occupied houses - 3 Vehicles available (%)
Vehicles available in renter-occupied houses - 4 Vehicles available (%)
Vehicles available in renter-occupied houses - 5+ Vehicles available (%)
Housing units in structures - 1, detached (%)
Housing units in structures - 1, attached (%)
Housing units in structures - 2 (%)
Housing units in structures - 3 or 4 (%)
Housing units in structures - 5 to 9 (%)
Housing units in structures - 10 to 19 (%)
Housing units in structures - 20 to 49 (%)
Housing units in structures - 50 or more (%)
Housing units in structures - Mobile home (%)
Housing units in structures - Boat, RV, van, etc. (%)
Housing units in structures - Owners - 1, detached (%)
Housing units in structures - Owners - 1, attached (%)
Housing units in structures - Owners - 2 (%)
Housing units in structures - Owners - 3 or 4 (%)
Housing units in structures - Owners - 5 to 9 (%)
Housing units in structures - Owners - 10 to 19 (%)
Housing units in structures - Owners - 20 to 49 (%)
Housing units in structures - Owners - 50 or more (%)
Housing units in structures - Owners - Mobile home (%)
Housing units in structures - Owners - Boat, RV, van, etc. (%)
Housing units in structures - Renters - 1, detached (%)
Housing units in structures - Renters - 1, attached (%)
Housing units in structures - Renters - 2 (%)
Housing units in structures - Renters - 3 or 4 (%)
Housing units in structures - Renters - 5 to 9 (%)
Housing units in structures - Renters - 10 to 19 (%)
Housing units in structures - Renters - 20 to 49 (%)
Housing units in structures - Renters - 50 or more (%)
Housing units in structures - Renters - Mobile home (%)
Housing units in structures - Renters - Boat, RV, van, etc. (%)
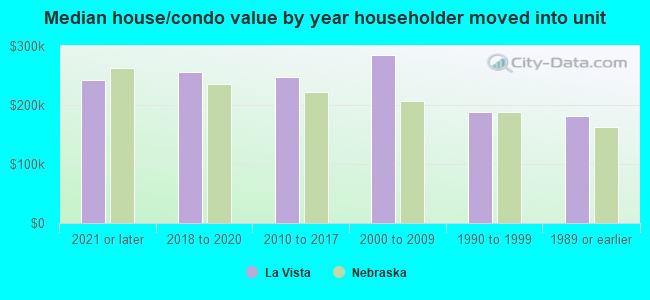
House/condo owner moved in on average (years ago)
Renter moved in on average (years ago)
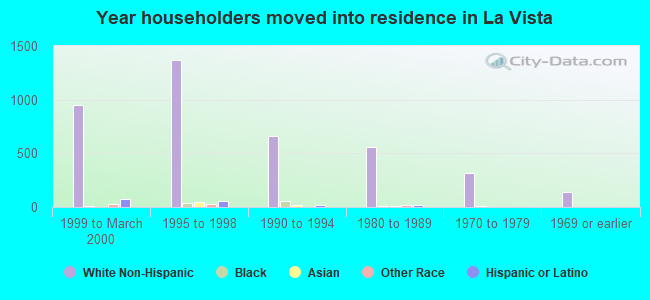
Year householder moved into unit - Moved in 1999 to March 2000 (%)
Year householder moved into unit - Moved in 1999 to March 2000 (%) - White
Year householder moved into unit - Moved in 1999 to March 2000 (%) - Black or African American
Year householder moved into unit - Moved in 1999 to March 2000 (%) - Asian
Year householder moved into unit - Moved in 1999 to March 2000 (%) - Hispanic or Latino
Year householder moved into unit - Moved in 1999 to March 2000 (%) - American Indian and Alaska Native
Year householder moved into unit - Moved in 1999 to March 2000 (%) - Multirace
Year householder moved into unit - Moved in 1999 to March 2000 (%) - Other Race
Year householder moved into unit - Moved in 1995 to 1998 (%)
Year householder moved into unit - Moved in 1995 to 1998 (%) - White
Year householder moved into unit - Moved in 1995 to 1998 (%) - Black or African American
Year householder moved into unit - Moved in 1995 to 1998 (%) - Asian
Year householder moved into unit - Moved in 1995 to 1998 (%) - Hispanic or Latino
Year householder moved into unit - Moved in 1995 to 1998 (%) - American Indian and Alaska Native
Year householder moved into unit - Moved in 1995 to 1998 (%) - Multirace
Year householder moved into unit - Moved in 1995 to 1998 (%) - Other Race
Year householder moved into unit - Moved in 1990 to 1994 (%)
Year householder moved into unit - Moved in 1990 to 1994 (%) - White
Year householder moved into unit - Moved in 1990 to 1994 (%) - Black or African American
Year householder moved into unit - Moved in 1990 to 1994 (%) - Asian
Year householder moved into unit - Moved in 1990 to 1994 (%) - Hispanic or Latino
Year householder moved into unit - Moved in 1990 to 1994 (%) - American Indian and Alaska Native
Year householder moved into unit - Moved in 1990 to 1994 (%) - Multirace
Year householder moved into unit - Moved in 1990 to 1994 (%) - Other Race
Year householder moved into unit - Moved in 1980 to 1989 (%)
Year householder moved into unit - Moved in 1980 to 1989 (%) - White
Year householder moved into unit - Moved in 1980 to 1989 (%) - Black or African American
Year householder moved into unit - Moved in 1980 to 1989 (%) - Asian
Year householder moved into unit - Moved in 1980 to 1989 (%) - Hispanic or Latino
Year householder moved into unit - Moved in 1980 to 1989 (%) - American Indian and Alaska Native
Year householder moved into unit - Moved in 1980 to 1989 (%) - Multirace
Year householder moved into unit - Moved in 1980 to 1989 (%) - Other Race
Year householder moved into unit - Moved in 1970 to 1979 (%)
Year householder moved into unit - Moved in 1970 to 1979 (%) - White
Year householder moved into unit - Moved in 1970 to 1979 (%) - Black or African American
Year householder moved into unit - Moved in 1970 to 1979 (%) - Asian
Year householder moved into unit - Moved in 1970 to 1979 (%) - Hispanic or Latino
Year householder moved into unit - Moved in 1970 to 1979 (%) - American Indian and Alaska Native
Year householder moved into unit - Moved in 1970 to 1979 (%) - Multirace
Year householder moved into unit - Moved in 1970 to 1979 (%) - Other Race
Year householder moved into unit - Moved in 1969 or earlier (%)
Year householder moved into unit - Moved in 1969 or earlier (%) - White
Year householder moved into unit - Moved in 1969 or earlier (%) - Black or African American
Year householder moved into unit - Moved in 1969 or earlier (%) - Asian
Year householder moved into unit - Moved in 1969 or earlier (%) - Hispanic or Latino
Year householder moved into unit - Moved in 1969 or earlier (%) - American Indian and Alaska Native
Year householder moved into unit - Moved in 1969 or earlier (%) - Multirace
Year householder moved into unit - Moved in 1969 or earlier (%) - Other Race
Housing units lacking complete plumbing facilities (%)
Housing units lacking complete kitchen facilities (%)
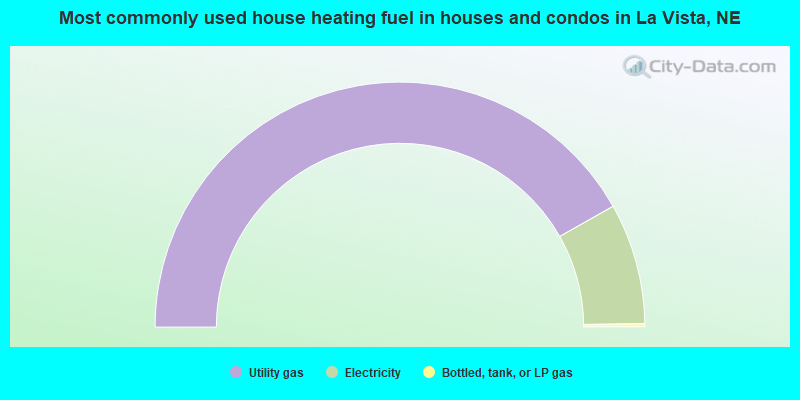
House heating fuel used in houses and condos - Utility gas (%)
House heating fuel used in houses and condos - Bottled, tank, or LP gas (%)
House heating fuel used in houses and condos - Electricity (%)
House heating fuel used in houses and condos - Fuel oil, kerosene, etc. (%)
House heating fuel used in houses and condos - Coal or coke (%)
House heating fuel used in houses and condos - Wood (%)
House heating fuel used in houses and condos - Solar energy (%)
House heating fuel used in houses and condos - Other fuel (%)
House heating fuel used in houses and condos - No fuel used (%)
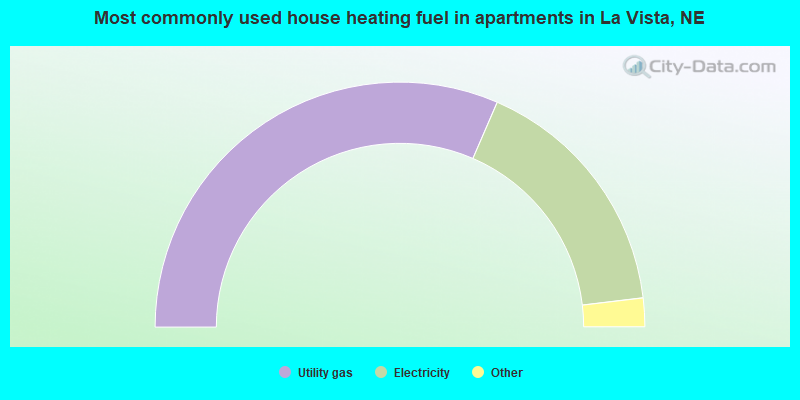
House heating fuel used in apartments - Utility gas (%)
House heating fuel used in apartments - Bottled, tank, or LP gas (%)
House heating fuel used in apartments - Electricity (%)
House heating fuel used in apartments - Fuel oil, kerosene, etc. (%)
House heating fuel used in apartments - Coal or coke (%)
House heating fuel used in apartments - Wood (%)
House heating fuel used in apartments - Solar energy (%)
House heating fuel used in apartments - Other fuel (%)
House heating fuel used in apartments - No fuel used (%)
Median year house/condo built: 1986Median year apartment built: 1993Household type by relationship:
Households: 17,174
Male householders: 3,339 (859 living alone ), Female householders: 4,042 (1,173 living alone )3,398 spouses (3,388 opposite-sex spouses ), 602 unmarried partners , (587 opposite-sex unmarried partners ), 4,647 children (4,190 natural , 68 adopted , 388 stepchildren ), 331 grandchildren , 72 brothers or sisters , 199 parents , 18 foster children , 177 other relatives , 326 non-relatives In group quarters: 16
Size of family households: 2,476 2-persons , 925 3-persons , 840 4-persons , 424 5-persons , 94 6-persons , 56 7-or-more-persons .
Size of nonfamily households: 2,083 1-person , 576 2-persons , 38 3-persons , 8 4-persons .
2,067 married couples with children. single-parent households (149 men , 1,058 women ).
90.1% of residents of La Vista speak English at home. of residents speak Spanish at home (58% speak English very well , 24% speak English well , 18% speak English not well ).of residents speak other Indo-European language at home (84% speak English very well , 14% speak English well , 2% speak English not well ).of residents speak Asian or Pacific Island language at home (44% speak English very well , 40% speak English well , 13% speak English not well , 3% don't speak English at all ).of residents speak other language at home (81% speak English very well , 19% speak English well ).
Foreign born population: 1,357 (7.9%)of them are naturalized citizens )
Median number of rooms in houses and condos:
Median number of rooms in apartments
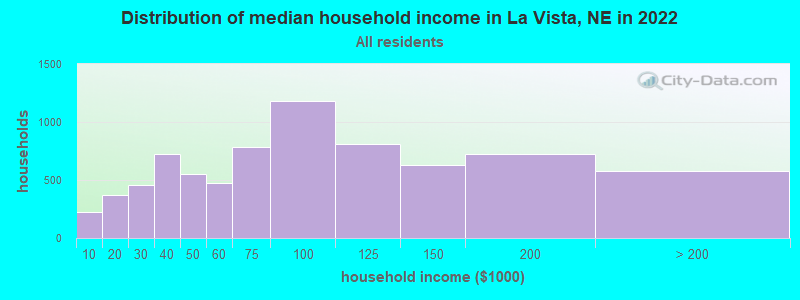
La Vista, NE household income distribution 225 Less than $10,000374 $10,000 to $19,999456 $20,000 to $29,999724 $30,000 to $39,999548 $40,000 to $49,999474 $50,000 to $59,999788 $60,000 to $74,9991,183 $75,000 to $99,999812 $100,000 to $124,999627 $125,000 to $149,999726 $150,000 to $199,999579 $200,000 or more
Home value of owner - occupied houses in 2022 in La Vista, NE 25 Less than $10,00032 $10,000 to $14,99911 $15,000 to $19,99921 $20,000 to $24,99916 $35,000 to $39,99924 $40,000 to $49,99942 $90,000 to $99,99982 $100,000 to $124,999189 $125,000 to $149,999323 $150,000 to $174,999236 $175,000 to $199,999782 $200,000 to $249,999509 $250,000 to $299,9991,102 $300,000 to $399,999291 $400,000 to $499,99914 $1,500,000 to $1,999,999Rent paid by renters in 2022 in La Vista, NE 9 $150 to $19940 $200 to $24911 $400 to $44919 $650 to $69972 $700 to $749120 $750 to $799446 $800 to $899644 $900 to $9991,381 $1,000 to $1,249430 $1,250 to $1,499161 $1,500 to $1,99916 $2,000 to $2,4997 $2,500 to $2,9999 $3,500 or more110 No cash rent
Percentage of workers working in this county: 43.4%Number of people working at home: 1,630 (15.7% of all workers )
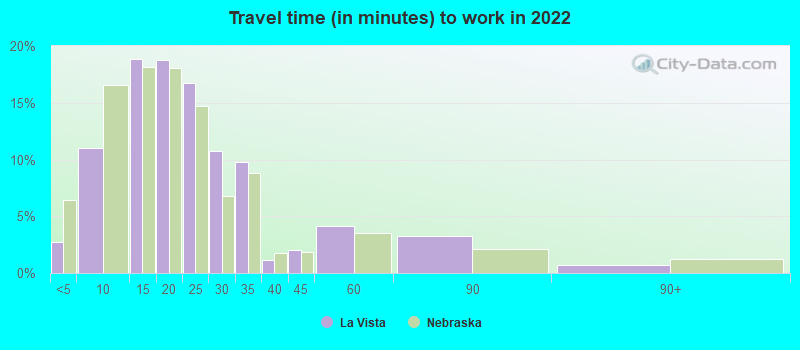
Travel time to work (commute)
Less than 5 minutes: 2465 to 9 minutes: 92210 to 14 minutes: 1,75015 to 19 minutes: 1,94720 to 24 minutes: 1,65125 to 29 minutes: 84430 to 34 minutes: 74935 to 39 minutes: 10940 to 44 minutes: 13345 to 59 minutes: 11260 to 89 minutes: 14990 or more minutes: 63
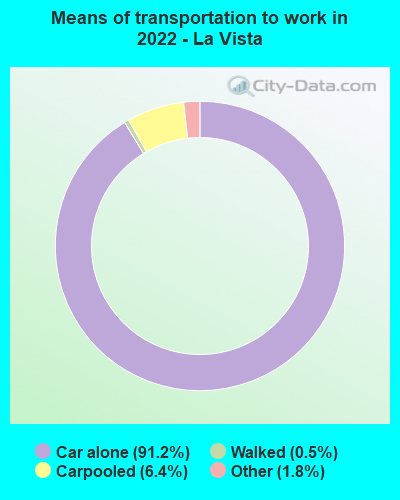
Means of transportation to work:
Drove a car alone: 9,897 (81.1%)Carpooled: 727 (6.0%)Taxi: 206 (1.7%)Walked: 54 (0.4%)Worked at home: 1,340 (11.0%)
Unemployment by race in 2022
Unemployment rate for White non-Hispanic residents 1.8% Males4.0% FemalesUnemployment rate for Black residents 3.3% MalesUnemployment rate for Asian residents 4.3% Males16.7% FemalesUnemployment rate for two or more race residents 11.8% Males
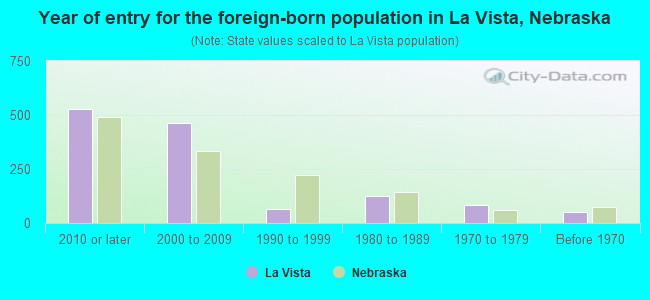
Year of entry for the foreign-born population in La Vista, Nebraska
528 2010 or later 465 2000 to 2009 66 1990 to 1999 124 1980 to 1989 82 1970 to 1979 53 Before 1970
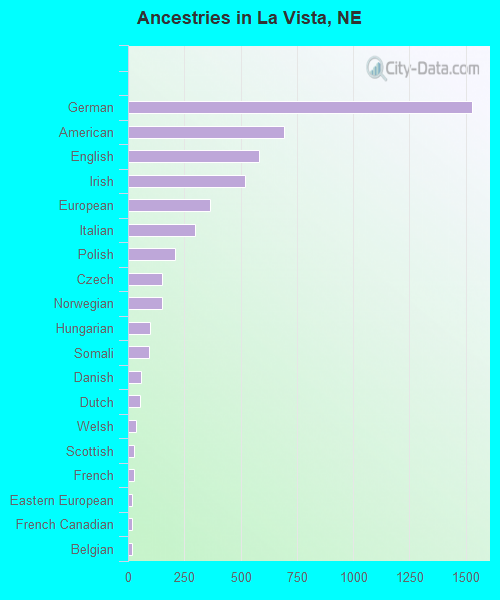
First ancestries reported:
German: 1,528 (21.1%)
American: 694 (9.6%)
English: 581 (8.0%)
Irish: 522 (7.2%)
European: 365 (5.0%)
Italian: 297 (4.1%)
Polish: 208 (2.9%)
Czech: 149 (2.1%)
Norwegian: 149 (2.1%)
Hungarian: 96 (1.3%)
Somali: 94 (1.3%)
Danish: 57 (0.8%)
Dutch: 54 (0.7%)
Welsh: 36 (0.5%)
Scottish: 28 (0.4%)
French: 27 (0.4%)
Eastern European: 17 (0.2%)
French Canadian: 17 (0.2%)
Belgian: 16 (0.2%)
Northern European: 11 (0.2%)
African: 11 (0.2%)
Slavic: 9 (0.1%)
Scandinavian: 7 (0.10%)
Bahamian: 7 (0.10%)
Scotch-Irish: 6 (0.08%)
Romanian: 5 (0.07%)
Slovak: 5 (0.07%)
Swiss: 4 (0.06%)
British: 1 (0.01%) Most common places of birth for foreign-born residents (%): Mexico La Vista:
26.5% (324)Nebraska:
31.7% (46,610)
Colombia La Vista:
22.7% (278)Nebraska:
1.1% (1,614)
Somalia La Vista:
9.5% (116)Nebraska:
1.4% (2,075)
Other Western Africa La Vista:
8.7% (106)Nebraska:
0.6% (895)
Nepal La Vista:
5.5% (67)Nebraska:
1.1% (1,612)
Togo La Vista:
4.4% (54)Nebraska:
1.1% (1,685)
Vietnam La Vista:
3.2% (39)Nebraska:
4.0% (5,832)
Philippines La Vista:
3.0% (37)Nebraska:
2.2% (3,185)
China, excluding Hong Kong and Taiwan La Vista:
2.4% (29)Nebraska:
2.6% (3,808)
El Salvador La Vista:
2.0% (24)Nebraska:
3.7% (5,421)
Japan La Vista:
1.8% (22)Nebraska:
0.8% (1,158)
Germany La Vista:
1.7% (21)Nebraska:
1.4% (2,029)
South Africa La Vista:
1.7% (21)Nebraska:
0.4% (636)
Ghana La Vista:
1.7% (21)Nebraska:
0.3% (381)
Place of birth for U.S.-born residents:
This state: 11,208Other state: 4,680Northeast: 122Midwest: 2,573South: 888West: 1,122 86.1% of La Vista residents lived in the same house 1 years ago.
Out of people who lived in different houses, 30.1% lived in this county.
Out of people who lived in different counties, 73.1% lived in Nebraska.
La Vista:
86.1%State average:
87.4%
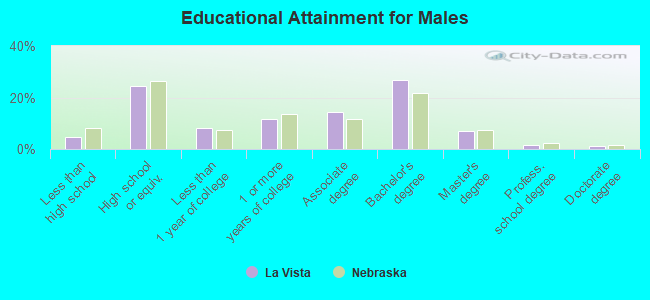
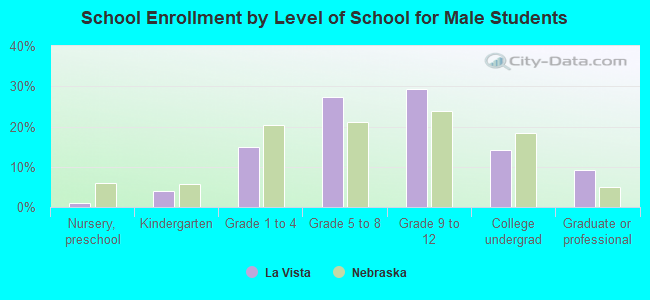
Education attainment for males 25 years and older:
No schooling: 57Nursery to 4th grade: 05th and 6th grade: 67th and 8th grade: 909th grade: 1610th grade: 1611th grade: 5812th grade, no diploma: 28High school graduate (or equivalency): 1,394Less than 1 year of college: 476Some college more than 1 year, no degree: 675Associate degree: 832Bachelor's degree: 1,520Master's degree: 393Professional school degree: 80Doctorate degree: 72
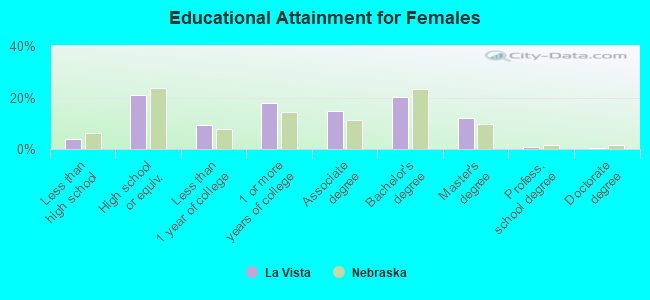
Education attainment for females 25 years and older:
No schooling: 28Nursery to 4th grade: 375th and 6th grade: 07th and 8th grade: 169th grade: 1810th grade: 011th grade: 6512th grade, no diploma: 78High school graduate (or equivalency): 1,288Less than 1 year of college: 580Some college more than 1 year, no degree: 1,113Associate degree: 907Bachelor's degree: 1,256Master's degree: 737Professional school degree: 47Doctorate degree: 17
Housing units in structures:
One, detached: 4,807One, attached: 82Two: 363 or 4: 135 to 9: 85410 to 19: 1,26520 to 49: 42150 or more: 315Housing units lacking complete plumbing facilities in 2022: 0.8%Housing units lacking complete kitchen facilities in 2022: 0.6%House/condo owner moved in on average 12 years ago
Renter moved in on average 3 years ago
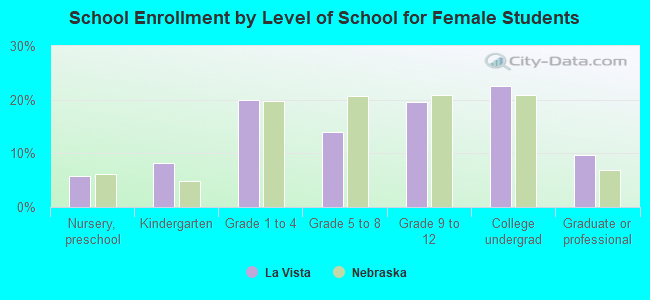
Private vs. public school enrollment:
Students in private schools in grades 1 to 8 (elementary and middle school): 302 Students in private schools in grades 9 to 12 (high school): 230 Students in private undergraduate colleges: 43