Races in La Vista, Nebraska (NE) Detailed Stats
Data:
Races - White alone (%)
Races - White alone (% change since 2000)
Races - Black alone (%)
Races - Black alone (% change since 2000)
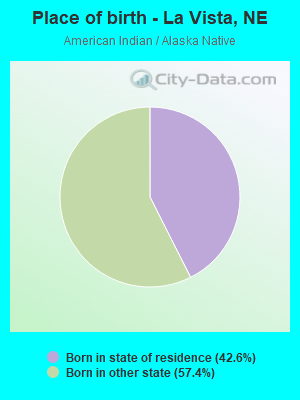
Races - American Indian alone (%)
Races - American Indian alone (% change since 2000)
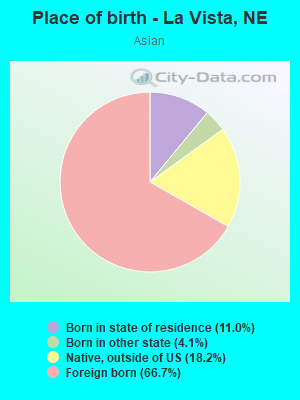
Races - Asian alone (%)
Races - Asian alone (% change since 2000)
Races - Hispanic (%)
Races - Hispanic (% change since 2000)
Races - Native Hawaiian and Other Pacific Islander alone (%)
Races - Native Hawaiian and Other Pacific Islander alone (% change since 2000)
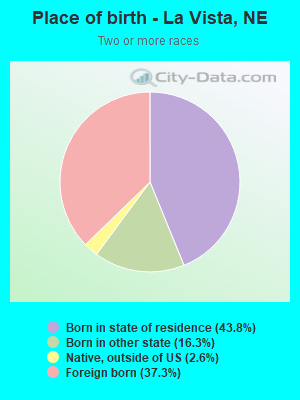
Races - Two or more races(%)
Races - Two or more races(% change since 2000)
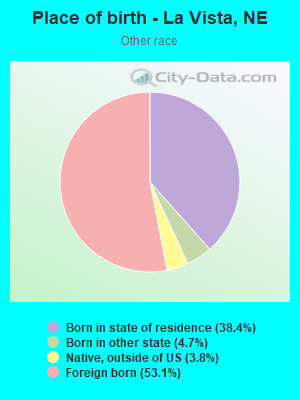
Races - Other race alone (%)
Races - Other race alone (% change since 2000)
Racial diversity
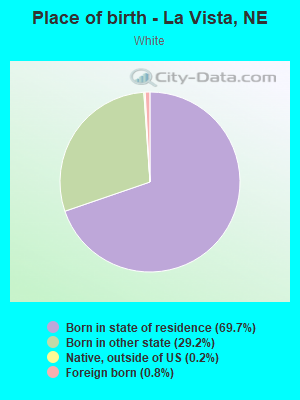
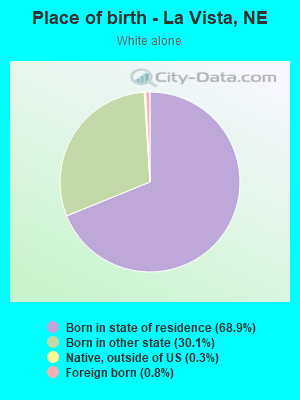
Place of birth - Born in state of residence (%)
Place of birth - Born in state of residence (%) - White
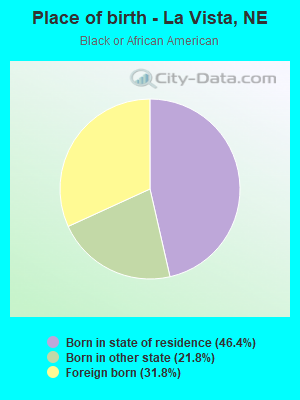
Place of birth - Born in state of residence (%) - Black or African American
Place of birth - Born in state of residence (%) - Asian
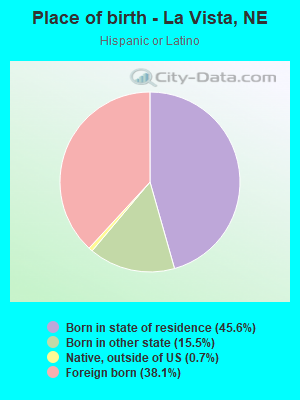
Place of birth - Born in state of residence (%) - Hispanic or Latino
Place of birth - Born in state of residence (%) - American Indian and Alaska Native
Place of birth - Born in state of residence (%) - Multirace
Place of birth - Born in state of residence (%) - Other Race
Place of birth - Born in other state (%)
Place of birth - Born in other state (%) - White
Place of birth - Born in other state (%) - Black or African American
Place of birth - Born in other state (%) - Asian
Place of birth - Born in other state (%) - Hispanic or Latino
Place of birth - Born in other state (%) - American Indian and Alaska Native
Place of birth - Born in other state (%) - Multirace
Place of birth - Born in other state (%) - Other Race
Place of birth - Native, outside of US (%)
Place of birth - Native, outside of US (%) - White
Place of birth - Native, outside of US (%) - Black or African American
Place of birth - Native, outside of US (%) - Asian
Place of birth - Native, outside of US (%) - Hispanic or Latino
Place of birth - Native, outside of US (%) - American Indian and Alaska Native
Place of birth - Native, outside of US (%) - Multirace
Place of birth - Native, outside of US (%) - Other Race
Place of birth - Foreign born (%)
Place of birth - Foreign born (%) - White
Place of birth - Foreign born (%) - Black or African American
Place of birth - Foreign born (%) - Asian
Place of birth - Foreign born (%) - Hispanic or Latino
Place of birth - Foreign born (%) - American Indian and Alaska Native
Place of birth - Foreign born (%) - Multirace
Place of birth - Foreign born (%) - Other Race
Residents speaking English at home (%)
Residents speaking English at home - Born in the United States (%)
Residents speaking English at home - Native, born elsewhere (%)
Residents speaking English at home - Foreign born (%)
Residents speaking Spanish at home (%)
Residents speaking Spanish at home - Born in the United States (%)
Residents speaking Spanish at home - Native, born elsewhere (%)
Residents speaking Spanish at home - Foreign born (%)
Residents speaking other language at home (%)
Residents speaking other language at home - Born in the United States (%)
Residents speaking other language at home - Native, born elsewhere (%)
Residents speaking other language at home - Foreign born (%)
Marital status - Never married (%)
Marital status - Now married (%)
Marital status - Separated (%)
Marital status - Widowed (%)
Marital status - Divorced (%)
Ancestries Reported - Arab (%)
Ancestries Reported - Czech (%)
Ancestries Reported - Danish (%)
Ancestries Reported - Dutch (%)
Ancestries Reported - English (%)
Ancestries Reported - French (%)
Ancestries Reported - French Canadian (%)
Ancestries Reported - German (%)
Ancestries Reported - Greek (%)
Ancestries Reported - Hungarian (%)
Ancestries Reported - Irish (%)
Ancestries Reported - Italian (%)
Ancestries Reported - Lithuanian (%)
Ancestries Reported - Norwegian (%)
Ancestries Reported - Polish (%)
Ancestries Reported - Portuguese (%)
Ancestries Reported - Russian (%)
Ancestries Reported - Scotch-Irish (%)
Ancestries Reported - Scottish (%)
Ancestries Reported - Slovak (%)
Ancestries Reported - Subsaharan African (%)
Ancestries Reported - Swedish (%)
Ancestries Reported - Swiss (%)
Ancestries Reported - Ukrainian (%)
Ancestries Reported - United States (%)
Ancestries Reported - Welsh (%)
Ancestries Reported - West Indian (%)
Ancestries Reported - Other (%)
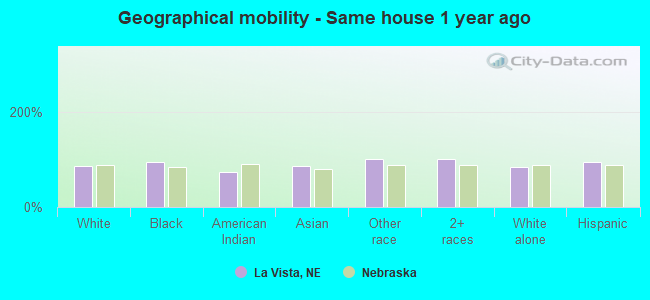
Geographical mobility - Same house 1 year ago (%)
Geographical mobility - Same house 1 year ago (%) - White
Geographical mobility - Same house 1 year ago (%) - Black or African American
Geographical mobility - Same house 1 year ago (%) - Asian
Geographical mobility - Same house 1 year ago (%) - Hispanic or Latino
Geographical mobility - Same house 1 year ago (%) - American Indian and Alaska Native
Geographical mobility - Same house 1 year ago (%) - Multirace
Geographical mobility - Same house 1 year ago (%) - Other Race
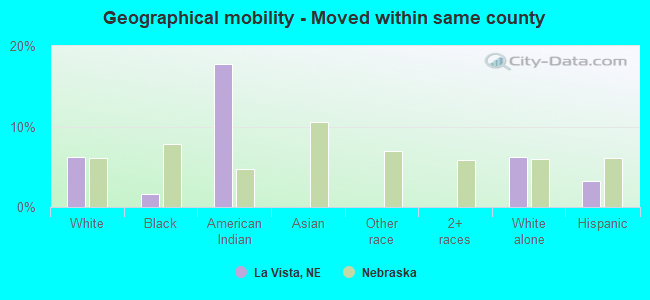
Geographical mobility - Moved within same county (%)
Geographical mobility - Moved within same county (%) - White
Geographical mobility - Moved within same county (%) - Black or African American
Geographical mobility - Moved within same county (%) - Asian
Geographical mobility - Moved within same county (%) - Hispanic or Latino
Geographical mobility - Moved within same county (%) - American Indian and Alaska Native
Geographical mobility - Moved within same county (%) - Multirace
Geographical mobility - Moved within same county (%) - Other Race
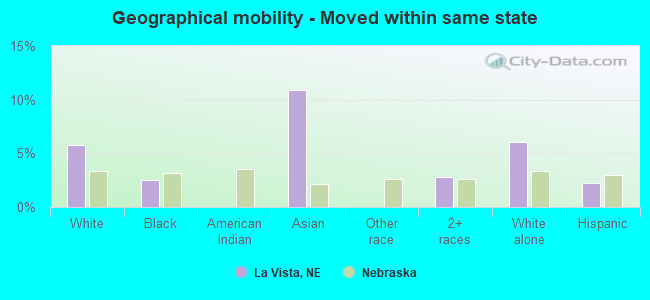
Geographical mobility - Moved from different county within same state (%)
Geographical mobility - Moved from different county within same state (%) - White
Geographical mobility - Moved from different county within same state (%) - Black or African American
Geographical mobility - Moved from different county within same state (%) - Asian
Geographical mobility - Moved from different county within same state (%) - Hispanic or Latino
Geographical mobility - Moved from different county within same state (%) - American Indian and Alaska Native
Geographical mobility - Moved from different county within same state (%) - Multirace
Geographical mobility - Moved from different county within same state (%) - Other Race
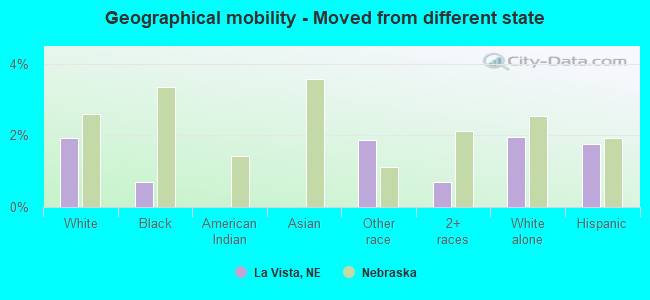
Geographical mobility - Moved from different state (%)
Geographical mobility - Moved from different state (%) - White
Geographical mobility - Moved from different state (%) - Black or African American
Geographical mobility - Moved from different state (%) - Asian
Geographical mobility - Moved from different state (%) - Hispanic or Latino
Geographical mobility - Moved from different state (%) - American Indian and Alaska Native
Geographical mobility - Moved from different state (%) - Multirace
Geographical mobility - Moved from different state (%) - Other Race
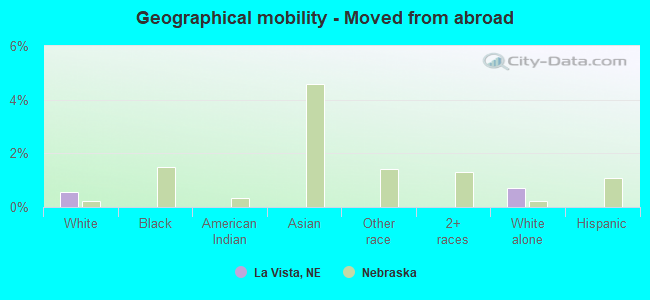
Geographical mobility - Moved from abroad (%)
Geographical mobility - Moved from abroad (%) - White
Geographical mobility - Moved from abroad (%) - Black or African American
Geographical mobility - Moved from abroad (%) - Asian
Geographical mobility - Moved from abroad (%) - Hispanic or Latino
Geographical mobility - Moved from abroad (%) - American Indian and Alaska Native
Geographical mobility - Moved from abroad (%) - Multirace
Geographical mobility - Moved from abroad (%) - Other Race
Place of birth for the foreign-born population - Ireland (%)
Place of birth for the foreign-born population - Denmark (%)
Place of birth for the foreign-born population - Norway (%)
Place of birth for the foreign-born population - Sweden (%)
Place of birth for the foreign-born population - United Kingdom (%)
Place of birth for the foreign-born population - England (%)
Place of birth for the foreign-born population - Scotland (%)
Place of birth for the foreign-born population - Other Northern Europe (%)
Place of birth for the foreign-born population - Austria (%)
Place of birth for the foreign-born population - Belgium (%)
Place of birth for the foreign-born population - France (%)
Place of birth for the foreign-born population - Germany (%)
Place of birth for the foreign-born population - Netherlands (%)
Place of birth for the foreign-born population - Switzerland (%)
Place of birth for the foreign-born population - Other Western Europe (%)
Place of birth for the foreign-born population - Greece (%)
Place of birth for the foreign-born population - Italy (%)
Place of birth for the foreign-born population - Portugal (%)
Place of birth for the foreign-born population - Spain (%)
Place of birth for the foreign-born population - Other Southern Europe (%)
Place of birth for the foreign-born population - Albania (%)
Place of birth for the foreign-born population - Belarus (%)
Place of birth for the foreign-born population - Bosnia and Herzegovina (%)
Place of birth for the foreign-born population - Bulgaria (%)
Place of birth for the foreign-born population - Croatia (%)
Place of birth for the foreign-born population - Czechoslovakia (%)
Place of birth for the foreign-born population - Hungary (%)
Place of birth for the foreign-born population - Latvia (%)
Place of birth for the foreign-born population - Lithuania (%)
Place of birth for the foreign-born population - North Macedonia (Macedonia) (%)
Place of birth for the foreign-born population - Moldova (%)
Place of birth for the foreign-born population - Poland (%)
Place of birth for the foreign-born population - Romania (%)
Place of birth for the foreign-born population - Russia (%)
Place of birth for the foreign-born population - Serbia (%)
Place of birth for the foreign-born population - Ukraine (%)
Place of birth for the foreign-born population - Other Eastern Europe (%)
Place of birth for the foreign-born population - China (%)
Place of birth for the foreign-born population - Hong Kong (%)
Place of birth for the foreign-born population - Taiwan (%)
Place of birth for the foreign-born population - Japan (%)
Place of birth for the foreign-born population - Korea (%)
Place of birth for the foreign-born population - Other Eastern Asia (%)
Place of birth for the foreign-born population - Afghanistan (%)
Place of birth for the foreign-born population - Bangladesh (%)
Place of birth for the foreign-born population - India (%)
Place of birth for the foreign-born population - Iran (%)
Place of birth for the foreign-born population - Kazakhstan (%)
Place of birth for the foreign-born population - Nepal (%)
Place of birth for the foreign-born population - Pakistan (%)
Place of birth for the foreign-born population - Sri Lanka (%)
Place of birth for the foreign-born population - Uzbekistan (%)
Place of birth for the foreign-born population - Other South Central Asia (%)
Place of birth for the foreign-born population - Burma (%)
Place of birth for the foreign-born population - Cambodia (%)
Place of birth for the foreign-born population - Indonesia (%)
Place of birth for the foreign-born population - Laos (%)
Place of birth for the foreign-born population - Malaysia (%)
Place of birth for the foreign-born population - Philippines (%)
Place of birth for the foreign-born population - Singapore (%)
Place of birth for the foreign-born population - Thailand (%)
Place of birth for the foreign-born population - Vietnam (%)
Place of birth for the foreign-born population - Other South Eastern Asia (%)
Place of birth for the foreign-born population - Armenia (%)
Place of birth for the foreign-born population - Iraq (%)
Place of birth for the foreign-born population - Israel (%)
Place of birth for the foreign-born population - Jordan (%)
Place of birth for the foreign-born population - Kuwait (%)
Place of birth for the foreign-born population - Lebanon (%)
Place of birth for the foreign-born population - Saudi Arabia (%)
Place of birth for the foreign-born population - Syria (%)
Place of birth for the foreign-born population - Turkey (%)
Place of birth for the foreign-born population - Yemen (%)
Place of birth for the foreign-born population - Other Western Asia (%)
Place of birth for the foreign-born population - Eritrea (%)
Place of birth for the foreign-born population - Ethiopia (%)
Place of birth for the foreign-born population - Kenya (%)
Place of birth for the foreign-born population - Somalia (%)
Place of birth for the foreign-born population - Uganda (%)
Place of birth for the foreign-born population - Zimbabwe (%)
Place of birth for the foreign-born population - Other Eastern Africa (%)
Place of birth for the foreign-born population - Cameroon (%)
Place of birth for the foreign-born population - Congo (%)
Place of birth for the foreign-born population - Democratic Republic of Congo (Zaire) (%)
Place of birth for the foreign-born population - Other Middle Africa (%)
Place of birth for the foreign-born population - Egypt (%)
Place of birth for the foreign-born population - Morocco (%)
Place of birth for the foreign-born population - Sudan (%)
Place of birth for the foreign-born population - Other Northern Africa (%)
Place of birth for the foreign-born population - South Africa (%)
Place of birth for the foreign-born population - Other Southern Africa (%)
Place of birth for the foreign-born population - Cabo Verde (%)
Place of birth for the foreign-born population - Ghana (%)
Place of birth for the foreign-born population - Liberia (%)
Place of birth for the foreign-born population - Nigeria (%)
Place of birth for the foreign-born population - Senegal (%)
Place of birth for the foreign-born population - Sierra Leone (%)
Place of birth for the foreign-born population - Other Western Africa (%)
Place of birth for the foreign-born population - Australia (%)
Place of birth for the foreign-born population - New Zealand (%)
Place of birth for the foreign-born population - Fiji (%)
Place of birth for the foreign-born population - Micronesia (%)
Place of birth for the foreign-born population - Bahamas (%)
Place of birth for the foreign-born population - Barbados (%)
Place of birth for the foreign-born population - Cuba (%)
Place of birth for the foreign-born population - Dominica (%)
Place of birth for the foreign-born population - Dominican Republic (%)
Place of birth for the foreign-born population - Grenada (%)
Place of birth for the foreign-born population - Haiti (%)
Place of birth for the foreign-born population - Jamaica (%)
Place of birth for the foreign-born population - St. Vincent and the Grenadines (%)
Place of birth for the foreign-born population - Trinidad and Tobago (%)
Place of birth for the foreign-born population - West Indies (%)
Place of birth for the foreign-born population - Other Caribbean (%)
Place of birth for the foreign-born population - Belize (%)
Place of birth for the foreign-born population - Costa Rica (%)
Place of birth for the foreign-born population - El Salvador (%)
Place of birth for the foreign-born population - Guatemala (%)
Place of birth for the foreign-born population - Honduras (%)
Place of birth for the foreign-born population - Mexico (%)
Place of birth for the foreign-born population - Nicaragua (%)
Place of birth for the foreign-born population - Panama (%)
Place of birth for the foreign-born population - Other Central America (%)
Place of birth for the foreign-born population - Argentina (%)
Place of birth for the foreign-born population - Bolivia (%)
Place of birth for the foreign-born population - Brazil (%)
Place of birth for the foreign-born population - Chile (%)
Place of birth for the foreign-born population - Colombia (%)
Place of birth for the foreign-born population - Ecuador (%)
Place of birth for the foreign-born population - Guyana (%)
Place of birth for the foreign-born population - Peru (%)
Place of birth for the foreign-born population - Uruguay (%)
Place of birth for the foreign-born population - Venezuela (%)
Place of birth for the foreign-born population - Other South America (%)
Place of birth for the foreign-born population - Canada (%)
Place of birth for the foreign-born population - Other Northern America (%)
Place of birth for the foreign-born population - Other (%)
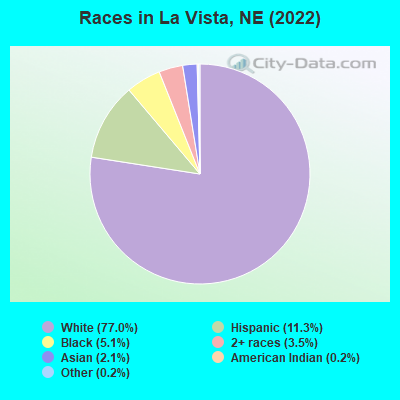
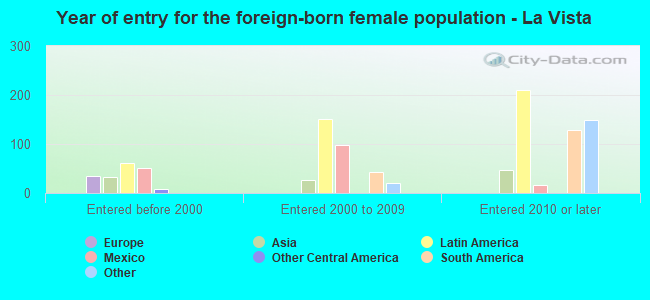
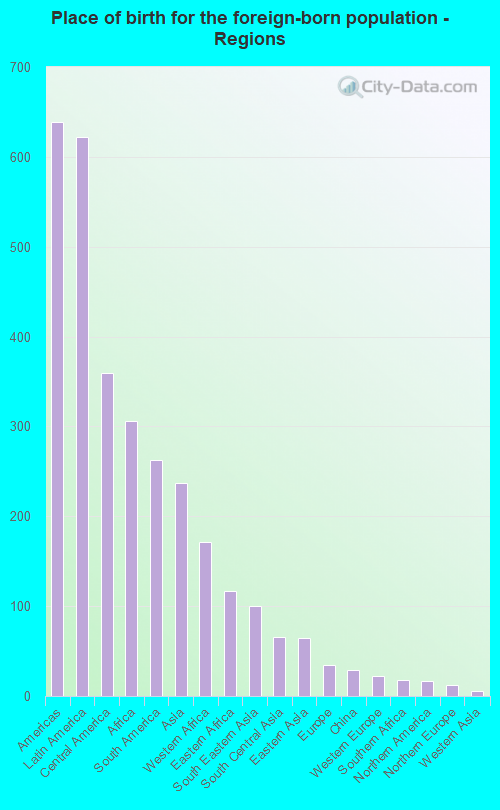
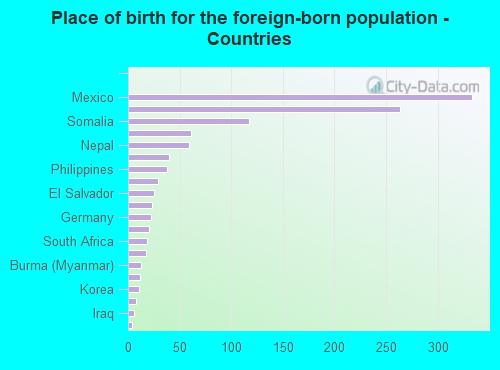
According to 2022 data, the most numerous races in La Vista, NE are White alone (13,219 residents), Hispanic (1,948 residents), and Black alone (881 residents). 89.9% of La Vista residents speak English at home. 7.1% of La Vista, NE residents are foreign-born (3.6% born in Latin America, 1.8% born in Africa, 1.4% born in Asia), which is about the same as the foreign-born rate of 7.0% across the entire state of Nebraska.
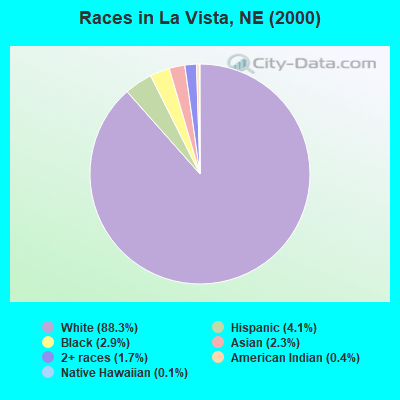
Race distribution in La Vista
2000 2022
1,494,494 87.3% White alone 94,425 5.5% Hispanic 67,537 3.9% Black alone 21,677 1.3% Asian alone 17,696 1.0% Two or more races 13,460 0.8% American Indian alone 1,327 0.08% Other race alone 647 0.04% Native Hawaiian and Other
1,492,005 75.8% White alone 241,898 12.3% Hispanic 89,520 4.5% Black alone 76,499 3.9% Two or more races 49,261 2.5% Asian alone 10,249 0.5% American Indian alone 7,425 0.4% Other race alone 1,066 0.05% Native Hawaiian and Other
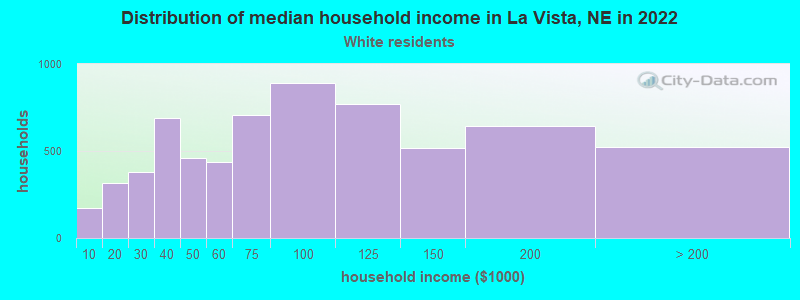
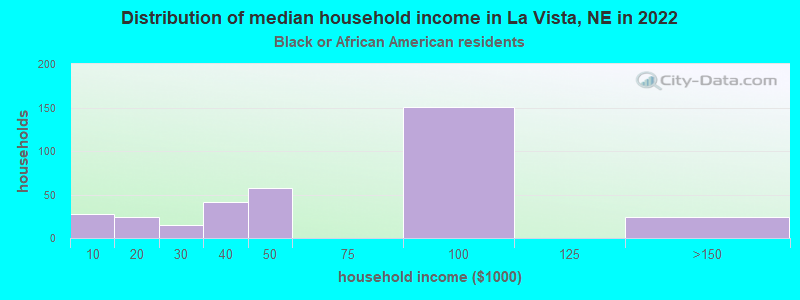
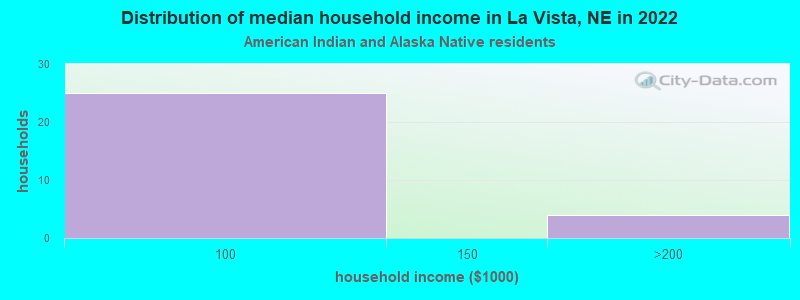
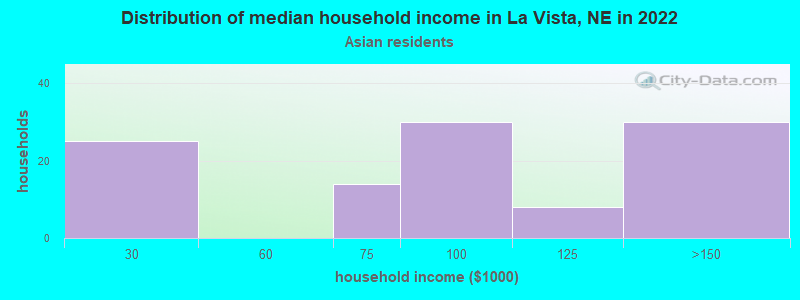
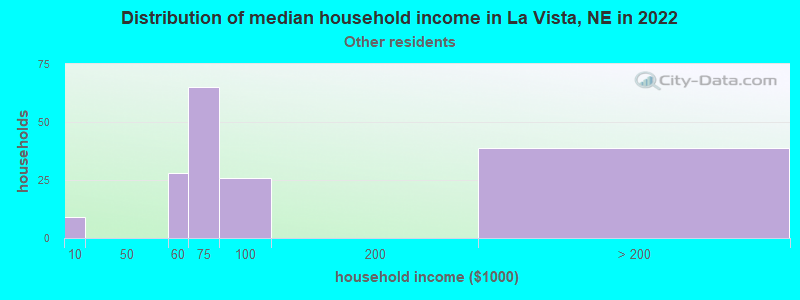
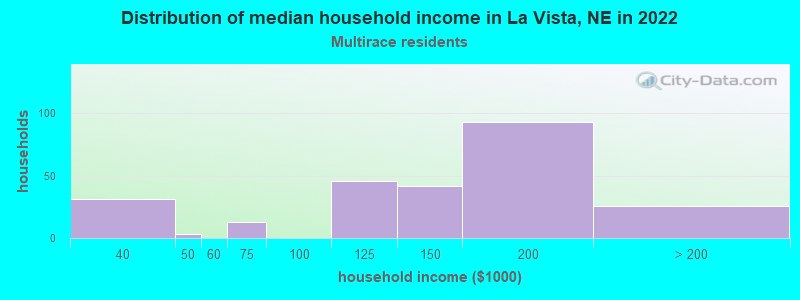
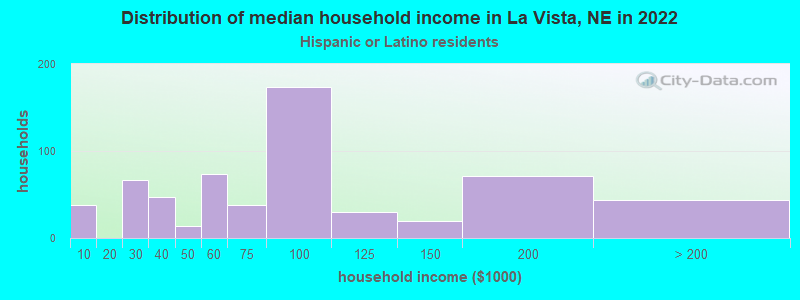
Income and house value in La Vista Median household income in 2022 $81,221 White non-Hispanic householders$64,139 Black householders$95,909 Asian householders$62,008 Some other race householders$164,559 Two or more races householders$87,954 Hispanic or Latino race householdersMedian 2022 house value $250,799 White Non-Hispanic householders$217,792 Black or African American householders $267,303 Asian householders$247,012 Some other race householders$304,368 Two or more races householders$257,022 Hispanic or Latino householders
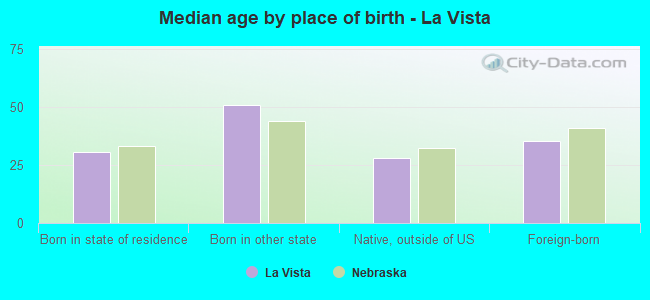
Median age by race in La Vista
39.6 Median age for White residents36.4 41.7 39.5 Median age for Black or African American residents43.8 37.4 62.8 Median age for American Indian / Alaska Native residents-1,037,707,389.6 75.3 31.5 Median age for Asian residents31.6 35.6 -699,999,999.3 Median age for Native Hawaiian / Pacific Islander residents-672,108,842.9 -689,223,057.0 32.6 Median age for Other race residents28.2 34.4 17.8 Median age for Two or more races residents27.8 15.2 41.3 Median age for White alone residents38.3 43.3 27.7 Median age for Hispanic or Latino residents28.3 19.6
Owner/renter occupied households by race in La Vista
House owners and renters - White residents 3,684 55.8% Owner occupied2,917 44.2% Renter occupiedHouse owners and renters - Black or African American residents 44 14.5% Owner occupied259 85.5% Renter occupiedHouse owners and renters - American Indian / Alaska Native residents 41 100.0% Owner occupiedHouse owners and renters - Asian residents 130 91.2% Owner occupied13 8.8% Renter occupiedHouse owners and renters - Other race residents 69 44.7% Owner occupied85 55.3% Renter occupiedHouse owners and renters - Two or more races residents 217 86.3% Owner occupied35 13.7% Renter occupiedHouse owners and renters - White alone residents 3,601 55.9% Owner occupied2,836 44.1% Renter occupiedHouse owners and renters - Hispanic or Latino residents 306 53.7% Owner occupied264 46.3% Renter occupied
Language usage in La Vista
English speakers - Total 89.9% of residents of La Vista speak English at home.
5.9% of residents speak Spanish at home 523 54.4% Speak English very well438 45.6% Speak English less than very well4.2% of residents speak other language at home 506 73.4% Speak English very well183 26.6% Speak English less than very well
English speakers - Born in the United States 96.3% of residents of La Vista speak English at home.
2.9% of residents speak Spanish at home 72 52.9% Speak English very well64 47.1% Speak English less than very well0.2% of residents speak other language at home 10 100.0% Speak English very well
English speakers - Native, born elsewhere 36.1% of residents of La Vista speak English at home.
12.6% of residents speak Spanish at home 11 73.3% Speak English very well4 26.7% Speak English less than very well77.3% of residents speak other language at home 92 100.0% Speak English very well
English speakers - Foreign-born 6.5% of residents of La Vista speak English at home.
55.5% of residents speak Spanish at home 376 50.5% Speak English very well369 49.5% Speak English less than very well38.9% of residents speak other language at home 351 67.1% Speak English very well172 32.9% Speak English less than very well
White (Caucasian) - Speak only English Native:
98.8% (13,082)Foreign-born:
56.5% (68)
White (Caucasian) - Speak another language Native:
1.3% (168)Foreign-born:
47.2% (56)
Black or African American - Speak only English Native:
89.7% (451)Foreign-born:
3.2% (8)
Black or African American - Speak another language Native:
11.2% (56)Foreign-born:
91.9% (237)
Asian - Speak only English Native:
33.2% (45)Foreign-born:
2.9% (6)
Asian - Speak another language Native:
57.9% (79)Foreign-born:
100.0% (202)
Other race - Speak only English Native:
44.8% (57)Foreign-born:
3.2% (9)
Other race - Speak another language Native:
42.3% (54)Foreign-born:
100.0% (277)
Two or more races - Speak another language Native:
7.2% (53)Foreign-born:
100.0% (483)
White alone - Speak only English Native:
99.7% (12,570)Foreign-born:
64.5% (65)
White alone - Speak another language Native:
0.4% (56)Foreign-born:
35.5% (36)
Hispanic or Latino - Speak only English Native:
79.0% (806)Foreign-born:
1.1% (9)
Hispanic or Latino - Speak another language Native:
21.8% (223)Foreign-born:
99.3% (755)
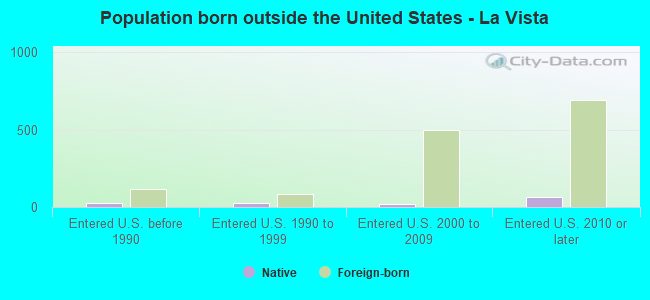
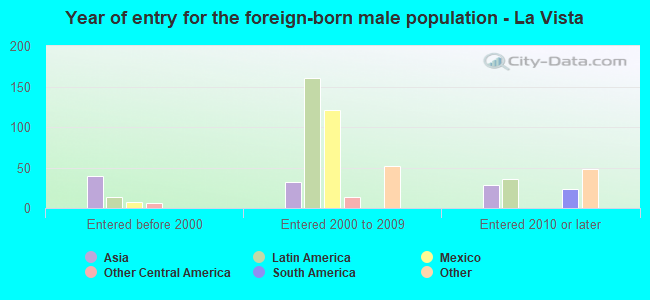
Foreign-born residents in La Vista 1,222 residents are foreign born (3.6% Latin America , 1.8% Africa , 1.4% Asia ).
This city:
7.1%Nebraska:
7.5%
Marital status for residents in La Vista Marital status - White (Caucasian) population 15 years and over
Males 38.5% Never married51.3% Now married0.6% Separated2.4% Widowed7.2% DivorcedFemales 31.2% Never married49.3% Now married1.2% Separated5.7% Widowed12.6% DivorcedWomen who gave birth in the past 12 months Now married:
26.9% (44)Unmarried:
73.1% (121)
Women who did not give birth in the past 12 months Now married:
41.7% (1,388)Unmarried:
58.3% (1,944)
Marital status - Black or African American population 15 years and over
Males 33.5% Never married66.5% Now married0.0% Separated0.0% Widowed0.0% DivorcedFemales 33.4% Never married33.7% Now married0.0% Separated19.2% Widowed13.7% DivorcedWomen who gave birth in the past 12 months Now married:
0.0% (0)Unmarried:
100.0% (36)
Women who did not give birth in the past 12 months Now married:
37.0% (85)Unmarried:
63.0% (144)
Marital status - Asian population 15 years and over
Males 43.3% Never married44.7% Now married0.0% Separated7.8% Widowed4.3% DivorcedFemales 15.9% Never married74.5% Now married0.0% Separated0.0% Widowed9.7% DivorcedWomen who did not give birth in the past 12 months Now married:
91.8% (93)Unmarried:
8.2% (8)
Marital status - Other race population 15 years and over
Males 22.6% Never married77.4% Now married0.0% Separated0.0% Widowed0.0% DivorcedFemales 27.0% Never married44.7% Now married17.1% Separated0.0% Widowed11.2% DivorcedWomen who did not give birth in the past 12 months Now married:
66.7% (113)Unmarried:
33.3% (57)
Marital status - Two or more races population 15 years and over
Males 39.2% Never married49.6% Now married3.9% Separated0.0% Widowed7.3% DivorcedFemales 56.2% Never married41.9% Now married0.0% Separated0.0% Widowed1.9% DivorcedWomen who gave birth in the past 12 months Now married:
12.1% (10)Unmarried:
87.9% (72)
Women who did not give birth in the past 12 months Now married:
32.9% (68)Unmarried:
67.1% (138)
Marital status - White alone, not Hispanic / Latino population 15 years and over
Males 37.1% Never married52.9% Now married0.6% Separated1.8% Widowed7.6% DivorcedFemales 31.2% Never married49.0% Now married1.3% Separated6.0% Widowed12.6% DivorcedWomen who gave birth in the past 12 months Now married:
30.7% (46)Unmarried:
69.3% (103)
Women who did not give birth in the past 12 months Now married:
40.6% (1,317)Unmarried:
59.4% (1,928)
Marital status - Hispanic or Latino population 15 years and over
Males 45.3% Never married48.3% Now married0.0% Separated6.4% Widowed0.0% DivorcedFemales 39.8% Never married47.8% Now married5.0% Separated0.0% Widowed7.4% DivorcedWomen who gave birth in the past 12 months Now married:
0.0% (0)Unmarried:
100.0% (81)
Women who did not give birth in the past 12 months Now married:
58.1% (231)Unmarried:
41.9% (167)
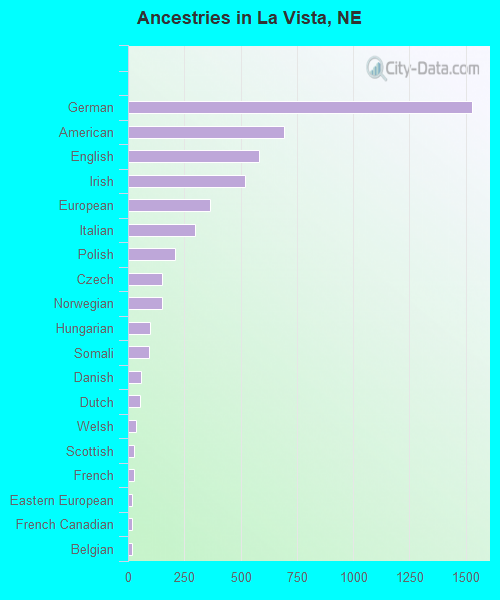
Ancestries in La Vista
1,528 21.1% German694 9.6% American581 8.0% English522 7.2% Irish365 5.0% European297 4.1% Italian208 2.9% Polish149 2.1% Czech149 2.1% Norwegian96 1.3% Hungarian94 1.3% Somali57 0.8% Danish54 0.7% Dutch36 0.5% Welsh28 0.4% Scottish27 0.4% French17 0.2% Eastern European17 0.2% French Canadian16 0.2% Belgian11 0.2% Northern European11 0.2% African9 0.1% Slavic7 0.10% Scandinavian7 0.10% Bahamian6 0.08% Scotch-Irish5 0.07% Romanian5 0.07% Slovak4 0.06% Swiss1 0.01% British
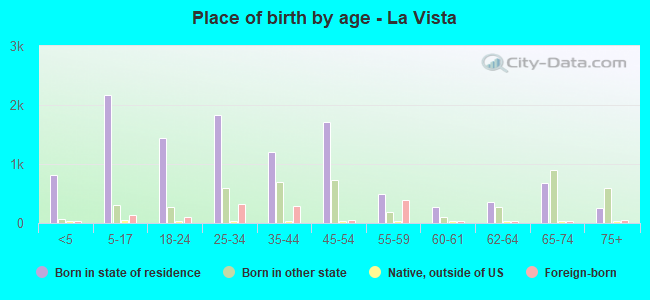
Children Nativity (place of birth) in La Vista
Children under 6 years - Living with two parents Both parents native 449 93.9% Native29 6.1% Foreign-bornBoth parents foreign-born 135 97.9% Native3 2.1% Foreign-bornOne native, one foreign-born parent 14 46.7% Native16 53.3% Foreign-bornChildren under 6 years - Living with one parent Native parent 318 100.0% NativeForeign-born parent 37 17.9% Native170 82.1% Foreign-bornChildren 6 to 17 years - Living with two parents Both parents native 1,416 100.0% NativeBoth parents foreign-born 7 59.5% Native5 40.5% Foreign-bornOne native, one foreign-born parent 68 100.0% NativeChildren 6 to 17 years - Living with one parent Native parent 759 100.0% NativeForeign-born parent 95 63.6% Native54 36.4% Foreign-born
Grandparents responsible for own grandchildren in La Vista
Grandparents (30 to 59 years) White / Caucasian 27 100.0% Not responsible for grandchildrenBlack or African American 74 100.0% Responsible for grandchildrenWhite alone, not Hispanic / Latino 16 100.0% Not responsible for grandchildrenGrandparents (60 years and over) White / Caucasian 84 84.4% Responsible for grandchildren15 15.6% Not responsible for grandchildrenBlack or African American 43 100.0% Not responsible for grandchildrenWhite alone, not Hispanic / Latino 84 83.9% Responsible for grandchildren16 16.1% Not responsible for grandchildren