La Marque, TX (Texas) Houses and Residents
| La Marque: | $197,698 |
| Texas: | $275,400 |
Total population: 15,521 (Urban population: 13,269, Rural population: 602 (all nonfarm))
Houses: 8,148 (7,281 occupied: 5,570 owner occupied, 1,912 renter occupied)
| % of renters here: | 26% |
| State: | 38% |
Housing density: 573 houses/condos per square mile
Median price asked for vacant for-sale houses and condos in 2022: $216,047.
Median contract rent in 2022: $899 (lower quartile is $780, upper quartile is $1,152)
Median rent asked for vacant for-rent units in 2022: $1,264
Median gross rent in La Marque, TX in 2022: $1,141
Housing units in La Marque with a mortgage: 3,320 (105 second mortgage, 0 home equity loan, 56 both second mortgage and home equity loan)
Houses without a mortgage: 9
Median household income for houses/condos with a mortgage: $75,617
Median household income for apartments without a mortgage: $44,673
Median monthly housing costs: $1,092
Compare current foreclosures in La Marque, TX:
| Photo | Address | Area | Beds / Baths | Price | Details |
|---|---|---|---|---|---|

|
#1
Raspberry Sunset Circle
La Marque, TX 77568
|
2,984 sq. feet
|
2 baths 4 beds |
show details | |

|
#2
Laurel Meadow Ct
La Marque, TX 77568
|
1,769 sq. feet
|
2 baths - beds |
show details | |

|
#3
Mcarthur Dr
La Marque, TX 77568
|
1,260 sq. feet
|
1 baths - beds |
show details | |

|
#4
Highway 3
La Marque, TX 77568
|
941 sq. feet
|
1 baths - beds |
show details | |

|
#5
Laurelmist Ln
La Marque, TX 77568
|
2,682 sq. feet
|
2 baths - beds |
show details | |

|
#6
Laurelmist Ln
La Marque, TX 77568
|
2,641 sq. feet
|
3 baths - beds |
show details | |

|
#7
Yupon St
La Marque, TX 77568
|
1,626 sq. feet
|
3 baths - beds |
show details | |

|
#8
Shady Ln
La Marque, TX 77568
|
1,384 sq. feet
|
2 baths - beds |
show details | |

|
#9
Stonewall St
La Marque, TX 77568
|
1,020 sq. feet
|
1 baths - beds |
show details | |

|
#10
S Curlew St
La Marque, TX 77568
|
1,128 sq. feet
|
2 baths - beds |
show details |
| Photo | Address | Area | Beds / Baths | Price | Details |
|---|---|---|---|---|---|

|
#11
Naples Terrace Ln
La Marque, TX 77568
|
2,431 sq. feet
|
2 baths - beds |
show details | |

|
#12
Carriage Ln
La Marque, TX 77568
|
2,435 sq. feet
|
2 baths - beds |
show details | |

|
#13
Shellbark Way
La Marque, TX 77568
|
- sq. feet
|
- baths - beds |
show details | |

|
#14
Cumberland Dr
La Marque, TX 77568
|
- sq. feet
|
- baths - beds |
show details | |

|
#15
Seacrest Ln
La Marque, TX 77568
|
- sq. feet
|
- baths - beds |
show details | |

|
#16
Dancing Reed Dr
La Marque, TX 77568
|
- sq. feet
|
- baths - beds |
show details | |

|
#17
Cobalt Cv Ct
La Marque, TX 77568
|
- sq. feet
|
- baths - beds |
show details | |

|
#18
Emerald Mallard Dr
La Marque, TX 77568
|
- sq. feet
|
- baths - beds |
show details | |

|
#19
Boulder Park Cir
La Marque, TX 77568
|
- sq. feet
|
- baths - beds |
show details | |

|
#20
Jetty Ridge Dr
La Marque, TX 77568
|
- sq. feet
|
- baths - beds |
show details |
| Photo | Address | Area | Beds / Baths | Price | Details |
|---|---|---|---|---|---|

|
#21
Apache Field Ln
La Marque, TX 77568
|
- sq. feet
|
- baths - beds |
show details | |

|
#22
Oleander Bay Ln
La Marque, TX 77568
|
- sq. feet
|
- baths - beds |
show details | |

|
#23
Newman Rd Apt 4307
La Marque, TX 77568
|
- sq. feet
|
- baths - beds |
show details | |

|
#24
Silver Egret Ln
La Marque, TX 77568
|
- sq. feet
|
- baths - beds |
show details | |

|
#25
Rain Lily Dr
La Marque, TX 77568
|
- sq. feet
|
- baths - beds |
show details | |

|
#26
Beacon Cove Dr
La Marque, TX 77568
|
- sq. feet
|
- baths - beds |
show details | |

|
#27
Sand Ridge Dr
La Marque, TX 77568
|
- sq. feet
|
- baths - beds |
show details | |

|
#28
Gulf Fwy, Apt 11206
La Marque, TX 77568
|
- sq. feet
|
- baths - beds |
show details | |

|
#29
Gulf Fwy, Apt 11107
La Marque, TX 77568
|
- sq. feet
|
- baths - beds |
show details | |

|
#30
Hazy Shores Ln
La Marque, TX 77568
|
- sq. feet
|
- baths - beds |
show details |
| Photo | Address | Area | Beds / Baths | Price | Details |
|---|---|---|---|---|---|

|
#31
Interstate 45 # 141
La Marque, TX 77568
|
- sq. feet
|
- baths - beds |
show details | |

|
#32
Century Oaks Ln
La Marque, TX 77568
|
- sq. feet
|
- baths - beds |
show details | |

|
#33
Franlee St
La Marque, TX 77568
|
- sq. feet
|
- baths - beds |
show details | |

|
#34
Jetty Ridge Dr
La Marque, TX 77568
|
- sq. feet
|
- baths - beds |
show details | |

|
#35
Grand Haven Dr
La Marque, TX 77568
|
- sq. feet
|
- baths - beds |
show details | |

|
#36
Turquoise Trade Dr
La Marque, TX 77568
|
- sq. feet
|
- baths - beds |
show details | |

|
Check over 1 million property listings on Foreclosure.com!
|
browse all offers | |||


Median year apartment built: 1977
Household type by relationship:
Households: 18,796- Male householders: 2,967 (720 living alone), Female householders: 4,202 (1,318 living alone)
3,346 spouses (3,321 opposite-sex spouses), 465 unmarried partners, (438 opposite-sex unmarried partners), 5,179 children (4,795 natural, 123 adopted, 260 stepchildren), 1,045 grandchildren, 253 brothers or sisters, 260 parents, 7 foster children, 399 other relatives, 489 non-relatives
- In group quarters: 180
Size of family households: 1,839 2-persons, 1,184 3-persons, 1,199 4-persons, 389 5-persons, 73 6-persons, 246 7-or-more-persons.
Size of nonfamily households: 2,100 1-person, 430 2-persons, 34 3-persons.
2,036 married couples with children.
1,188 single-parent households (260 men, 928 women).
79.0% of residents of La Marque speak English at home.
18.1% of residents speak Spanish at home (75% speak English very well, 17% speak English well, 8% speak English not well, 1% don't speak English at all).
0.5% of residents speak other Indo-European language at home (83% speak English very well, 17% speak English well).
2.3% of residents speak Asian or Pacific Island language at home (60% speak English very well, 30% speak English well, 11% speak English not well).
Foreign born population: 1,402 (7.5%)
(34.1% of them are naturalized citizens)
| Here: | 5.9 |
| State: | 6.3 |
| Here: | 4.7 |
| State: | 4.0 |

- Bedrooms in owner-occupied houses and condos in La Marque, Texas
- 0no bedroom
- 481 bedroom
- 1,2082 bedrooms
- 2,8473 bedrooms
- 1,2854 bedrooms
- 1835+ bedrooms

- Bedrooms in renter-occupied apartments in La Marque, Texas
- 118no bedroom
- 2881 bedroom
- 5662 bedrooms
- 7643 bedrooms
- 1764 bedrooms
- 05+ bedrooms

- Cars and other vehicles available in La Marque in owner-occupied houses/condos
- 137no vehicle
- 1,8171 vehicle
- 2,3782 vehicles
- 7533 vehicles
- 3994 vehicles
- 865+ vehicles

- Cars and other vehicles available in La Marque in renter-occupied apartments
- 294no vehicle
- 7151 vehicle
- 7782 vehicles
- 963 vehicles
- 304 vehicles
- 05+ vehicles

- Rooms in owner-occupied houses in La Marque, Texas
- 01 room
- 172 rooms
- 563 rooms
- 5884 rooms
- 1,3235 rooms
- 1,4626 rooms
- 9867 rooms
- 6128 rooms
- 5279+ rooms

- Rooms in renter-occupied apartments in La Marque, Texas
- 1181 room
- 1902 rooms
- 1753 rooms
- 3234 rooms
- 3995 rooms
- 3936 rooms
- 2157 rooms
- 398 rooms
- 599+ rooms


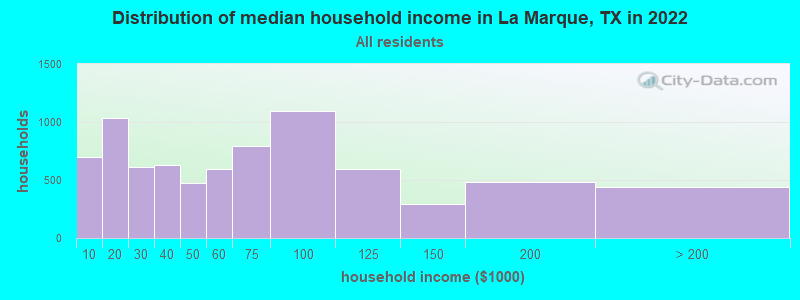
La Marque, TX household income distribution

- 697Less than $10,000
- 1,033$10,000 to $19,999
- 609$20,000 to $29,999
- 630$30,000 to $39,999
- 471$40,000 to $49,999
- 598$50,000 to $59,999
- 793$60,000 to $74,999
- 1,093$75,000 to $99,999
- 599$100,000 to $124,999
- 289$125,000 to $149,999
- 485$150,000 to $199,999
- 443$200,000 or more
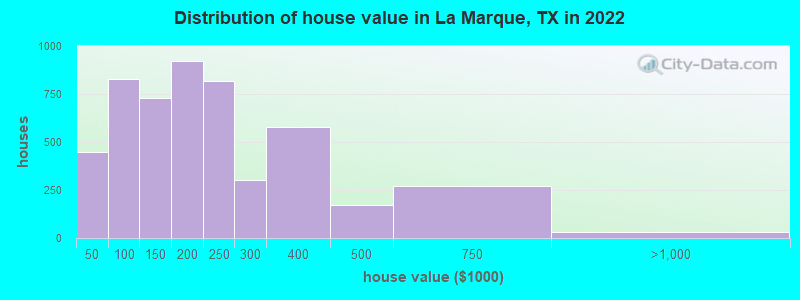
Home value of owner - occupied houses in 2022 in La Marque, TX
-
- 139Less than $10,000
- 12$10,000 to $14,999
- 36$15,000 to $19,999
- 82$20,000 to $24,999
- 16$25,000 to $29,999
- 22$30,000 to $34,999
- 62$35,000 to $39,999
- 76$40,000 to $49,999
- 173$50,000 to $59,999
- 133$60,000 to $69,999
- 164$70,000 to $79,999
- 185$80,000 to $89,999
- 95$90,000 to $99,999
- 305$100,000 to $124,999
- 422$125,000 to $149,999
- 435$150,000 to $174,999
- 486$175,000 to $199,999
- 819$200,000 to $249,999
- 300$250,000 to $299,999
- 580$300,000 to $399,999
- 170$400,000 to $499,999
- 273$500,000 to $749,999
- 31$750,000 to $999,999
Rent paid by renters in 2022 in La Marque, TX
-
- 5$200 to $249
- 30$450 to $499
- 72$500 to $549
- 21$550 to $599
- 99$600 to $649
- 30$650 to $699
- 166$700 to $749
- 123$750 to $799
- 268$800 to $899
- 230$900 to $999
- 245$1,000 to $1,249
- 196$1,250 to $1,499
- 149$1,500 to $1,999
- 271No cash rent


Percentage of workers working in this county: 67.3%
Number of people working at home: 543 (6.5% of all workers)
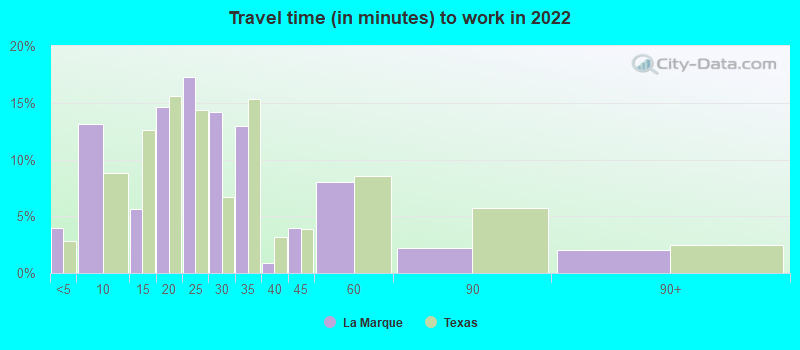
Travel time to work (commute)
- Less than 5 minutes: 157
- 5 to 9 minutes: 908
- 10 to 14 minutes: 730
- 15 to 19 minutes: 1,077
- 20 to 24 minutes: 825
- 25 to 29 minutes: 579
- 30 to 34 minutes: 1,408
- 35 to 39 minutes: 312
- 40 to 44 minutes: 413
- 45 to 59 minutes: 686
- 60 to 89 minutes: 355
- 90 or more minutes: 184
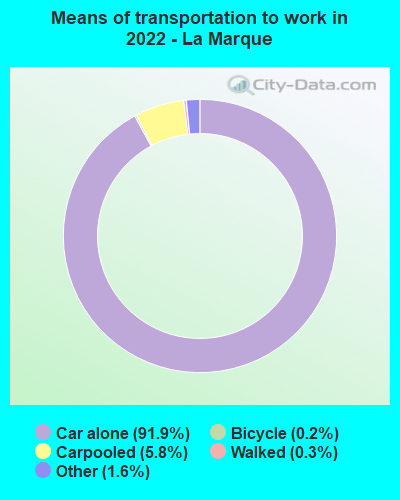
Means of transportation to work:
- Drove a car alone: 3,722 (77.3%)
- Carpooled: 297 (6.2%)
- Bus: 1 (0.0%)
- Taxi: 156 (3.2%)
- Bicycle: 4 (0.1%)
- Walked: 14 (0.3%)
- Worked at home: 543 (11.3%)

- Unemployment by race in 2022
- Unemployment rate for White non-Hispanic residents
- 4.3%Males
- 3.1%Females
- Unemployment rate for Black residents
- 6.0%Males
- 29.7%Females
- Unemployment rate for Asian residents
- 23.4%Males
- Unemployment rate for two or more race residents
- 6.8%Females
- Unemployment rate for Hispanic or Latino residents
- 1.7%Males
- 2.0%Females

- Year of entry for the foreign-born population in La Marque, Texas
- 3432010 or later
- 4342000 to 2009
- 3051990 to 1999
- 741980 to 1989
- 1341970 to 1979
- 109Before 1970
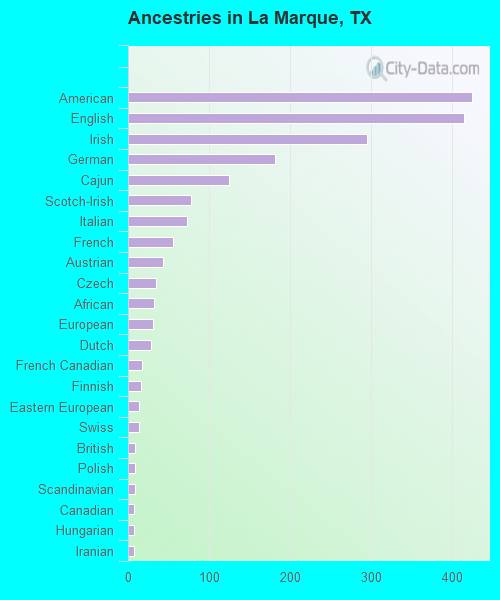
First ancestries reported:
- American: 425 (4.6%)
- English: 415 (4.5%)
- Irish: 296 (3.2%)
- German: 182 (2.0%)
- Cajun: 125 (1.4%)
- Scotch-Irish: 78 (0.8%)
- Italian: 73 (0.8%)
- French: 56 (0.6%)
- Austrian: 43 (0.5%)
- Czech: 35 (0.4%)
- African: 32 (0.3%)
- European: 31 (0.3%)
- Dutch: 29 (0.3%)
- French Canadian: 17 (0.2%)
- Finnish: 16 (0.2%)
- Eastern European: 13 (0.1%)
- Swiss: 13 (0.1%)
- British: 9 (0.10%)
- Polish: 9 (0.10%)
- Scandinavian: 9 (0.10%)
- Canadian: 8 (0.09%)
- Hungarian: 8 (0.09%)
- Iranian: 8 (0.09%)
- Norwegian: 3 (0.03%)
Most common places of birth for foreign-born residents (%):
| La Marque: | 41.6% (538) |
| Texas: | 48.4% (2,411,723) |
| La Marque: | 21.2% (274) |
| Texas: | 3.0% (147,182) |
| La Marque: | 15.5% (200) |
| Texas: | 2.1% (103,148) |
| La Marque: | 9.3% (120) |
| Texas: | 4.5% (224,455) |
| La Marque: | 2.2% (29) |
| Texas: | 2.3% (115,558) |
| La Marque: | 2.0% (26) |
| Texas: | 1.8% (87,382) |
| La Marque: | 1.7% (22) |
| Texas: | 0.1% (2,774) |
Place of birth for U.S.-born residents:
- This state: 12,874
- Other state: 4,108
- Northeast: 288
- Midwest: 1,354
- South: 1,758
- West: 633
88.9% of La Marque residents lived in the same house 1 years ago.
Out of people who lived in different houses, 34.9% lived in this county.
Out of people who lived in different counties, 44.0% lived in Texas.
| La Marque: | 88.9% |
| State average: | 85.7% |
Education attainment for males 25 years and older:
- No schooling: 235
- Nursery to 4th grade: 0
- 5th and 6th grade: 40
- 7th and 8th grade: 71
- 9th grade: 51
- 10th grade: 161
- 11th grade: 84
- 12th grade, no diploma: 118
- High school graduate (or equivalency): 2,018
- Less than 1 year of college: 783
- Some college more than 1 year, no degree: 838
- Associate degree: 417
- Bachelor's degree: 593
- Master's degree: 276
- Professional school degree: 100
- Doctorate degree: 157

Education attainment for females 25 years and older:
- No schooling: 162
- Nursery to 4th grade: 16
- 5th and 6th grade: 128
- 7th and 8th grade: 68
- 9th grade: 139
- 10th grade: 110
- 11th grade: 170
- 12th grade, no diploma: 159
- High school graduate (or equivalency): 2,154
- Less than 1 year of college: 573
- Some college more than 1 year, no degree: 1,123
- Associate degree: 543
- Bachelor's degree: 1,007
- Master's degree: 649
- Professional school degree: 8
- Doctorate degree: 14


Housing units in structures:
- One, detached: 6,849
- One, attached: 57
- Two: 54
- 3 or 4: 272
- 5 to 9: 181
- 10 to 19: 166
- 20 to 49: 114
- 50 or more: 170
- Mobile homes: 279
Median worth of mobile homes: $13,684
Housing units lacking complete kitchen facilities in 2022: 3.1%
House/condo owner moved in on average 7 years ago
Renter moved in on average 4 years ago

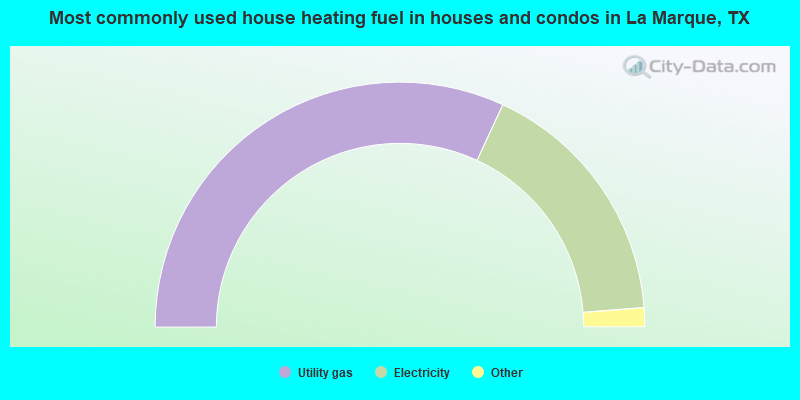
- 63.8%Utility gas
- 33.7%Electricity
- 1.2%Other fuel
- 0.9%Bottled, tank, or LP gas
- 0.4%No fuel used
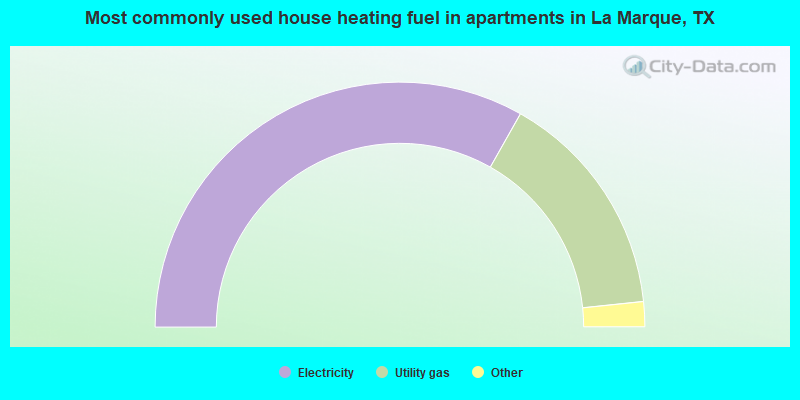
- 66.4%Electricity
- 30.3%Utility gas
- 1.8%Bottled, tank, or LP gas
- 1.4%No fuel used
Private vs. public school enrollment:
| Here: | 6.9% |
| Texas: | 8.8% |
| Here: | 3.7% |
| Texas: | 8.0% |
| Here: | 26.1% |
| Texas: | 16.2% |


