Races in La Marque, Texas (TX) Detailed Stats
Data:
Races - White alone (%)
Races - White alone (% change since 2000)
Races - Black alone (%)
Races - Black alone (% change since 2000)
Races - American Indian alone (%)
Races - American Indian alone (% change since 2000)
Races - Asian alone (%)
Races - Asian alone (% change since 2000)
Races - Hispanic (%)
Races - Hispanic (% change since 2000)
Races - Native Hawaiian and Other Pacific Islander alone (%)
Races - Native Hawaiian and Other Pacific Islander alone (% change since 2000)
Races - Two or more races(%)
Races - Two or more races(% change since 2000)
Races - Other race alone (%)
Races - Other race alone (% change since 2000)
Racial diversity
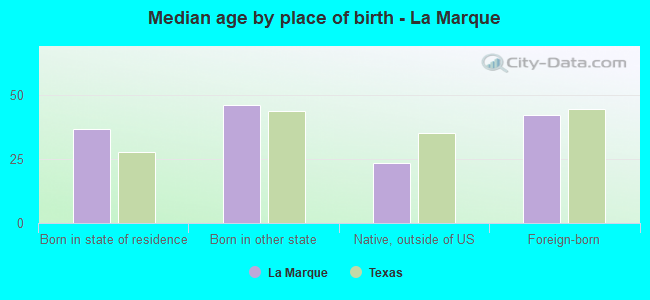
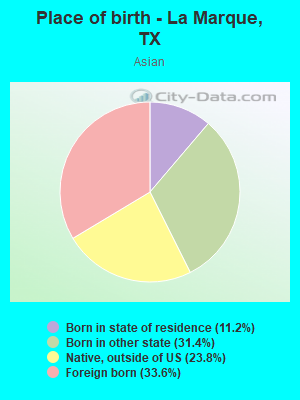
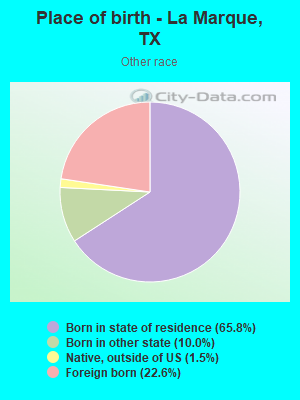
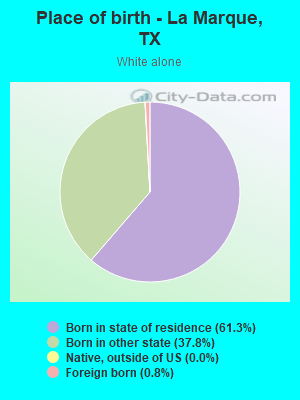
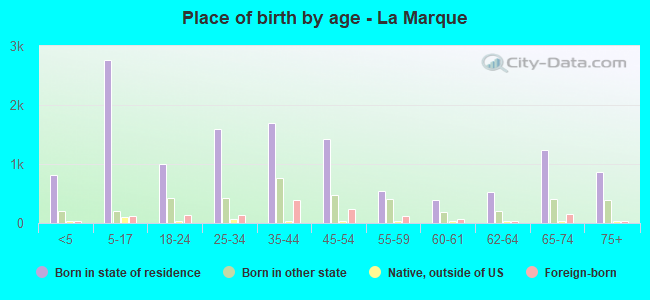
Place of birth - Born in state of residence (%)
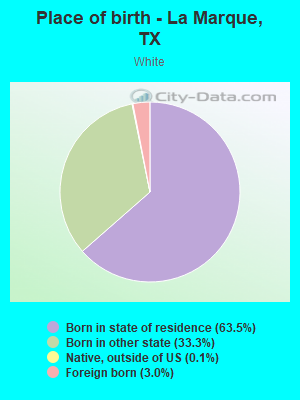
Place of birth - Born in state of residence (%) - White
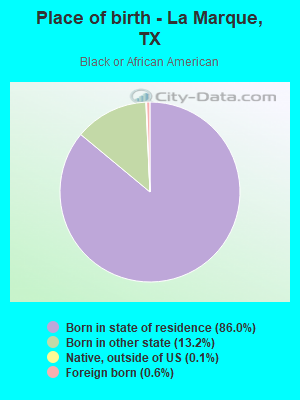
Place of birth - Born in state of residence (%) - Black or African American
Place of birth - Born in state of residence (%) - Asian
Place of birth - Born in state of residence (%) - Hispanic or Latino
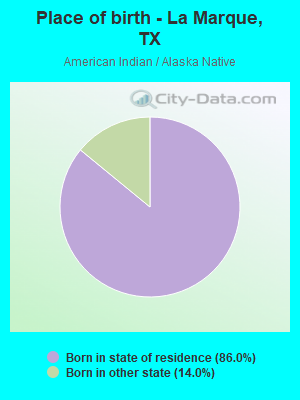
Place of birth - Born in state of residence (%) - American Indian and Alaska Native
Place of birth - Born in state of residence (%) - Multirace
Place of birth - Born in state of residence (%) - Other Race
Place of birth - Born in other state (%)
Place of birth - Born in other state (%) - White
Place of birth - Born in other state (%) - Black or African American
Place of birth - Born in other state (%) - Asian
Place of birth - Born in other state (%) - Hispanic or Latino
Place of birth - Born in other state (%) - American Indian and Alaska Native
Place of birth - Born in other state (%) - Multirace
Place of birth - Born in other state (%) - Other Race
Place of birth - Native, outside of US (%)
Place of birth - Native, outside of US (%) - White
Place of birth - Native, outside of US (%) - Black or African American
Place of birth - Native, outside of US (%) - Asian
Place of birth - Native, outside of US (%) - Hispanic or Latino
Place of birth - Native, outside of US (%) - American Indian and Alaska Native
Place of birth - Native, outside of US (%) - Multirace
Place of birth - Native, outside of US (%) - Other Race
Place of birth - Foreign born (%)
Place of birth - Foreign born (%) - White
Place of birth - Foreign born (%) - Black or African American
Place of birth - Foreign born (%) - Asian
Place of birth - Foreign born (%) - Hispanic or Latino
Place of birth - Foreign born (%) - American Indian and Alaska Native
Place of birth - Foreign born (%) - Multirace
Place of birth - Foreign born (%) - Other Race
Residents speaking English at home (%)
Residents speaking English at home - Born in the United States (%)
Residents speaking English at home - Native, born elsewhere (%)
Residents speaking English at home - Foreign born (%)
Residents speaking Spanish at home (%)
Residents speaking Spanish at home - Born in the United States (%)
Residents speaking Spanish at home - Native, born elsewhere (%)
Residents speaking Spanish at home - Foreign born (%)
Residents speaking other language at home (%)
Residents speaking other language at home - Born in the United States (%)
Residents speaking other language at home - Native, born elsewhere (%)
Residents speaking other language at home - Foreign born (%)
Marital status - Never married (%)
Marital status - Now married (%)
Marital status - Separated (%)
Marital status - Widowed (%)
Marital status - Divorced (%)
Ancestries Reported - Arab (%)
Ancestries Reported - Czech (%)
Ancestries Reported - Danish (%)
Ancestries Reported - Dutch (%)
Ancestries Reported - English (%)
Ancestries Reported - French (%)
Ancestries Reported - French Canadian (%)
Ancestries Reported - German (%)
Ancestries Reported - Greek (%)
Ancestries Reported - Hungarian (%)
Ancestries Reported - Irish (%)
Ancestries Reported - Italian (%)
Ancestries Reported - Lithuanian (%)
Ancestries Reported - Norwegian (%)
Ancestries Reported - Polish (%)
Ancestries Reported - Portuguese (%)
Ancestries Reported - Russian (%)
Ancestries Reported - Scotch-Irish (%)
Ancestries Reported - Scottish (%)
Ancestries Reported - Slovak (%)
Ancestries Reported - Subsaharan African (%)
Ancestries Reported - Swedish (%)
Ancestries Reported - Swiss (%)
Ancestries Reported - Ukrainian (%)
Ancestries Reported - United States (%)
Ancestries Reported - Welsh (%)
Ancestries Reported - West Indian (%)
Ancestries Reported - Other (%)
Geographical mobility - Same house 1 year ago (%)
Geographical mobility - Same house 1 year ago (%) - White
Geographical mobility - Same house 1 year ago (%) - Black or African American
Geographical mobility - Same house 1 year ago (%) - Asian
Geographical mobility - Same house 1 year ago (%) - Hispanic or Latino
Geographical mobility - Same house 1 year ago (%) - American Indian and Alaska Native
Geographical mobility - Same house 1 year ago (%) - Multirace
Geographical mobility - Same house 1 year ago (%) - Other Race
Geographical mobility - Moved within same county (%)
Geographical mobility - Moved within same county (%) - White
Geographical mobility - Moved within same county (%) - Black or African American
Geographical mobility - Moved within same county (%) - Asian
Geographical mobility - Moved within same county (%) - Hispanic or Latino
Geographical mobility - Moved within same county (%) - American Indian and Alaska Native
Geographical mobility - Moved within same county (%) - Multirace
Geographical mobility - Moved within same county (%) - Other Race
Geographical mobility - Moved from different county within same state (%)
Geographical mobility - Moved from different county within same state (%) - White
Geographical mobility - Moved from different county within same state (%) - Black or African American
Geographical mobility - Moved from different county within same state (%) - Asian
Geographical mobility - Moved from different county within same state (%) - Hispanic or Latino
Geographical mobility - Moved from different county within same state (%) - American Indian and Alaska Native
Geographical mobility - Moved from different county within same state (%) - Multirace
Geographical mobility - Moved from different county within same state (%) - Other Race
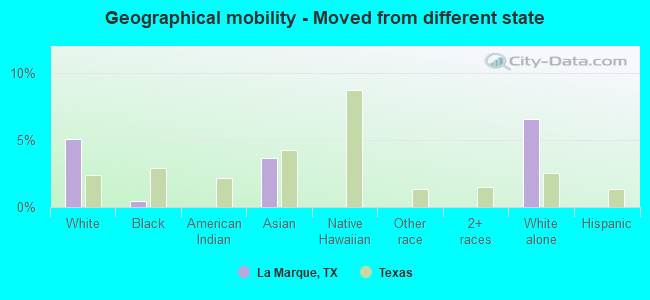
Geographical mobility - Moved from different state (%)
Geographical mobility - Moved from different state (%) - White
Geographical mobility - Moved from different state (%) - Black or African American
Geographical mobility - Moved from different state (%) - Asian
Geographical mobility - Moved from different state (%) - Hispanic or Latino
Geographical mobility - Moved from different state (%) - American Indian and Alaska Native
Geographical mobility - Moved from different state (%) - Multirace
Geographical mobility - Moved from different state (%) - Other Race
Geographical mobility - Moved from abroad (%)
Geographical mobility - Moved from abroad (%) - White
Geographical mobility - Moved from abroad (%) - Black or African American
Geographical mobility - Moved from abroad (%) - Asian
Geographical mobility - Moved from abroad (%) - Hispanic or Latino
Geographical mobility - Moved from abroad (%) - American Indian and Alaska Native
Geographical mobility - Moved from abroad (%) - Multirace
Geographical mobility - Moved from abroad (%) - Other Race
Place of birth for the foreign-born population - Ireland (%)
Place of birth for the foreign-born population - Denmark (%)
Place of birth for the foreign-born population - Norway (%)
Place of birth for the foreign-born population - Sweden (%)
Place of birth for the foreign-born population - United Kingdom (%)
Place of birth for the foreign-born population - England (%)
Place of birth for the foreign-born population - Scotland (%)
Place of birth for the foreign-born population - Other Northern Europe (%)
Place of birth for the foreign-born population - Austria (%)
Place of birth for the foreign-born population - Belgium (%)
Place of birth for the foreign-born population - France (%)
Place of birth for the foreign-born population - Germany (%)
Place of birth for the foreign-born population - Netherlands (%)
Place of birth for the foreign-born population - Switzerland (%)
Place of birth for the foreign-born population - Other Western Europe (%)
Place of birth for the foreign-born population - Greece (%)
Place of birth for the foreign-born population - Italy (%)
Place of birth for the foreign-born population - Portugal (%)
Place of birth for the foreign-born population - Spain (%)
Place of birth for the foreign-born population - Other Southern Europe (%)
Place of birth for the foreign-born population - Albania (%)
Place of birth for the foreign-born population - Belarus (%)
Place of birth for the foreign-born population - Bosnia and Herzegovina (%)
Place of birth for the foreign-born population - Bulgaria (%)
Place of birth for the foreign-born population - Croatia (%)
Place of birth for the foreign-born population - Czechoslovakia (%)
Place of birth for the foreign-born population - Hungary (%)
Place of birth for the foreign-born population - Latvia (%)
Place of birth for the foreign-born population - Lithuania (%)
Place of birth for the foreign-born population - North Macedonia (Macedonia) (%)
Place of birth for the foreign-born population - Moldova (%)
Place of birth for the foreign-born population - Poland (%)
Place of birth for the foreign-born population - Romania (%)
Place of birth for the foreign-born population - Russia (%)
Place of birth for the foreign-born population - Serbia (%)
Place of birth for the foreign-born population - Ukraine (%)
Place of birth for the foreign-born population - Other Eastern Europe (%)
Place of birth for the foreign-born population - China (%)
Place of birth for the foreign-born population - Hong Kong (%)
Place of birth for the foreign-born population - Taiwan (%)
Place of birth for the foreign-born population - Japan (%)
Place of birth for the foreign-born population - Korea (%)
Place of birth for the foreign-born population - Other Eastern Asia (%)
Place of birth for the foreign-born population - Afghanistan (%)
Place of birth for the foreign-born population - Bangladesh (%)
Place of birth for the foreign-born population - India (%)
Place of birth for the foreign-born population - Iran (%)
Place of birth for the foreign-born population - Kazakhstan (%)
Place of birth for the foreign-born population - Nepal (%)
Place of birth for the foreign-born population - Pakistan (%)
Place of birth for the foreign-born population - Sri Lanka (%)
Place of birth for the foreign-born population - Uzbekistan (%)
Place of birth for the foreign-born population - Other South Central Asia (%)
Place of birth for the foreign-born population - Burma (%)
Place of birth for the foreign-born population - Cambodia (%)
Place of birth for the foreign-born population - Indonesia (%)
Place of birth for the foreign-born population - Laos (%)
Place of birth for the foreign-born population - Malaysia (%)
Place of birth for the foreign-born population - Philippines (%)
Place of birth for the foreign-born population - Singapore (%)
Place of birth for the foreign-born population - Thailand (%)
Place of birth for the foreign-born population - Vietnam (%)
Place of birth for the foreign-born population - Other South Eastern Asia (%)
Place of birth for the foreign-born population - Armenia (%)
Place of birth for the foreign-born population - Iraq (%)
Place of birth for the foreign-born population - Israel (%)
Place of birth for the foreign-born population - Jordan (%)
Place of birth for the foreign-born population - Kuwait (%)
Place of birth for the foreign-born population - Lebanon (%)
Place of birth for the foreign-born population - Saudi Arabia (%)
Place of birth for the foreign-born population - Syria (%)
Place of birth for the foreign-born population - Turkey (%)
Place of birth for the foreign-born population - Yemen (%)
Place of birth for the foreign-born population - Other Western Asia (%)
Place of birth for the foreign-born population - Eritrea (%)
Place of birth for the foreign-born population - Ethiopia (%)
Place of birth for the foreign-born population - Kenya (%)
Place of birth for the foreign-born population - Somalia (%)
Place of birth for the foreign-born population - Uganda (%)
Place of birth for the foreign-born population - Zimbabwe (%)
Place of birth for the foreign-born population - Other Eastern Africa (%)
Place of birth for the foreign-born population - Cameroon (%)
Place of birth for the foreign-born population - Congo (%)
Place of birth for the foreign-born population - Democratic Republic of Congo (Zaire) (%)
Place of birth for the foreign-born population - Other Middle Africa (%)
Place of birth for the foreign-born population - Egypt (%)
Place of birth for the foreign-born population - Morocco (%)
Place of birth for the foreign-born population - Sudan (%)
Place of birth for the foreign-born population - Other Northern Africa (%)
Place of birth for the foreign-born population - South Africa (%)
Place of birth for the foreign-born population - Other Southern Africa (%)
Place of birth for the foreign-born population - Cabo Verde (%)
Place of birth for the foreign-born population - Ghana (%)
Place of birth for the foreign-born population - Liberia (%)
Place of birth for the foreign-born population - Nigeria (%)
Place of birth for the foreign-born population - Senegal (%)
Place of birth for the foreign-born population - Sierra Leone (%)
Place of birth for the foreign-born population - Other Western Africa (%)
Place of birth for the foreign-born population - Australia (%)
Place of birth for the foreign-born population - New Zealand (%)
Place of birth for the foreign-born population - Fiji (%)
Place of birth for the foreign-born population - Micronesia (%)
Place of birth for the foreign-born population - Bahamas (%)
Place of birth for the foreign-born population - Barbados (%)
Place of birth for the foreign-born population - Cuba (%)
Place of birth for the foreign-born population - Dominica (%)
Place of birth for the foreign-born population - Dominican Republic (%)
Place of birth for the foreign-born population - Grenada (%)
Place of birth for the foreign-born population - Haiti (%)
Place of birth for the foreign-born population - Jamaica (%)
Place of birth for the foreign-born population - St. Vincent and the Grenadines (%)
Place of birth for the foreign-born population - Trinidad and Tobago (%)
Place of birth for the foreign-born population - West Indies (%)
Place of birth for the foreign-born population - Other Caribbean (%)
Place of birth for the foreign-born population - Belize (%)
Place of birth for the foreign-born population - Costa Rica (%)
Place of birth for the foreign-born population - El Salvador (%)
Place of birth for the foreign-born population - Guatemala (%)
Place of birth for the foreign-born population - Honduras (%)
Place of birth for the foreign-born population - Mexico (%)
Place of birth for the foreign-born population - Nicaragua (%)
Place of birth for the foreign-born population - Panama (%)
Place of birth for the foreign-born population - Other Central America (%)
Place of birth for the foreign-born population - Argentina (%)
Place of birth for the foreign-born population - Bolivia (%)
Place of birth for the foreign-born population - Brazil (%)
Place of birth for the foreign-born population - Chile (%)
Place of birth for the foreign-born population - Colombia (%)
Place of birth for the foreign-born population - Ecuador (%)
Place of birth for the foreign-born population - Guyana (%)
Place of birth for the foreign-born population - Peru (%)
Place of birth for the foreign-born population - Uruguay (%)
Place of birth for the foreign-born population - Venezuela (%)
Place of birth for the foreign-born population - Other South America (%)
Place of birth for the foreign-born population - Canada (%)
Place of birth for the foreign-born population - Other Northern America (%)
Place of birth for the foreign-born population - Other (%)
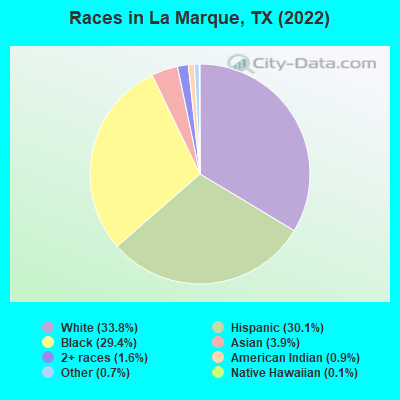
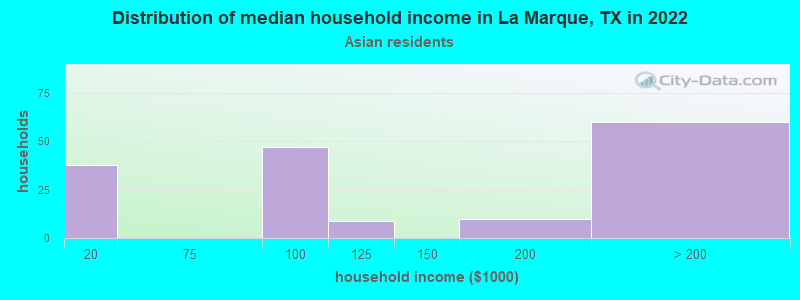
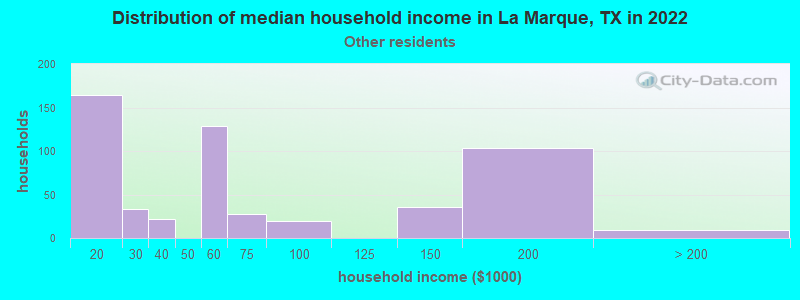
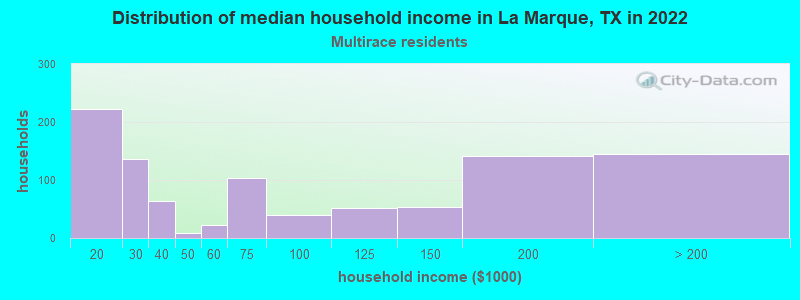
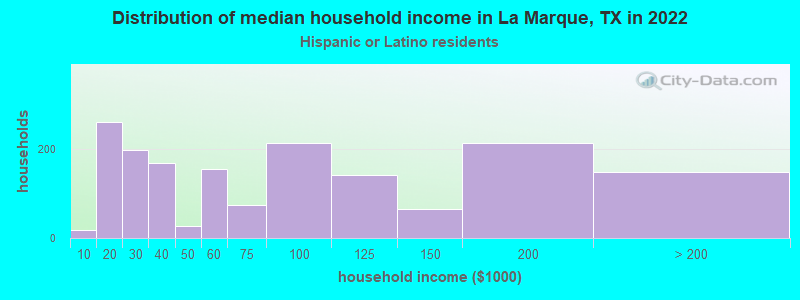
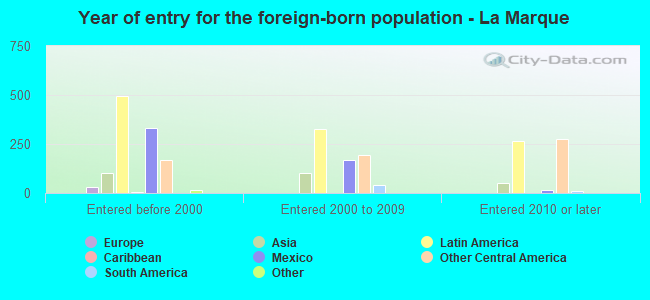
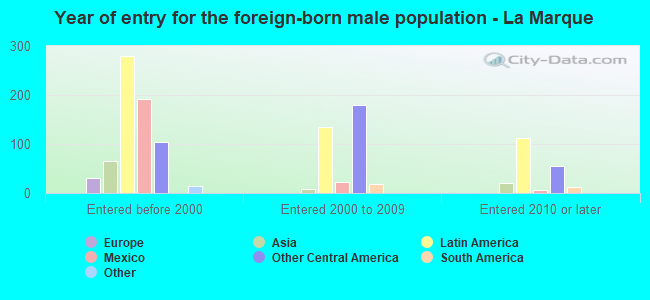
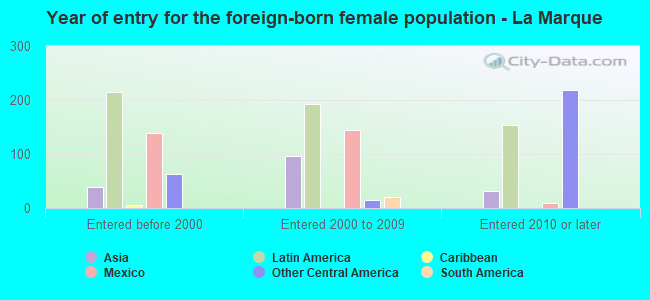
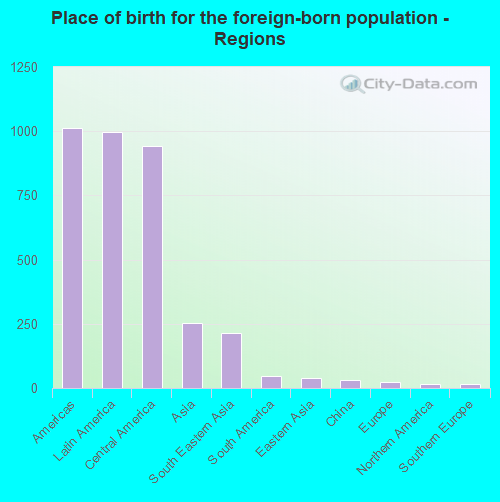
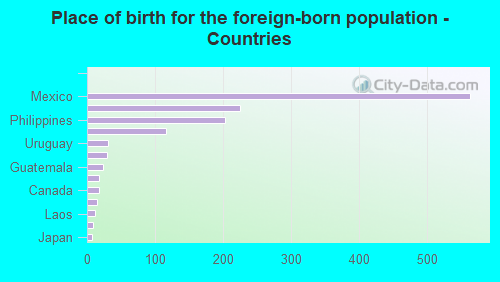
According to 2022 data, the most numerous races in La Marque, TX are Hispanic (5,666 residents), White alone (6,352 residents), and Black alone (5,520 residents). 77.8% of La Marque residents speak English at home. 6.9% of La Marque, TX residents are foreign-born (5.2% born in Latin America, 1.3% born in Asia), which is 147.3% less than the foreign-born rate of 17.0% across the entire state of Texas.
Race distribution in La Marque
2000 2022
10,933,313 52.4% White alone 6,669,666 32.0% Hispanic 2,364,255 11.3% Black alone 554,445 2.7% Asian alone 230,567 1.1% Two or more races 68,859 0.3% American Indian alone 19,958 0.10% Other race alone 10,757 0.05% Native Hawaiian and Other
12,070,642 40.2% Hispanic 11,683,430 38.9% White alone 3,508,706 11.7% Black alone 1,608,173 5.4% Asian alone 956,560 3.2% Two or more races 125,763 0.4% Other race alone 47,023 0.2% American Indian alone 29,275 0.10% Native Hawaiian and Other
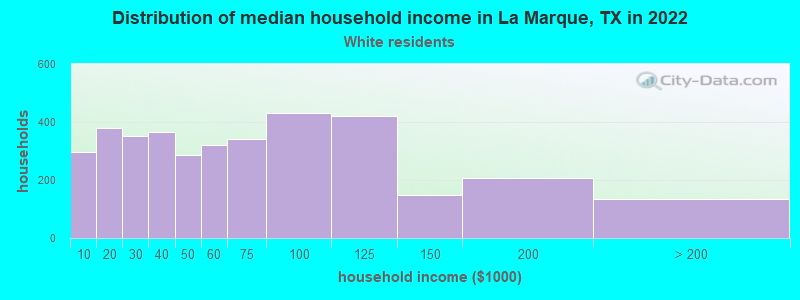
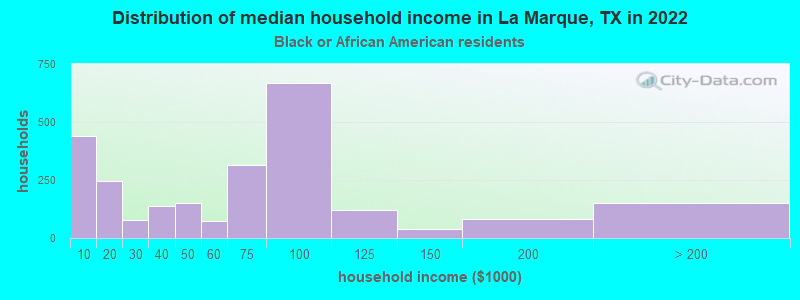
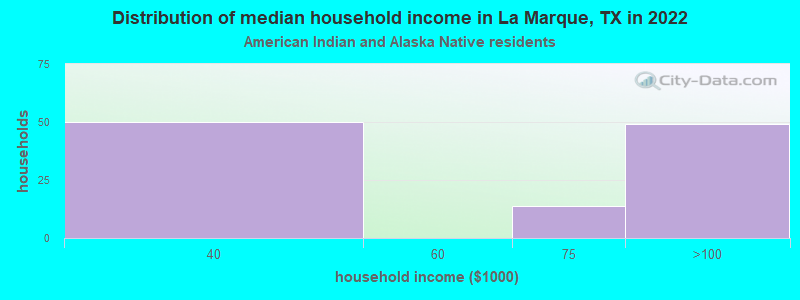
Income and house value in La Marque Median household income in 2022 $51,561 White non-Hispanic householders$63,606 Black householders$52,147 Some other race householders$90,395 Two or more races householders$84,350 Hispanic or Latino race householdersMedian 2022 house value $202,144 White Non-Hispanic householders$203,854 Black or African American householders$230,875 American Indian or Alaska Native householders $233,611 Asian householders$233,611 Some other race householders$178,201 Two or more races householders$204,538 Hispanic or Latino householders
Median age by race in La Marque
42.0 Median age for White residents41.4 42.1 42.3 Median age for Black or African American residents38.6 49.6 50.7 Median age for American Indian / Alaska Native residents60.2 50.9 30.5 Median age for Asian residents22.2 47.9 -581,560,283.1 Median age for Native Hawaiian / Pacific Islander residents-612,729,233.5 -577,777,777.2 31.8 Median age for Other race residents25.3 28.8 40.3 Median age for Two or more races residents39.3 39.9 44.3 Median age for White alone residents43.0 45.8 31.8 Median age for Hispanic or Latino residents34.2 31.7
Owner/renter occupied households by race in La Marque
House owners and renters - White residents 2,768 78.0% Owner occupied779 22.0% Renter occupiedHouse owners and renters - Black or African American residents 1,520 66.3% Owner occupied773 33.7% Renter occupiedHouse owners and renters - American Indian / Alaska Native residents 68 60.2% Owner occupied45 39.8% Renter occupiedHouse owners and renters - Asian residents 155 100.0% Owner occupiedHouse owners and renters - Native Hawaiian / Pacific Islander residents 29 100.0% Owner occupiedHouse owners and renters - Other race residents 337 57.4% Owner occupied250 42.6% Renter occupiedHouse owners and renters - Two or more races residents 775 80.3% Owner occupied190 19.7% Renter occupiedHouse owners and renters - White alone residents 2,344 79.2% Owner occupied617 20.8% Renter occupiedHouse owners and renters - Hispanic or Latino residents 1,257 74.2% Owner occupied437 25.8% Renter occupied
Language usage in La Marque
English speakers - Total 77.8% of residents of La Marque speak English at home.
19.3% of residents speak Spanish at home 2,416 70.5% Speak English very well1,009 29.5% Speak English less than very well2.9% of residents speak other language at home 297 57.8% Speak English very well217 42.2% Speak English less than very well
English speakers - Born in the United States 89.5% of residents of La Marque speak English at home.
5.9% of residents speak Spanish at home 223 96.1% Speak English very well9 3.9% Speak English less than very well4.6% of residents speak other language at home 94 52.8% Speak English very well84 47.2% Speak English less than very well
English speakers - Native, born elsewhere 30.2% of residents of La Marque speak English at home.
70.7% of residents speak Spanish at home 101 61.6% Speak English very well63 38.4% Speak English less than very well21.6% of residents speak other language at home 50 100.0% Speak English less than very well
English speakers - Foreign-born 12.2% of residents of La Marque speak English at home.
66.0% of residents speak Spanish at home 329 35.5% Speak English very well597 64.5% Speak English less than very well22.1% of residents speak other language at home 222 71.6% Speak English very well88 28.4% Speak English less than very well
White (Caucasian) - Speak another language Native:
7.9% (561)Foreign-born:
75.3% (182)
Black or African American - Speak another language Native:
2.6% (148)Foreign-born:
43.7% (15)
Asian - Speak only English Native:
45.2% (229)Foreign-born:
2.8% (7)
Asian - Speak another language Native:
54.8% (277)Foreign-born:
99.1% (246)
Other race - Speak only English Native:
52.3% (881)Foreign-born:
57.0% (277)
Other race - Speak another language Native:
47.9% (808)Foreign-born:
46.3% (225)
Two or more races - Speak only English Native:
58.6% (1,141)Foreign-born:
1.0% (6)
Two or more races - Speak another language Native:
41.2% (803)Foreign-born:
100.0% (653)
White alone - Speak another language Native:
1.8% (107)Foreign-born:
100.0% (53)
Hispanic or Latino - Speak only English Native:
51.3% (2,147)Foreign-born:
15.5% (168)
Hispanic or Latino - Speak another language Native:
48.7% (2,036)Foreign-born:
84.7% (915)
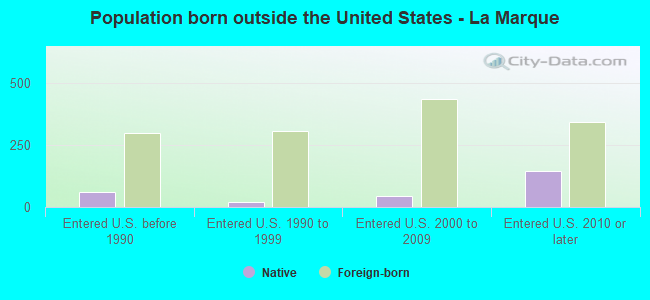
Foreign-born residents in La Marque 1,292 residents are foreign born (5.2% Latin America , 1.3% Asia ).
This city:
6.9%Texas:
17.1%
Marital status for residents in La Marque Marital status - White (Caucasian) population 15 years and over
Males 31.0% Never married51.3% Now married0.7% Separated3.5% Widowed13.6% DivorcedFemales 26.1% Never married43.3% Now married5.2% Separated10.6% Widowed14.9% DivorcedWomen who gave birth in the past 12 months Now married:
84.7% (98)Unmarried:
15.3% (18)
Women who did not give birth in the past 12 months Now married:
39.1% (729)Unmarried:
60.9% (1,133)
Marital status - Black or African American population 15 years and over
Males 34.3% Never married53.0% Now married3.6% Separated0.6% Widowed8.6% DivorcedFemales 30.5% Never married36.2% Now married2.5% Separated14.9% Widowed15.9% DivorcedWomen who did not give birth in the past 12 months Now married:
36.9% (459)Unmarried:
63.1% (785)
Marital status - American Indian / Alaska Native population 15 years and over
Males 0.0% Never married100.0% Now married0.0% Separated0.0% Widowed0.0% DivorcedFemales 39.2% Never married60.8% Now married0.0% Separated0.0% Widowed0.0% DivorcedWomen who did not give birth in the past 12 months Now married:
41.2% (47)Unmarried:
58.7% (67)
Marital status - Asian population 15 years and over
Males 68.8% Never married31.2% Now married0.0% Separated0.0% Widowed0.0% DivorcedFemales 0.0% Never married60.4% Now married4.9% Separated20.9% Widowed13.8% DivorcedWomen who gave birth in the past 12 months Now married:
0.0% (0)Unmarried:
100.0% (33)
Women who did not give birth in the past 12 months Now married:
76.3% (62)Unmarried:
23.7% (19)
Marital status - Other race population 15 years and over
Males 49.6% Never married42.5% Now married0.0% Separated0.0% Widowed7.9% DivorcedFemales 49.3% Never married40.6% Now married3.2% Separated4.6% Widowed2.4% DivorcedWomen who did not give birth in the past 12 months Now married:
35.2% (246)Unmarried:
64.8% (452)
Marital status - Two or more races population 15 years and over
Males 19.6% Never married68.0% Now married0.0% Separated0.0% Widowed12.4% DivorcedFemales 20.6% Never married57.8% Now married0.0% Separated7.1% Widowed14.6% DivorcedWomen who did not give birth in the past 12 months Now married:
60.1% (307)Unmarried:
39.9% (204)
Marital status - White alone, not Hispanic / Latino population 15 years and over
Males 25.2% Never married55.8% Now married0.2% Separated5.0% Widowed13.8% DivorcedFemales 21.3% Never married42.9% Now married4.9% Separated13.0% Widowed17.9% DivorcedWomen who gave birth in the past 12 months Now married:
84.5% (70)Unmarried:
15.5% (13)
Women who did not give birth in the past 12 months Now married:
39.1% (545)Unmarried:
60.9% (850)
Marital status - Hispanic or Latino population 15 years and over
Males 40.0% Never married48.6% Now married2.6% Separated0.0% Widowed8.8% DivorcedFemales 35.4% Never married48.8% Now married3.8% Separated4.6% Widowed7.4% DivorcedWomen who gave birth in the past 12 months Now married:
85.1% (42)Unmarried:
14.9% (7)
Women who did not give birth in the past 12 months Now married:
46.1% (670)Unmarried:
53.9% (784)
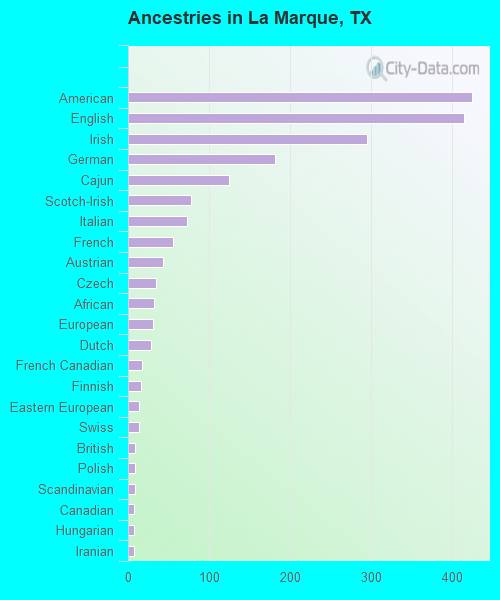
Ancestries in La Marque
425 4.6% American415 4.5% English296 3.2% Irish182 2.0% German125 1.4% Cajun78 0.8% Scotch-Irish73 0.8% Italian56 0.6% French43 0.5% Austrian35 0.4% Czech32 0.3% African31 0.3% European29 0.3% Dutch17 0.2% French Canadian16 0.2% Finnish13 0.1% Eastern European13 0.1% Swiss9 0.10% British9 0.10% Polish9 0.10% Scandinavian8 0.09% Canadian8 0.09% Hungarian8 0.09% Iranian3 0.03% Norwegian
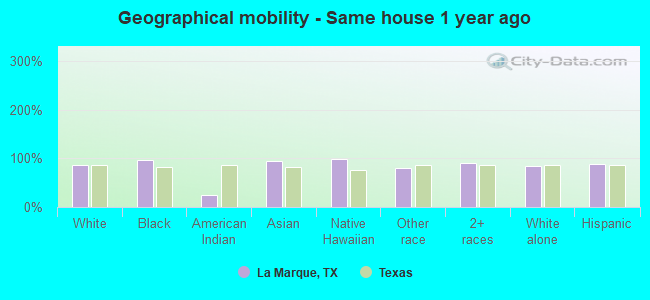
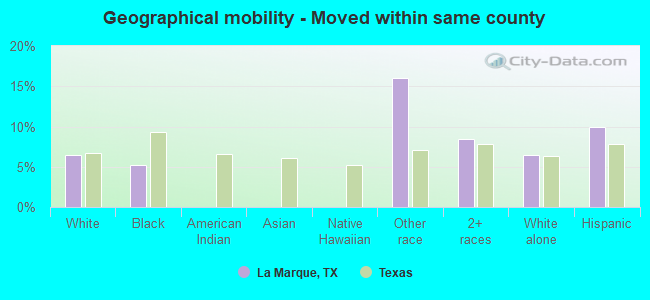
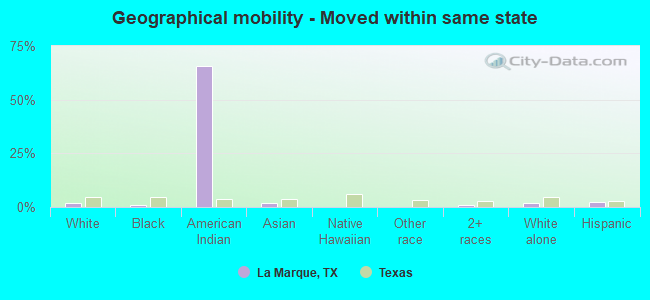
Geographical mobility in La Marque Same house 1 year ago 6,739 85.9% White (Caucasian)5,440 96.6% Black or African American63 25.5% American Indian / Alaska Native714 94.4% Asian24 98.2% Native Hawaiian / Pacific Islander1,792 80.5% Other race2,572 91.3% Two or more races5,368 84.8% White alone, not Hispanic / Latino4,946 87.5% Hispanic or LatinoMoved within same county 503 6.4% White / Caucasian294 5.2% Black or African American358 16.1% Other race237 8.4% Two or more races412 6.5% White alone, not Hispanic / Latino563 9.9% Hispanic or LatinoMoved within same state 158 2.0% White / Caucasian57 1.0% Black or African American162 65.6% American Indian / Alaska Native15 2.0% Asian30 1.1% Two or more races105 1.7% White alone, not Hispanic / Latino123 2.2% Hispanic or LatinoMoved from different state 398 5.1% White / Caucasian25 0.4% Black or African American28 3.7% Asian416 6.6% White alone, not Hispanic / Latino
Children Nativity (place of birth) in La Marque
Children under 6 years - Living with two parents Both parents native 566 100.0% NativeBoth parents foreign-born 109 100.0% NativeOne native, one foreign-born parent 32 100.0% NativeChildren under 6 years - Living with one parent Native parent 318 100.0% NativeChildren 6 to 17 years - Living with two parents Both parents native 1,245 100.0% NativeBoth parents foreign-born 103 100.0% NativeOne native, one foreign-born parent 71 100.0% NativeChildren 6 to 17 years - Living with one parent Native parent 734 100.0% NativeForeign-born parent 571 58.2% Native410 41.8% Foreign-born
Grandparents responsible for own grandchildren in La Marque
Grandparents (30 to 59 years) White / Caucasian 100 69.5% Responsible for grandchildren44 30.5% Not responsible for grandchildrenBlack or African American 104 88.3% Responsible for grandchildren14 11.7% Not responsible for grandchildrenAsian 38 100.0% Not responsible for grandchildrenOther race 10 100.0% Responsible for grandchildrenTwo or more races 78 38.0% Responsible for grandchildren128 62.0% Not responsible for grandchildrenWhite alone, not Hispanic / Latino 101 67.4% Responsible for grandchildren49 32.6% Not responsible for grandchildrenHispanic or Latino 64 46.6% Responsible for grandchildren74 53.4% Not responsible for grandchildrenGrandparents (60 years and over) White / Caucasian 43 56.7% Responsible for grandchildren33 43.3% Not responsible for grandchildrenBlack or African American 34 15.0% Responsible for grandchildren190 85.0% Not responsible for grandchildrenAsian 28 100.0% Not responsible for grandchildrenOther race 44 100.0% Not responsible for grandchildrenTwo or more races 21 100.0% Not responsible for grandchildrenWhite alone, not Hispanic / Latino 53 100.0% Responsible for grandchildrenHispanic or Latino 175 100.0% Not responsible for grandchildren