Huntersville, NC (North Carolina) Houses and Residents
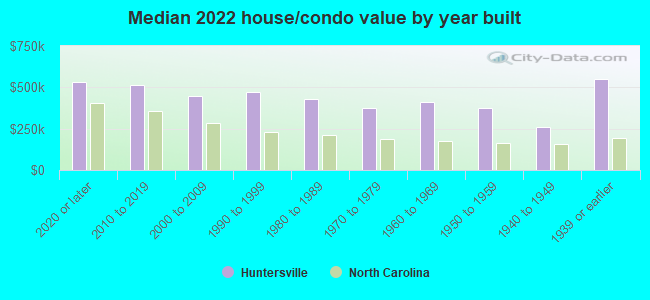
| Huntersville: | $473,203 |
| North Carolina: | $280,600 |
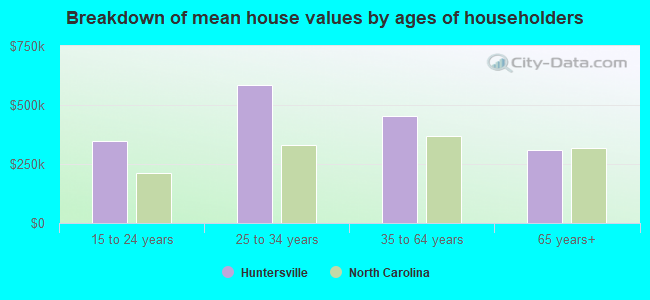
Mean price in 2022:
Detached houses: $434,965
Here: $434,965 State: $375,326 Townhouses or other attached units: $284,814
Here: $284,814 State: $317,935 In 5-or-more-unit structures: $343,233
Here: $343,233 State: $329,290 Mobile homes: $43,681
Here: $43,681 State: $124,933
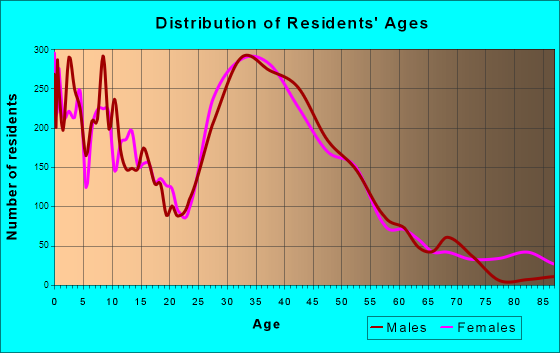
Total population: 51,567 (Urban population: 21,676, Rural population: 3,250 (all nonfarm))
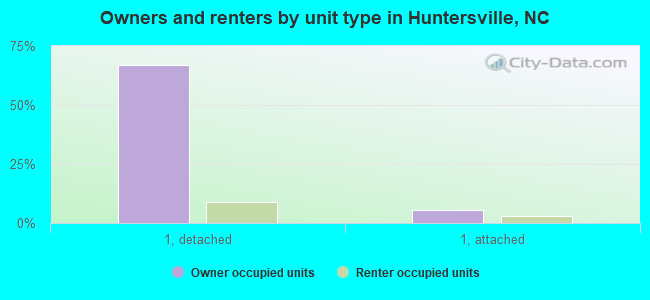
Houses: 25,173 (24,149 occupied: 17,771 owner occupied, 6,532 renter occupied)
| % of renters here: | 27% |
| State: | 33% |
Housing density: 808 houses/condos per square mile
Median price asked for vacant for-sale houses and condos in 2022: $367,223.
Median contract rent in 2022: $1,566 (lower quartile is $1,253, upper quartile is $1,969)
Median rent asked for vacant for-rent units in 2022: $1,285
Median gross rent in Huntersville, NC in 2022: $1,692
Housing units in Huntersville with a mortgage: 13,750 (1,581 second mortgage, 27 home equity loan, 1,440 both second mortgage and home equity loan)
Houses without a mortgage: 330
Median household income for houses/condos with a mortgage: $151,389
Median household income for apartments without a mortgage: $106,727
Median monthly housing costs: $1,723
Compare current foreclosures in Huntersville, NC:
| Photo | Address | Area | Beds / Baths | Price | Details |
|---|---|---|---|---|---|

|
#1
Vance Rd N
Huntersville, NC 28078
|
1,696 sq. feet
|
2 baths 3 beds |
show details | |

|
#2
Holyhead Ln
Huntersville, NC 28078
|
3,684 sq. feet
|
2 baths 4 beds |
show details | |

|
#3
Broadwell Ct
Huntersville, NC 28078
|
2,593 sq. feet
|
2 baths 4 beds |
show details | |

|
#4
Carbert Ln
Huntersville, NC 28078
|
1,830 sq. feet
|
3 baths 4 beds |
show details | |

|
#5
Leslie Brook Rd
Huntersville, NC 28078
|
1,904 sq. feet
|
2 baths 3 beds |
show details | |

|
#6
Canadice Rd
Huntersville, NC 28078
|
1,844 sq. feet
|
2 baths 3 beds |
show details | |

|
#7
Poplar Tent Rd
Huntersville, NC 28078
|
1,050 sq. feet
|
1 baths 3 beds |
show details | |

|
#8
Glen Miro Dr
Huntersville, NC 28078
|
3,923 sq. feet
|
4 baths 5 beds |
show details | |

|
#9
Perthsire Ct
Huntersville, NC 28078
|
2,136 sq. feet
|
3 baths 4 beds |
show details | |

|
#10
Vintage Hill Ln
Huntersville, NC 28078
|
4,058 sq. feet
|
4 baths 4 beds |
show details |
| Photo | Address | Area | Beds / Baths | Price | Details |
|---|---|---|---|---|---|

|
#11
Shiella Caruth Dr
Huntersville, NC 28078
|
1,835 sq. feet
|
2 baths 3 beds |
show details | |

|
#12
Oak Hill Dr
Huntersville, NC 28078
|
2,306 sq. feet
|
2 baths 4 beds |
show details | |

|
#13
Scottsboro Dr
Huntersville, NC 28078
|
2,614 sq. feet
|
2 baths 4 beds |
show details | |

|
#14
Angel Oak Dr
Huntersville, NC 28078
|
1,665 sq. feet
|
2 baths 3 beds |
show details | |

|
#15
Aberdeen Park Dr
Huntersville, NC 28078
|
3,462 sq. feet
|
3 baths 4 beds |
show details | |

|
#16
Damson Dr
Huntersville, NC 28078
|
2,590 sq. feet
|
2 baths 4 beds |
show details | |

|
#17
Poplar Shadow Dr
Huntersville, NC 28078
|
2,313 sq. feet
|
2 baths 4 beds |
show details | |

|
#18
Hugh Torance Pkwy
Huntersville, NC 28078
|
2,692 sq. feet
|
2 baths 4 beds |
show details | |

|
#19
E Douglas Park Dr
Huntersville, NC 28078
|
1,560 sq. feet
|
2 baths 3 beds |
show details | |

|
#20
Clarendon Point Ct
Huntersville, NC 28078
|
4,369 sq. feet
|
3 baths 5 beds |
show details |
| Photo | Address | Area | Beds / Baths | Price | Details |
|---|---|---|---|---|---|

|
#21
Bluff Meadow Trl
Huntersville, NC 28078
|
1,737 sq. feet
|
2 baths 3 beds |
show details | |

|
#22
Rutledge Ridge Dr NW
Huntersville, NC 28078
|
- sq. feet
|
- baths - beds |
show details | |

|
#23
Ramah Church Rd, Apt A
Huntersville, NC 28078
|
- sq. feet
|
- baths - beds |
show details | |

|
#24
Little Penny Dr, Apt 305
Huntersville, NC 28078
|
- sq. feet
|
- baths - beds |
show details | |

|
#25
Chantrey Way
Huntersville, NC 28078
|
- sq. feet
|
- baths - beds |
show details | |

|
#26
Huntersridge Rd
Huntersville, NC 28078
|
- sq. feet
|
- baths - beds |
show details | |

|
#27
Maywine Cir
Huntersville, NC 28078
|
- sq. feet
|
- baths - beds |
show details | |

|
#28
Estates Dr
Huntersville, NC 28078
|
- sq. feet
|
- baths - beds |
show details | |

|
#29
Gilead Rd Unit 1591
Huntersville, NC 28070
|
- sq. feet
|
- baths - beds |
show details | |

|
#30
Street
Huntersville, NC 28078
|
- sq. feet
|
- baths - beds |
show details |
| Photo | Address | Area | Beds / Baths | Price | Details |
|---|---|---|---|---|---|

|
#31
Tribute Place Dr Apt 201
Huntersville, NC 28078
|
- sq. feet
|
- baths - beds |
show details | |

|
#32
Sam Furr Rd Ste J313
Huntersville, NC 28078
|
- sq. feet
|
- baths - beds |
show details | |

|
#33
Prosperity Church Rd, Apt 147
Huntersville, NC 28078
|
- sq. feet
|
- baths - beds |
show details | |

|
#34
Cherry Mill Ct
Huntersville, NC 28078
|
- sq. feet
|
- baths - beds |
show details | |

|
#35
Bryton Gap Blvd, Apt 18307
Huntersville, NC 28078
|
- sq. feet
|
- baths - beds |
show details | |

|
#36
Huntersville Cmns Dr Apt K
Huntersville, NC 28078
|
- sq. feet
|
- baths - beds |
show details | |

|
Check over 1 million property listings on Foreclosure.com!
|
browse all offers | |||

Latest news about housing in Huntersville, NC collected exclusively by city-data.com from local newspapers, TV, and radio stations

 | Rental Homes in Mooresville/Huntersville (6 replies) |
| Camden Sedgebrook Apartments Huntersville (4 replies) |
| Huntersville Apartments (3 replies) |
| Are homes with garage apartments unusual in the Charlotte area? (16 replies) |
| What am I missing? Homes on market a long time. (29 replies) |
| Apartments to Rent Near 28269-URGENT (5 replies) |
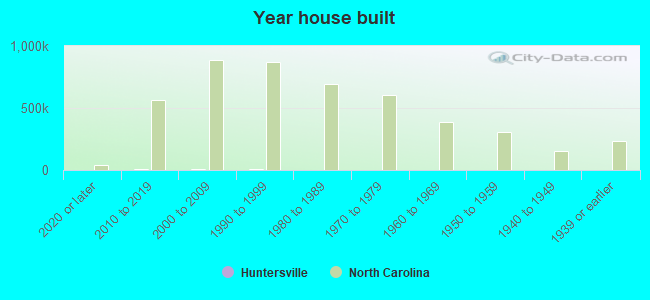
Median year apartment built: 2009
Household type by relationship:
Households: 62,847- Male householders: 12,127 (2,132 living alone), Female householders: 11,464 (2,951 living alone)
13,556 spouses (13,409 opposite-sex spouses), 1,197 unmarried partners, (1,102 opposite-sex unmarried partners), 20,292 children (19,189 natural, 655 adopted, 447 stepchildren), 525 grandchildren, 508 brothers or sisters, 989 parents, 0 foster children, 480 other relatives, 1,383 non-relatives
- In group quarters: 321
Size of family households: 6,725 2-persons, 4,933 3-persons, 3,358 4-persons, 1,362 5-persons, 301 6-persons, 164 7-or-more-persons.
Size of nonfamily households: 5,518 1-person, 1,300 2-persons, 145 3-persons, 17 4-persons.
12,027 married couples with children.
2,827 single-parent households (812 men, 2,015 women).
89.8% of residents of Huntersville speak English at home.
5.1% of residents speak Spanish at home (68% speak English very well, 18% speak English well, 13% speak English not well, 1% don't speak English at all).
2.4% of residents speak other Indo-European language at home (91% speak English very well, 8% speak English well, 2% speak English not well).
2.2% of residents speak Asian or Pacific Island language at home (33% speak English very well, 15% speak English well, 22% speak English not well, 30% don't speak English at all).
0.8% of residents speak other language at home (95% speak English very well, 5% speak English well).
Foreign born population: 5,798 (9.2%)
(56.4% of them are naturalized citizens)
| Here: | 7.8 |
| State: | 6.4 |
| Here: | 4.3 |
| State: | 4.4 |
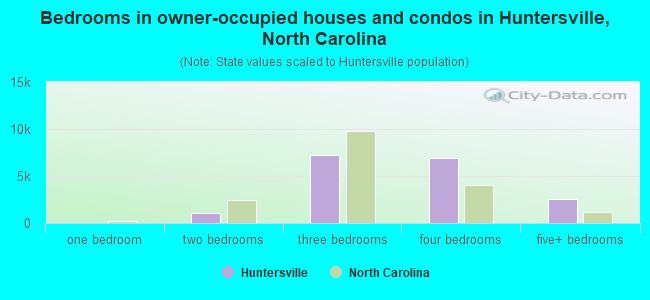
- Bedrooms in owner-occupied houses and condos in Huntersville, North Carolina
- 29no bedroom
- 01 bedroom
- 1,0782 bedrooms
- 7,1993 bedrooms
- 6,9244 bedrooms
- 2,5425+ bedrooms
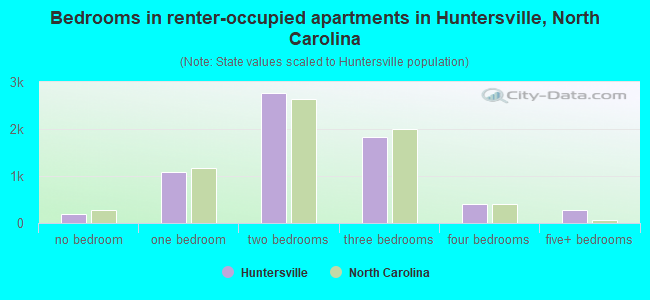
- Bedrooms in renter-occupied apartments in Huntersville, North Carolina
- 189no bedroom
- 1,0841 bedroom
- 2,7672 bedrooms
- 1,8213 bedrooms
- 3974 bedrooms
- 2745+ bedrooms
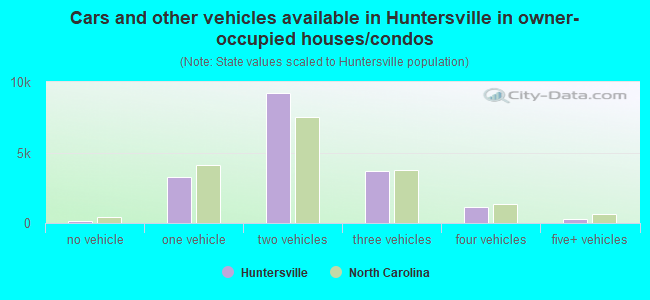
- Cars and other vehicles available in Huntersville in owner-occupied houses/condos
- 162no vehicle
- 3,2661 vehicle
- 9,2332 vehicles
- 3,6753 vehicles
- 1,1574 vehicles
- 2785+ vehicles
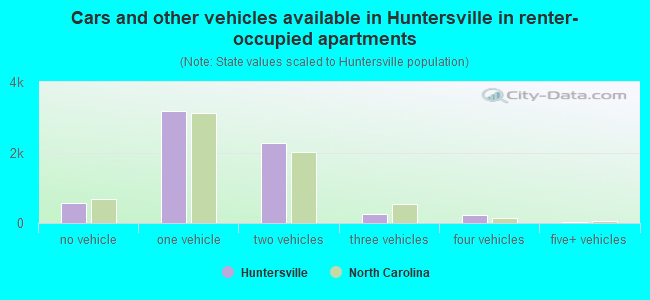
- Cars and other vehicles available in Huntersville in renter-occupied apartments
- 575no vehicle
- 3,1811 vehicle
- 2,2722 vehicles
- 2503 vehicles
- 2234 vehicles
- 315+ vehicles
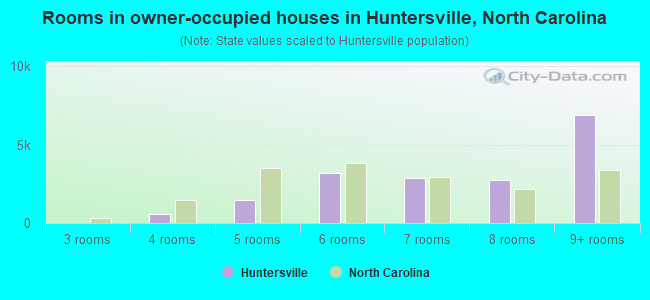
- Rooms in owner-occupied houses in Huntersville, North Carolina
- 151 room
- 142 rooms
- 143 rooms
- 5694 rooms
- 1,4775 rooms
- 3,1966 rooms
- 2,8487 rooms
- 2,7578 rooms
- 6,8829+ rooms
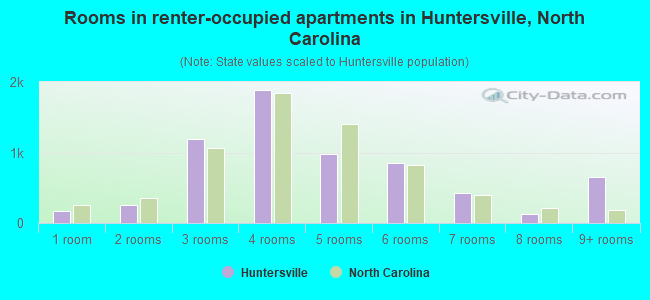
- Rooms in renter-occupied apartments in Huntersville, North Carolina
- 1721 room
- 2612 rooms
- 1,1903 rooms
- 1,8834 rooms
- 9815 rooms
- 8496 rooms
- 4237 rooms
- 1248 rooms
- 6489+ rooms
Huntersville, NC household income distribution

- 606Less than $10,000
- 525$10,000 to $19,999
- 739$20,000 to $29,999
- 1,011$30,000 to $39,999
- 1,311$40,000 to $49,999
- 1,105$50,000 to $59,999
- 2,050$60,000 to $74,999
- 2,997$75,000 to $99,999
- 3,031$100,000 to $124,999
- 1,981$125,000 to $149,999
- 3,405$150,000 to $199,999
- 5,789$200,000 or more

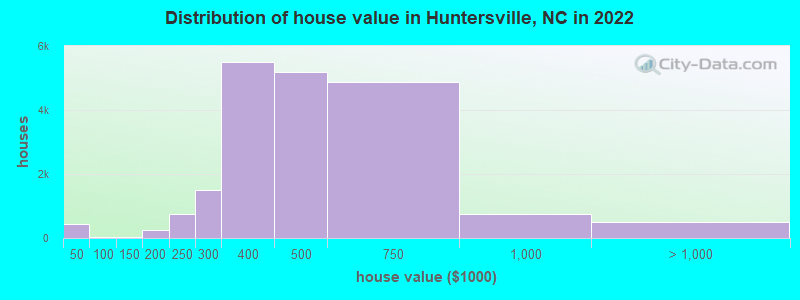
Home value of owner - occupied houses in 2022 in Huntersville, NC
-
- 104Less than $10,000
- 4$10,000 to $14,999
- 14$15,000 to $19,999
- 115$20,000 to $24,999
- 30$25,000 to $29,999
- 5$30,000 to $34,999
- 164$35,000 to $39,999
- 12$50,000 to $59,999
- 19$60,000 to $69,999
- 4$80,000 to $89,999
- 2$90,000 to $99,999
- 30$100,000 to $124,999
- 9$125,000 to $149,999
- 141$150,000 to $174,999
- 114$175,000 to $199,999
- 753$200,000 to $249,999
- 1,504$250,000 to $299,999
- 5,510$300,000 to $399,999
- 5,184$400,000 to $499,999
- 4,886$500,000 to $749,999
- 743$750,000 to $999,999
- 269$1,000,000 to $1,499,999
- 61$1,500,000 to $1,999,999
- 160$2,000,000 or more
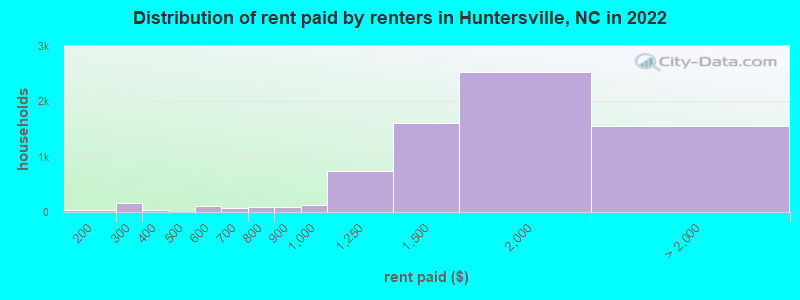
Rent paid by renters in 2022 in Huntersville, NC
-
- 8Less than $100
- 32$100 to $149
- 9$150 to $199
- 168$200 to $249
- 28$300 to $349
- 4$450 to $499
- 100$550 to $599
- 34$600 to $649
- 32$650 to $699
- 66$700 to $749
- 22$750 to $799
- 96$800 to $899
- 131$900 to $999
- 743$1,000 to $1,249
- 1,612$1,250 to $1,499
- 2,526$1,500 to $1,999
- 1,037$2,000 to $2,499
- 53$2,500 to $2,999
- 40$3,000 to $3,499
- 428No cash rent
Percentage of workers working in this county: 85.7%
Number of people working at home: 11,151 (32.7% of all workers)
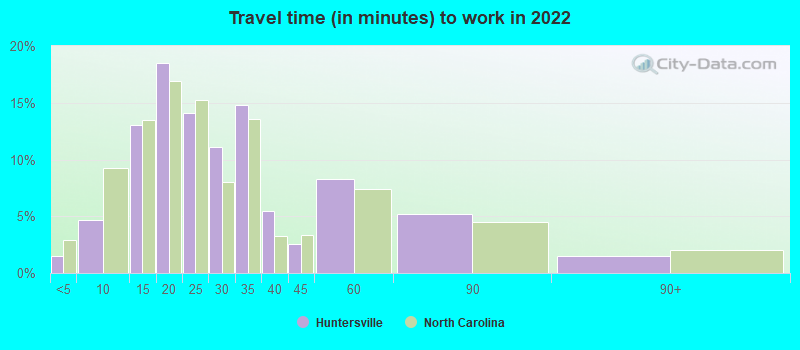
Travel time to work (commute)
- Less than 5 minutes: 324
- 5 to 9 minutes: 1,194
- 10 to 14 minutes: 2,597
- 15 to 19 minutes: 3,468
- 20 to 24 minutes: 3,326
- 25 to 29 minutes: 2,595
- 30 to 34 minutes: 4,100
- 35 to 39 minutes: 1,182
- 40 to 44 minutes: 1,039
- 45 to 59 minutes: 2,018
- 60 to 89 minutes: 950
- 90 or more minutes: 309
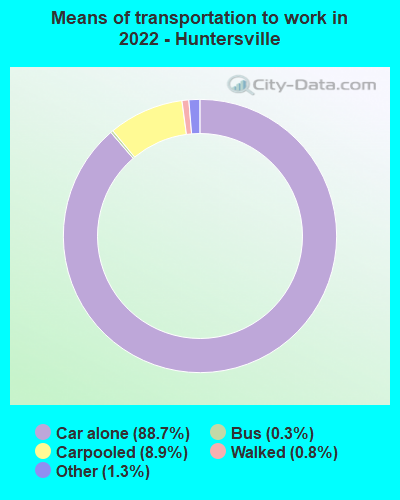
Means of transportation to work:
- Drove a car alone: 18,135 (59.9%)
- Carpooled: 1,949 (6.4%)
- Bus: 43 (0.1%)
- Taxi: 240 (0.8%)
- Walked: 170 (0.6%)
- Worked at home: 11,151 (36.8%)
- Unemployment by race in 2022
- Unemployment rate for White non-Hispanic residents
- 2.8%Males
- 2.2%Females
- Unemployment rate for Black residents
- 4.7%Males
- 3.3%Females
- Unemployment rate for American Indian and Alaska Native residents
- 17.0%Females
- Unemployment rate for other race residents
- 3.0%Males
- 2.7%Females
- Unemployment rate for two or more race residents
- 1.3%Males
- 5.7%Females
- Unemployment rate for Hispanic or Latino residents
- 0.9%Males
- 1.9%Females
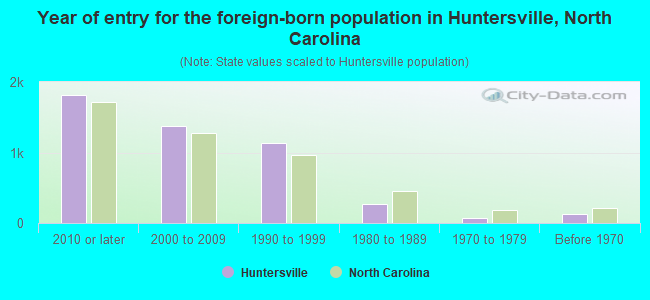
- Year of entry for the foreign-born population in Huntersville, North Carolina
- 1,8212010 or later
- 1,3772000 to 2009
- 1,1411990 to 1999
- 2671980 to 1989
- 771970 to 1979
- 122Before 1970
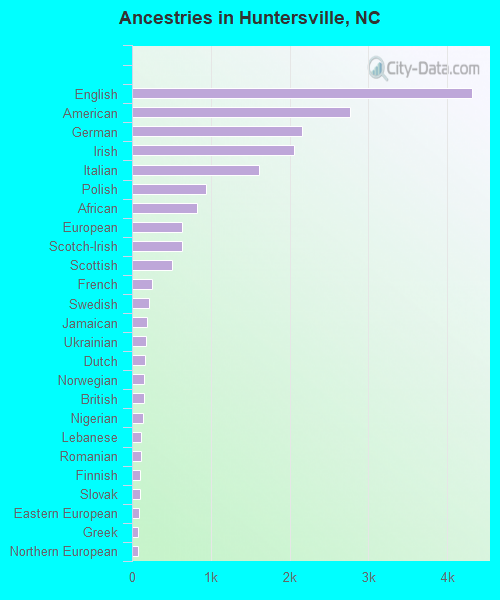
First ancestries reported:
- English: 4,314 (13.9%)
- American: 2,769 (8.9%)
- German: 2,155 (7.0%)
- Irish: 2,050 (6.6%)
- Italian: 1,615 (5.2%)
- Polish: 943 (3.0%)
- African: 828 (2.7%)
- European: 632 (2.0%)
- Scotch-Irish: 629 (2.0%)
- Scottish: 503 (1.6%)
- French: 256 (0.8%)
- Swedish: 219 (0.7%)
- Jamaican: 196 (0.6%)
- Ukrainian: 172 (0.6%)
- Dutch: 167 (0.5%)
- Norwegian: 157 (0.5%)
- British: 150 (0.5%)
- Nigerian: 138 (0.4%)
- Lebanese: 120 (0.4%)
- Romanian: 112 (0.4%)
- Finnish: 104 (0.3%)
- Slovak: 100 (0.3%)
- Eastern European: 86 (0.3%)
- Greek: 78 (0.3%)
- Northern European: 72 (0.2%)
- Canadian: 66 (0.2%)
- Czech: 65 (0.2%)
- Russian: 57 (0.2%)
- Portuguese: 57 (0.2%)
- Scandinavian: 53 (0.2%)
- Welsh: 45 (0.1%)
- Bulgarian: 42 (0.1%)
- Turkish: 41 (0.1%)
- Hungarian: 37 (0.1%)
- Austrian: 33 (0.1%)
- Brazilian: 33 (0.1%)
- Slovene: 28 (0.09%)
- French Canadian: 27 (0.09%)
- Palestinian: 25 (0.08%)
- Guyanese: 22 (0.07%)
- Estonian: 20 (0.06%)
- Macedonian: 19 (0.06%)
- Haitian: 19 (0.06%)
- Armenian: 14 (0.05%)
- British West Indian: 10 (0.03%)
- Trinidadian and Tobagonian: 8 (0.03%)
- West Indian: 8 (0.03%)
- Jordanian: 7 (0.02%)
- Lithuanian: 5 (0.02%)
- Danish: 5 (0.02%)
Most common places of birth for foreign-born residents (%):
| Huntersville: | 12.7% (773) |
| North Carolina: | 9.3% (80,594) |
| Huntersville: | 8.4% (512) |
| North Carolina: | 1.8% (15,988) |
| Huntersville: | 7.2% (438) |
| North Carolina: | 24.7% (214,776) |
| Huntersville: | 6.2% (379) |
| North Carolina: | 2.1% (18,275) |
| Huntersville: | 5.5% (332) |
| North Carolina: | 2.1% (18,105) |
| Huntersville: | 3.9% (234) |
| North Carolina: | 3.2% (27,477) |
| Huntersville: | 3.6% (218) |
| North Carolina: | 0.2% (1,323) |
| Huntersville: | 3.6% (216) |
| North Carolina: | 1.2% (9,986) |
| Huntersville: | 3.0% (181) |
| North Carolina: | 1.3% (11,419) |
| Huntersville: | 2.3% (140) |
| North Carolina: | 1.1% (9,173) |
| Huntersville: | 2.3% (139) |
| North Carolina: | 4.7% (40,707) |
| Huntersville: | 2.3% (137) |
| North Carolina: | 1.1% (9,831) |
| Huntersville: | 2.2% (132) |
| North Carolina: | 2.4% (20,695) |
| Huntersville: | 2.1% (129) |
| North Carolina: | 1.8% (15,534) |
| Huntersville: | 2.1% (129) |
| North Carolina: | 0.3% (2,465) |
| Huntersville: | 1.9% (116) |
| North Carolina: | 0.7% (6,161) |
| Huntersville: | 1.7% (105) |
| North Carolina: | 0.4% (3,093) |
| Huntersville: | 1.7% (103) |
| North Carolina: | 0.2% (1,544) |
| Huntersville: | 1.6% (98) |
| North Carolina: | 0.1% (1,162) |
Place of birth for U.S.-born residents:
- This state: 21,582
- Other state: 35,326
- Northeast: 12,385
- Midwest: 8,038
- South: 11,789
- West: 3,043
86.1% of Huntersville residents lived in the same house 1 years ago.
Out of people who lived in different houses, 28.8% lived in this county.
Out of people who lived in different counties, 38.3% lived in North Carolina.
| Huntersville: | 86.1% |
| State average: | 87.3% |
Education attainment for males 25 years and older:
- No schooling: 147
- Nursery to 4th grade: 0
- 5th and 6th grade: 28
- 7th and 8th grade: 75
- 9th grade: 91
- 10th grade: 47
- 11th grade: 78
- 12th grade, no diploma: 158
- High school graduate (or equivalency): 3,302
- Less than 1 year of college: 1,143
- Some college more than 1 year, no degree: 2,434
- Associate degree: 1,823
- Bachelor's degree: 8,286
- Master's degree: 3,324
- Professional school degree: 476
- Doctorate degree: 282

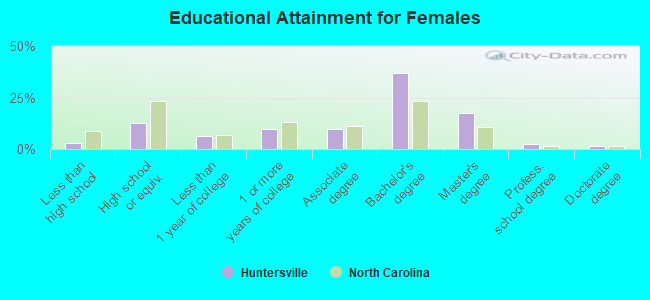
Education attainment for females 25 years and older:
- No schooling: 259
- Nursery to 4th grade: 1
- 5th and 6th grade: 21
- 7th and 8th grade: 20
- 9th grade: 27
- 10th grade: 65
- 11th grade: 130
- 12th grade, no diploma: 121
- High school graduate (or equivalency): 2,802
- Less than 1 year of college: 1,350
- Some college more than 1 year, no degree: 2,203
- Associate degree: 2,169
- Bachelor's degree: 8,222
- Master's degree: 3,898
- Professional school degree: 589
- Doctorate degree: 353
Housing units in structures:
- One, detached: 19,047
- One, attached: 1,327
- Two: 126
- 3 or 4: 403
- 5 to 9: 982
- 10 to 19: 754
- 20 to 49: 1,325
- 50 or more: 865
- Mobile homes: 340
Housing units lacking complete kitchen facilities in 2022: 0.4%
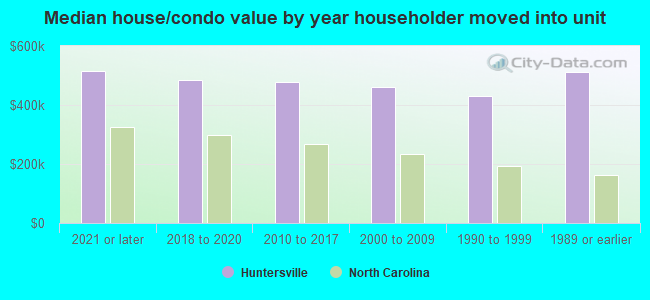
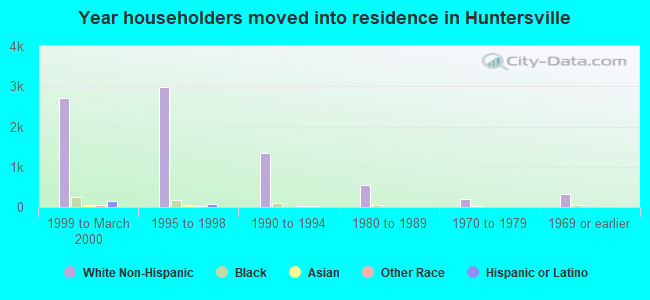
House/condo owner moved in on average 7 years ago
Renter moved in on average 3 years ago
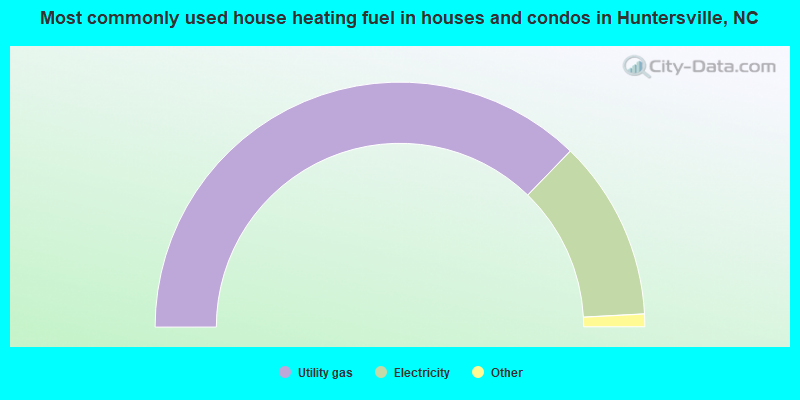
- 74.5%Utility gas
- 23.8%Electricity
- 1.1%Bottled, tank, or LP gas
- 0.3%Fuel oil, kerosene, etc.
- 0.1%Wood

- 73.7%Electricity
- 25.4%Utility gas
- 0.5%No fuel used
- 0.3%Other fuel
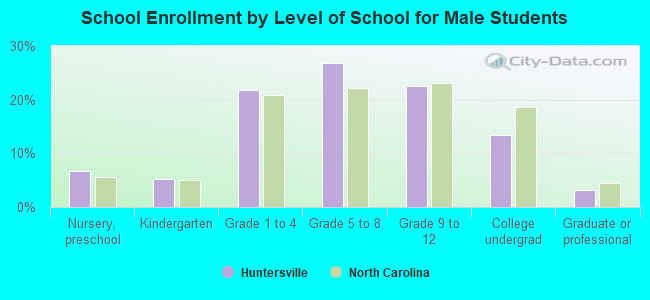
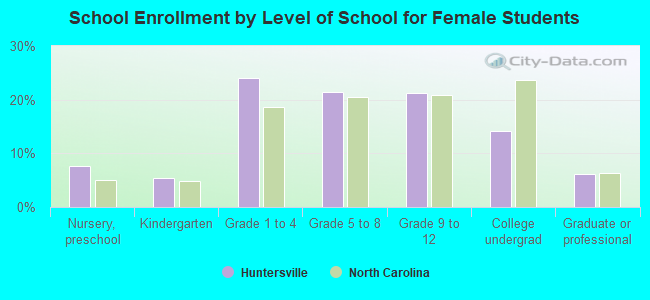
Private vs. public school enrollment:
| Here: | 13.7% |
| North Carolina: | 13.8% |
| Here: | 15.1% |
| North Carolina: | 11.9% |
| Here: | 11.9% |
| North Carolina: | 19.3% |