Hoboken, NJ (New Jersey) Houses and Residents
Estimated median house or condo value in 2022: $928,658 (it was $249,300 in 2000 )
Hoboken:
$928,658New Jersey:
$428,900
Lower value quartile - upper value quartile: $687,338 - $1,143,345Mean price in 2022: Detached houses: $1,254,016 Here:
$1,254,016State:
$537,591
Townhouses or other attached units: $1,610,677 Here:
$1,610,677State:
$381,113
In 2-unit structures: $1,570,802 Here:
$1,570,802State:
$444,476
In 3-to-4-unit structures: $943,805 Here:
$943,805State:
$457,463
In 5-or-more-unit structures: $871,708 Here:
$871,708State:
$368,745
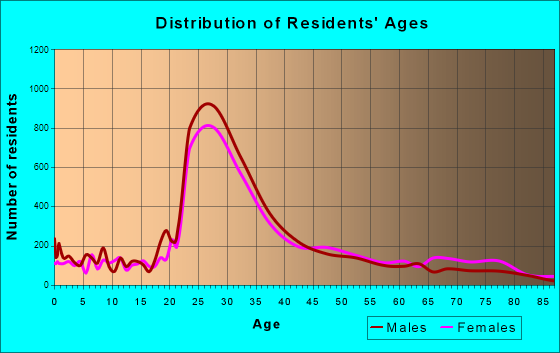
Total population: 53,312 (Urban population: 38,669, Rural population: 0)
Houses: 30,951 (28,562 occupied: 10,067 owner occupied, 19,202 renter occupied )
% of renters here:
66%State:
35%
Housing density: 24,261 houses/condos per square mile
Median price asked for vacant for-sale houses and condos in 2022: $1,300,445.
Median contract rent in 2022: over $2,000 (lower quartile is $1,547, upper quartile is over $2,000)
Median rent asked for vacant for-rent units in 2022: $2,628
Median gross rent in Hoboken, NJ in 2022: over $2,000
Housing units in Hoboken with a mortgage: 7,788 (708 second mortgage, 0 home equity loan, 735 both second mortgage and home equity loan )Houses without a mortgage: 33
Median household income for houses/condos with a mortgage: $246,024
Median household income for apartments without a mortgage: $127,059
Median monthly housing costs: $2,917
Data:
Median house or condo value ($)
Median house or condo value ($ change since 2000)
Median house or condo value ($) - White
Median house or condo value ($) - Black or African American
Median house or condo value ($) - Asian
Median house or condo value ($) - Hispanic or Latino
Median house or condo value ($) - American Indian and Alaska Native
Median house or condo value ($) - Multirace
Median house or condo value ($) - Other Race
Median price asked for mobile homes ($)
Household density (households per square mile)
Mean house or condo value by units in structure - 1, detached ($)
Mean house or condo value by units in structure - 1, attached ($)
Mean house or condo value by units in structure - 2 ($)
Mean house or condo value by units in structure by units in structure - 3 or 4 ($)
Mean house or condo value by units in structure - 5 or more ($)
Mean house or condo value by units in structure - Boat, RV, van, etc. ($)
Mean house or condo value by units in structure - Mobile home ($)
Median contract rent ($)
Median contract rent - Lower quartile ($)
Median contract rent - Upper quartile ($)
Median gross rent ($)
Urban houses (%)
Rural houses (%)
Houses occupied (%)
Houses occupied (% change since 2000)
Houses owner occupied (%)
Houses owner occupied (% change since 2000)
Houses renter occupied (%)
Houses renter occupied (% change since 2000)
Vacant housing units - For rent (%)
Vacant housing units - For rent (% change since 2000)
Vacant housing units - For sale only (%)
Vacant housing units - For sale only (% change since 2000)
Vacant housing units - Rented or sold, not occupied (%)
Vacant housing units - Rented or sold, not occupied (% change since 2000)
Vacant housing units - For seasonal, recreational, or occasional use (%)
Vacant housing units - For seasonal, recreational, or occasional use (% change since 2000)
Vacant housing units - For migrant workers (%)
Vacant housing units - For migrant workers (% change since 2000)
Vacant housing units - Other vacant (%)
Vacant housing units - Other vacant (% change since 2000)
Median monthly housing costs ($)
Median household income for houses/condos with a mortgage ($)
Median household income for houses/condos without a mortgage ($)
Median household income ($)
Median household income ($) - White
Median household income ($) - Black or African American
Median household income ($) - Asian
Median household income ($) - Hispanic or Latino
Median household income ($) - American Indian and Alaska Native
Median household income ($) - Multirace
Median household income ($) - Other Race
Mortgage status - with mortgage (%)
Mortgage status - with second mortgage (%)
Mortgage status - with home equity loan (%)
Mortgage status - with both second mortgage and home equity loan (%)
Mortgage status - without a mortgage (%)
Median year house/condo built
Median year apartment built
Household type by relationship - Male householder living alone (%)
Household type by relationship - Male householder not living alone (%)
Household type by relationship - Female householder living alone (%)
Household type by relationship - Female householder not living alone (%)
Household type by relationship - Opposite-Sex spouse (%)
Household type by relationship - Same-Sex spouse (%)
Household type by relationship - Opposite-Sex unmarried partner (%)
Household type by relationship - Same-Sex unmarried partner (%)
Household type by relationship - In group quarters (%)
Size of family households - 2-person household (%)
Size of family households - 3-person household (%)
Size of family households - 4-person household (%)
Size of family households - 5-person household (%)
Size of family households - 6-person household (%)
Size of family households - 7-or-more-person household (%)
Size of nonfamily households - 1-person household (%)
Size of nonfamily households - 2-person household (%)
Size of nonfamily households - 3-person household (%)
Size of nonfamily households - 4-person household (%)
Size of nonfamily households - 5-person household (%)
Size of nonfamily households - 6-person household (%)
Size of nonfamily households - 7-or-moreperson household (%)
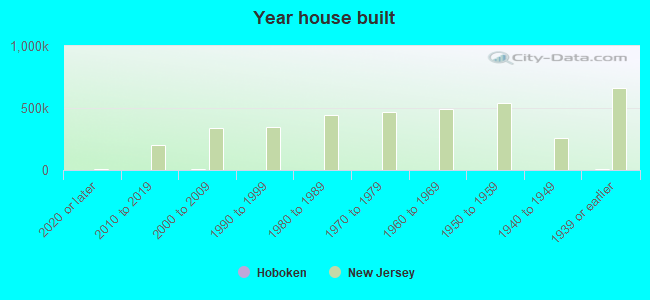
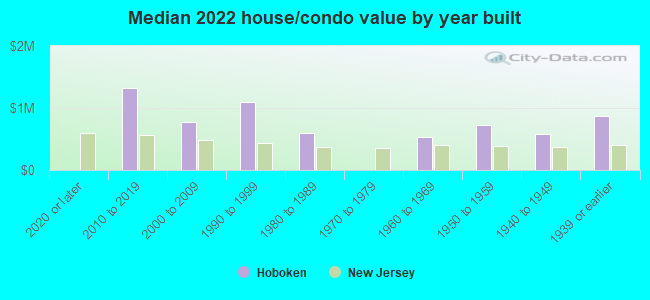
Year house built - Built 2010 or later (%)
Year house built - Built 2000 to 2009 (%)
Year house built - Built 1990 to 1999 (%)
Year house built - Built 1980 to 1989 (%)
Year house built - Built 1970 to 1979 (%)
Year house built - Built 1960 to 1969 (%)
Year house built - Built 1950 to 1959 (%)
Year house built - Built 1940 to 1949 (%)
Year house built - Built 1939 or earlier (%)
Median number of rooms in houses and condos
Median number of rooms in apartments
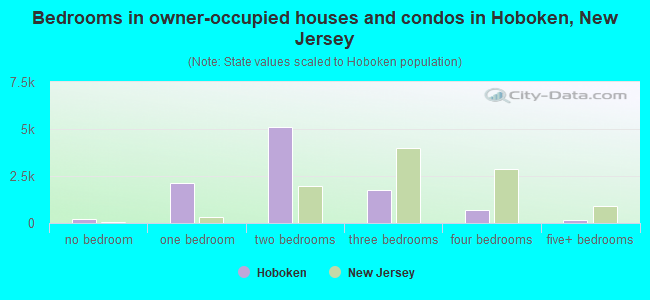
Median number of bedrooms in owner occupied houses
Mean number of bedrooms in owner occupied houses
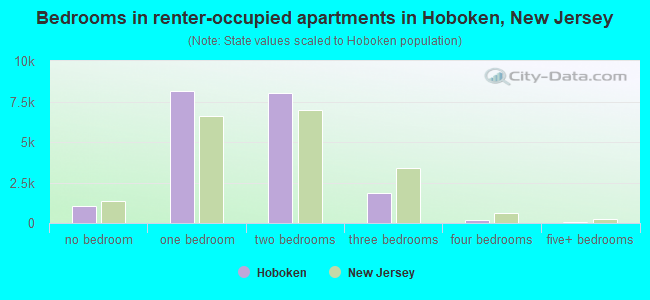
Median number of bedrooms in renter occupied houses
Mean number of bedrooms in renter occupied houses
Median number of vehichles in owner occupied houses
Mean number of vehichles in owner occupied houses
Median number of vehichles in renter occupied houses
Mean number of vehichles in renter occupied houses
Rooms in owner-occupied houses - 1 room (%)
Rooms in owner-occupied houses - 2 rooms (%)
Rooms in owner-occupied houses - 3 rooms (%)
Rooms in owner-occupied houses - 4 rooms (%)
Rooms in owner-occupied houses - 5 rooms (%)
Rooms in owner-occupied houses - 6 rooms (%)
Rooms in owner-occupied houses - 7 rooms (%)
Rooms in owner-occupied houses - 8 rooms (%)
Rooms in owner-occupied houses - 9+ rooms (%)
Rooms in renter-occupied houses - 1 room (%)
Rooms in renter-occupied houses - 2 rooms (%)
Rooms in renter-occupied houses - 3 rooms (%)
Rooms in renter-occupied houses - 4 rooms (%)
Rooms in renter-occupied houses - 5 rooms (%)
Rooms in renter-occupied houses - 6 rooms (%)
Rooms in renter-occupied houses - 7 rooms (%)
Rooms in renter-occupied houses - 8 rooms (%)
Rooms in renter-occupied houses - 9+ rooms (%)
Bedrooms in owner-occupied houses - no bedrooms (%)
Bedrooms in owner-occupied houses - 1 bedroom (%)
Bedrooms in owner-occupied houses - 2 bedrooms (%)
Bedrooms in owner-occupied houses - 3 bedrooms (%)
Bedrooms in owner-occupied houses - 4 bedrooms (%)
Bedrooms in owner-occupied houses - 5+ bedrooms (%)
Bedrooms in renter-occupied houses - no bedrooms (%)
Bedrooms in renter-occupied houses - 1 bedroom (%)
Bedrooms in renter-occupied houses - 2 bedrooms (%)
Bedrooms in renter-occupied houses - 3 bedrooms (%)
Bedrooms in renter-occupied houses - 4 bedrooms (%)
Bedrooms in renter-occupied houses - 5+ bedrooms (%)
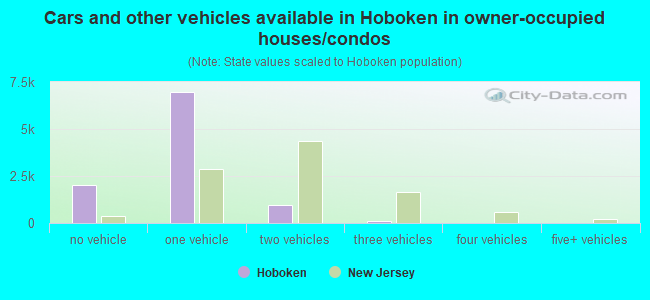
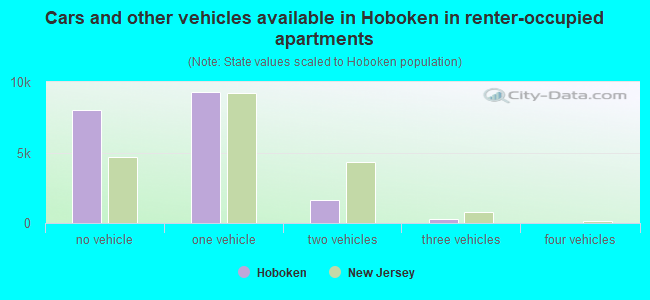
Vehicles available in owner-occupied houses - no vehicle available (%)
Vehicles available in owner-occupied houses - 1 vehicle available(%)
Vehicles available in owner-occupied houses - 2 Vehicles available (%)
Vehicles available in owner-occupied houses - 3 Vehicles available (%)
Vehicles available in owner-occupied houses - 4 Vehicles available (%)
Vehicles available in owner-occupied houses - 5+ Vehicles available (%)
Vehicles available in renter-occupied houses - no vehicle available (%)
Vehicles available in renter-occupied houses - 1 vehicle available (%)
Vehicles available in renter-occupied houses - 2 Vehicles available (%)
Vehicles available in renter-occupied houses - 3 Vehicles available (%)
Vehicles available in renter-occupied houses - 4 Vehicles available (%)
Vehicles available in renter-occupied houses - 5+ Vehicles available (%)
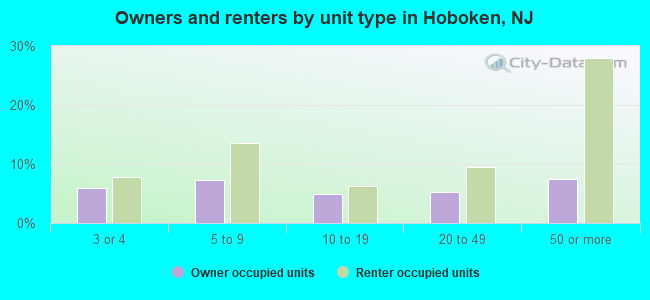
Housing units in structures - 1, detached (%)
Housing units in structures - 1, attached (%)
Housing units in structures - 2 (%)
Housing units in structures - 3 or 4 (%)
Housing units in structures - 5 to 9 (%)
Housing units in structures - 10 to 19 (%)
Housing units in structures - 20 to 49 (%)
Housing units in structures - 50 or more (%)
Housing units in structures - Mobile home (%)
Housing units in structures - Boat, RV, van, etc. (%)
Housing units in structures - Owners - 1, detached (%)
Housing units in structures - Owners - 1, attached (%)
Housing units in structures - Owners - 2 (%)
Housing units in structures - Owners - 3 or 4 (%)
Housing units in structures - Owners - 5 to 9 (%)
Housing units in structures - Owners - 10 to 19 (%)
Housing units in structures - Owners - 20 to 49 (%)
Housing units in structures - Owners - 50 or more (%)
Housing units in structures - Owners - Mobile home (%)
Housing units in structures - Owners - Boat, RV, van, etc. (%)
Housing units in structures - Renters - 1, detached (%)
Housing units in structures - Renters - 1, attached (%)
Housing units in structures - Renters - 2 (%)
Housing units in structures - Renters - 3 or 4 (%)
Housing units in structures - Renters - 5 to 9 (%)
Housing units in structures - Renters - 10 to 19 (%)
Housing units in structures - Renters - 20 to 49 (%)
Housing units in structures - Renters - 50 or more (%)
Housing units in structures - Renters - Mobile home (%)
Housing units in structures - Renters - Boat, RV, van, etc. (%)
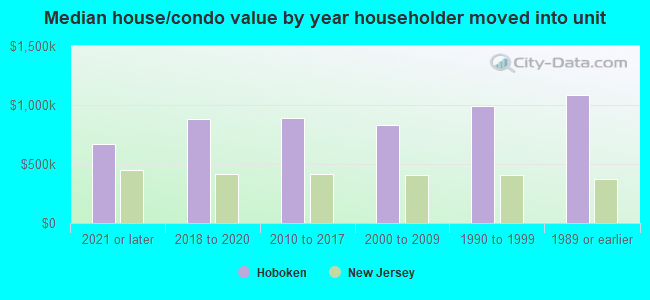
House/condo owner moved in on average (years ago)
Renter moved in on average (years ago)
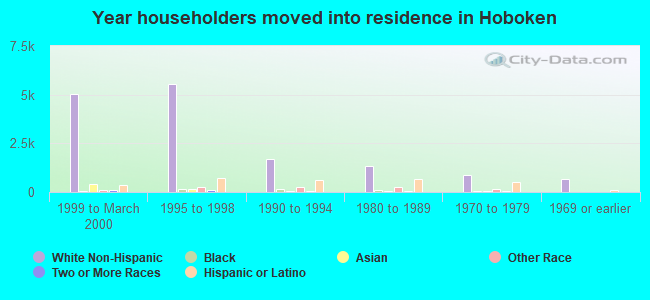
Year householder moved into unit - Moved in 1999 to March 2000 (%)
Year householder moved into unit - Moved in 1999 to March 2000 (%) - White
Year householder moved into unit - Moved in 1999 to March 2000 (%) - Black or African American
Year householder moved into unit - Moved in 1999 to March 2000 (%) - Asian
Year householder moved into unit - Moved in 1999 to March 2000 (%) - Hispanic or Latino
Year householder moved into unit - Moved in 1999 to March 2000 (%) - American Indian and Alaska Native
Year householder moved into unit - Moved in 1999 to March 2000 (%) - Multirace
Year householder moved into unit - Moved in 1999 to March 2000 (%) - Other Race
Year householder moved into unit - Moved in 1995 to 1998 (%)
Year householder moved into unit - Moved in 1995 to 1998 (%) - White
Year householder moved into unit - Moved in 1995 to 1998 (%) - Black or African American
Year householder moved into unit - Moved in 1995 to 1998 (%) - Asian
Year householder moved into unit - Moved in 1995 to 1998 (%) - Hispanic or Latino
Year householder moved into unit - Moved in 1995 to 1998 (%) - American Indian and Alaska Native
Year householder moved into unit - Moved in 1995 to 1998 (%) - Multirace
Year householder moved into unit - Moved in 1995 to 1998 (%) - Other Race
Year householder moved into unit - Moved in 1990 to 1994 (%)
Year householder moved into unit - Moved in 1990 to 1994 (%) - White
Year householder moved into unit - Moved in 1990 to 1994 (%) - Black or African American
Year householder moved into unit - Moved in 1990 to 1994 (%) - Asian
Year householder moved into unit - Moved in 1990 to 1994 (%) - Hispanic or Latino
Year householder moved into unit - Moved in 1990 to 1994 (%) - American Indian and Alaska Native
Year householder moved into unit - Moved in 1990 to 1994 (%) - Multirace
Year householder moved into unit - Moved in 1990 to 1994 (%) - Other Race
Year householder moved into unit - Moved in 1980 to 1989 (%)
Year householder moved into unit - Moved in 1980 to 1989 (%) - White
Year householder moved into unit - Moved in 1980 to 1989 (%) - Black or African American
Year householder moved into unit - Moved in 1980 to 1989 (%) - Asian
Year householder moved into unit - Moved in 1980 to 1989 (%) - Hispanic or Latino
Year householder moved into unit - Moved in 1980 to 1989 (%) - American Indian and Alaska Native
Year householder moved into unit - Moved in 1980 to 1989 (%) - Multirace
Year householder moved into unit - Moved in 1980 to 1989 (%) - Other Race
Year householder moved into unit - Moved in 1970 to 1979 (%)
Year householder moved into unit - Moved in 1970 to 1979 (%) - White
Year householder moved into unit - Moved in 1970 to 1979 (%) - Black or African American
Year householder moved into unit - Moved in 1970 to 1979 (%) - Asian
Year householder moved into unit - Moved in 1970 to 1979 (%) - Hispanic or Latino
Year householder moved into unit - Moved in 1970 to 1979 (%) - American Indian and Alaska Native
Year householder moved into unit - Moved in 1970 to 1979 (%) - Multirace
Year householder moved into unit - Moved in 1970 to 1979 (%) - Other Race
Year householder moved into unit - Moved in 1969 or earlier (%)
Year householder moved into unit - Moved in 1969 or earlier (%) - White
Year householder moved into unit - Moved in 1969 or earlier (%) - Black or African American
Year householder moved into unit - Moved in 1969 or earlier (%) - Asian
Year householder moved into unit - Moved in 1969 or earlier (%) - Hispanic or Latino
Year householder moved into unit - Moved in 1969 or earlier (%) - American Indian and Alaska Native
Year householder moved into unit - Moved in 1969 or earlier (%) - Multirace
Year householder moved into unit - Moved in 1969 or earlier (%) - Other Race
Housing units lacking complete plumbing facilities (%)
Housing units lacking complete kitchen facilities (%)
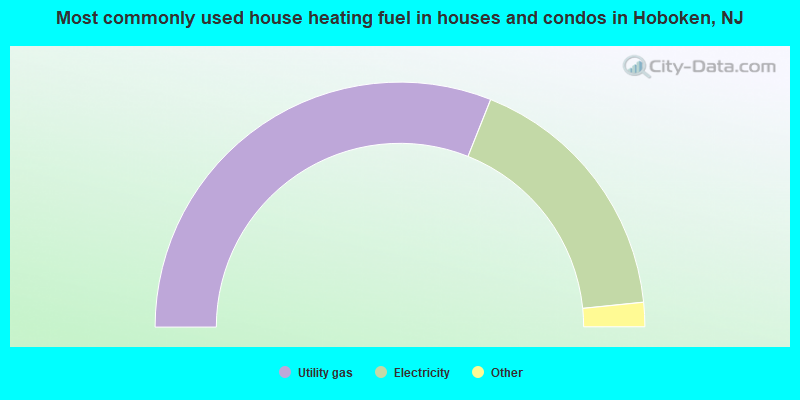
House heating fuel used in houses and condos - Utility gas (%)
House heating fuel used in houses and condos - Bottled, tank, or LP gas (%)
House heating fuel used in houses and condos - Electricity (%)
House heating fuel used in houses and condos - Fuel oil, kerosene, etc. (%)
House heating fuel used in houses and condos - Coal or coke (%)
House heating fuel used in houses and condos - Wood (%)
House heating fuel used in houses and condos - Solar energy (%)
House heating fuel used in houses and condos - Other fuel (%)
House heating fuel used in houses and condos - No fuel used (%)
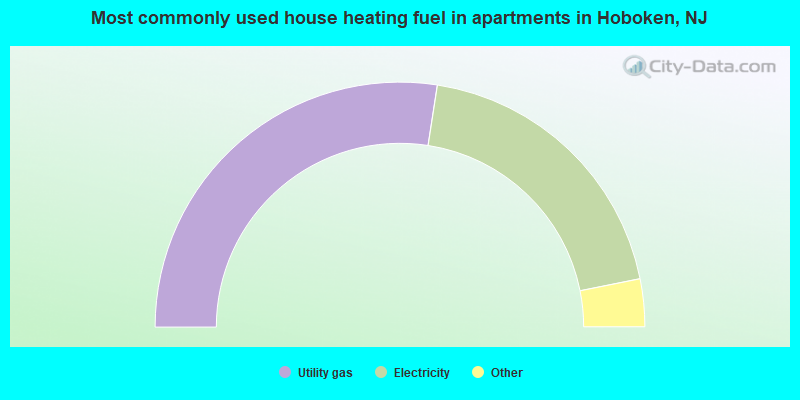
House heating fuel used in apartments - Utility gas (%)
House heating fuel used in apartments - Bottled, tank, or LP gas (%)
House heating fuel used in apartments - Electricity (%)
House heating fuel used in apartments - Fuel oil, kerosene, etc. (%)
House heating fuel used in apartments - Coal or coke (%)
House heating fuel used in apartments - Wood (%)
House heating fuel used in apartments - Solar energy (%)
House heating fuel used in apartments - Other fuel (%)
House heating fuel used in apartments - No fuel used (%)
Latest news about housing in Hoboken, NJ collected exclusively by city-data.com from local newspapers, TV, and radio stations
Median year house/condo built: 1978Median year apartment built: 1973Household type by relationship:
Households: 58,039
Male householders: 14,164 (4,299 living alone ), Female householders: 13,375 (4,682 living alone )9,796 spouses (9,574 opposite-sex spouses ), 3,395 unmarried partners , (3,274 opposite-sex unmarried partners ), 10,062 children (9,747 natural , 107 adopted , 206 stepchildren ), 21 grandchildren , 279 brothers or sisters , 126 parents , 0 foster children , 161 other relatives , 4,890 non-relatives In group quarters: 1,766
Size of family households: 6,527 2-persons , 3,317 3-persons , 1,827 4-persons , 303 5-persons , 80 6-persons , 15 7-or-more-persons .
Size of nonfamily households: 10,450 1-person , 6,409 2-persons , 1,235 3-persons , 121 4-persons , 29 5-persons , 17 7-or-more-persons .
5,986 married couples with children. single-parent households (301 men , 1,677 women ).
77.2% of residents of Hoboken speak English at home. of residents speak Spanish at home (66% speak English very well , 14% speak English well , 13% speak English not well , 6% don't speak English at all ).of residents speak other Indo-European language at home (92% speak English very well , 3% speak English well , 3% speak English not well , 2% don't speak English at all ).of residents speak Asian or Pacific Island language at home (79% speak English very well , 18% speak English well , 2% speak English not well , 2% don't speak English at all ).of residents speak other language at home (89% speak English very well , 11% speak English well ).
Foreign born population: 11,165 (19.2%)of them are naturalized citizens )
Median number of rooms in houses and condos:
Median number of rooms in apartments
Owner-occupied Renter-occupied
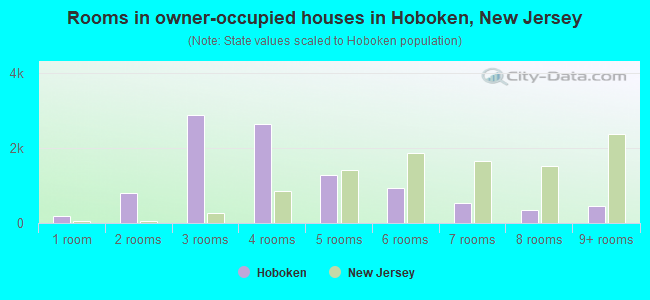
Rooms in owner-occupied houses in Hoboken, New Jersey
197 1 room 799 2 rooms 2,878 3 rooms 2,649 4 rooms 1,284 5 rooms 927 6 rooms 530 7 rooms 353 8 rooms 450 9+ rooms
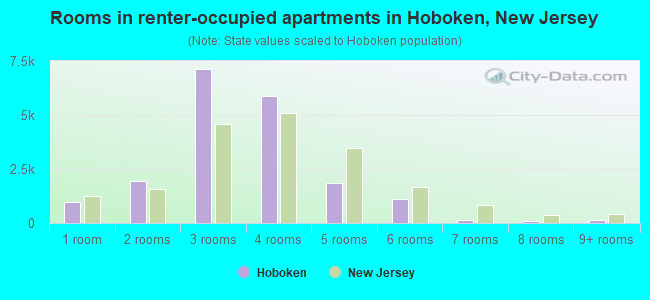
Rooms in renter-occupied apartments in Hoboken, New Jersey
981 1 room 1,966 2 rooms 7,110 3 rooms 5,889 4 rooms 1,842 5 rooms 1,089 6 rooms 127 7 rooms 82 8 rooms 118 9+ rooms
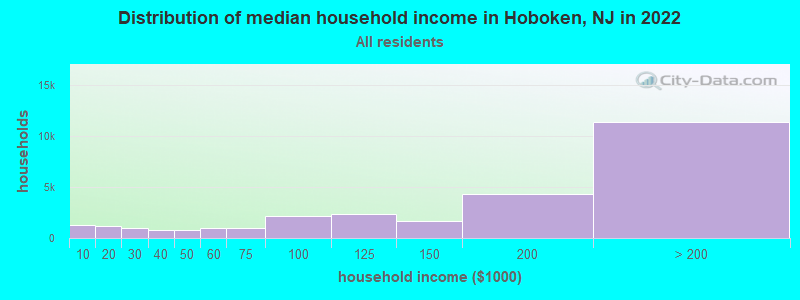
Hoboken, NJ household income distribution 1,301 Less than $10,0001,196 $10,000 to $19,999951 $20,000 to $29,999739 $30,000 to $39,999781 $40,000 to $49,999934 $50,000 to $59,9991,013 $60,000 to $74,9992,134 $75,000 to $99,9992,369 $100,000 to $124,9991,665 $125,000 to $149,9994,306 $150,000 to $199,99911,370 $200,000 or more
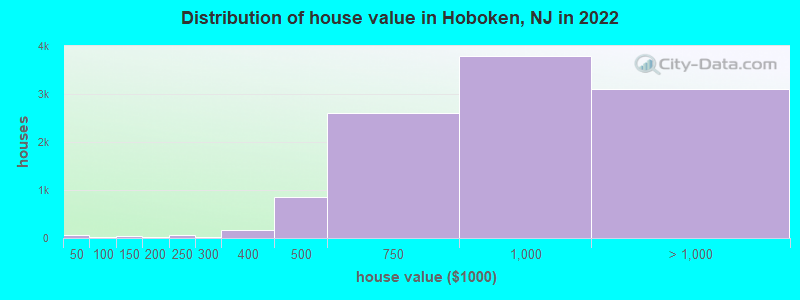
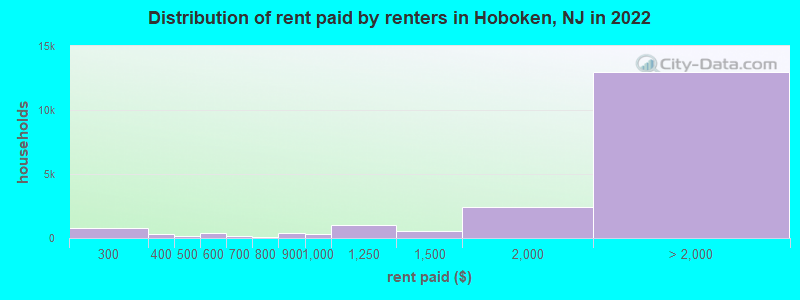
Home value of owner - occupied houses in 2022 in Hoboken, NJ 26 Less than $10,00027 $30,000 to $34,9999 $50,000 to $59,9998 $90,000 to $99,99936 $100,000 to $124,99927 $150,000 to $174,99959 $200,000 to $249,99928 $250,000 to $299,999162 $300,000 to $399,999851 $400,000 to $499,9992,607 $500,000 to $749,9993,800 $750,000 to $999,9991,831 $1,000,000 to $1,499,999496 $1,500,000 to $1,999,999785 $2,000,000 or moreRent paid by renters in 2022 in Hoboken, NJ 36 Less than $10075 $150 to $199449 $200 to $249299 $250 to $299119 $300 to $349163 $350 to $3996 $400 to $449112 $450 to $499228 $500 to $549124 $550 to $59977 $600 to $64956 $650 to $69989 $700 to $74916 $750 to $799374 $800 to $899293 $900 to $9991,029 $1,000 to $1,249570 $1,250 to $1,4992,452 $1,500 to $1,9992,600 $2,000 to $2,4992,869 $2,500 to $2,9992,598 $3,000 to $3,4994,684 $3,500 or more210 No cash rent
Percentage of workers working in this county: 51.8%Number of people working at home: 14,703 (38.0% of all workers )
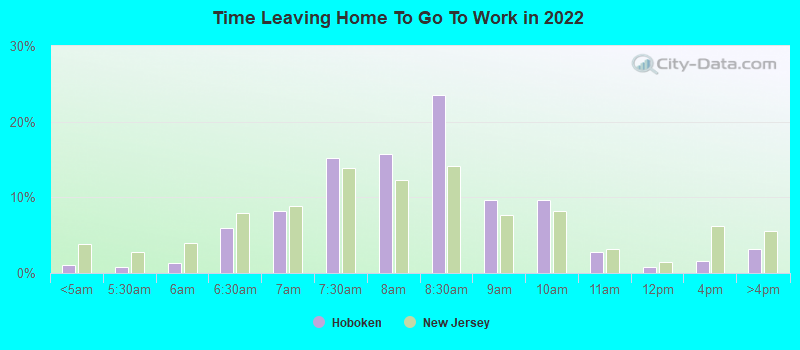
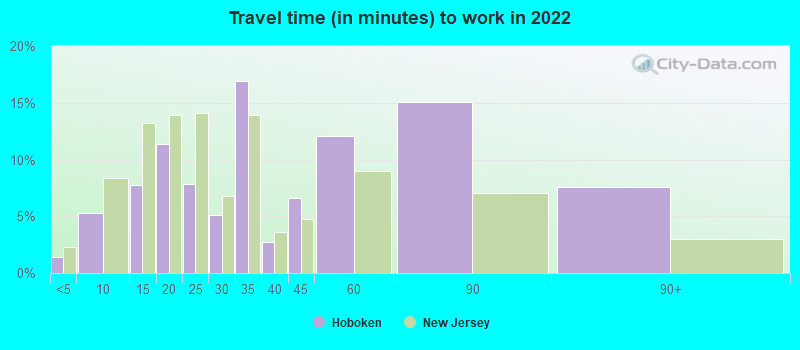
Travel time to work (commute)
Less than 5 minutes: 2565 to 9 minutes: 1,03910 to 14 minutes: 94215 to 19 minutes: 2,02620 to 24 minutes: 1,36825 to 29 minutes: 1,63130 to 34 minutes: 3,43235 to 39 minutes: 1,56540 to 44 minutes: 4,00045 to 59 minutes: 5,82960 to 89 minutes: 3,28390 or more minutes: 482
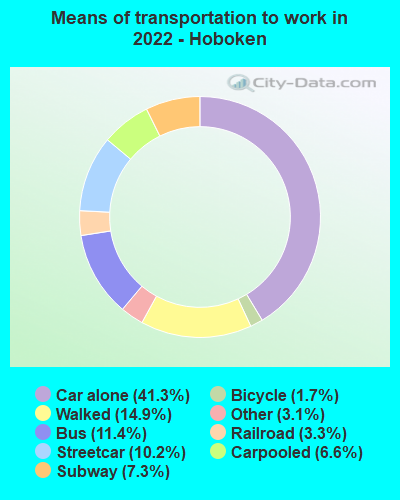
Means of transportation to work:
Drove a car alone: 8,781 (25.6%)Carpooled: 1,483 (4.3%)Bus : 2,427 (7.1%)Subway or elevated rail : 1,905 (5.5%)Long-distance train or commuter rail : 1,148 (3.3%)Light rail, streetcar or trolley : 1,071 (3.1%)Ferryboat: 5 (0.0%)Taxi: 773 (2.3%)Bicycle: 295 (0.9%)Walked: 3,306 (9.6%)Worked at home: 14,703 (42.8%)
Unemployment by race in 2022
Unemployment rate for White non-Hispanic residents 3.7% Males1.4% FemalesUnemployment rate for Black residents 5.7% Males0.5% FemalesUnemployment rate for Asian residents 1.6% Males1.2% FemalesUnemployment rate for other race residents 5.1% Males5.2% FemalesUnemployment rate for two or more race residents 4.3% Males0.7% FemalesUnemployment rate for Hispanic or Latino residents 8.0% Males1.3% Females
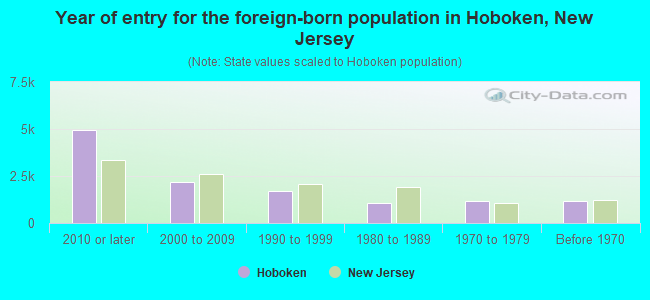
Year of entry for the foreign-born population in Hoboken, New Jersey
4,962 2010 or later 2,157 2000 to 2009 1,720 1990 to 1999 1,056 1980 to 1989 1,175 1970 to 1979 1,183 Before 1970
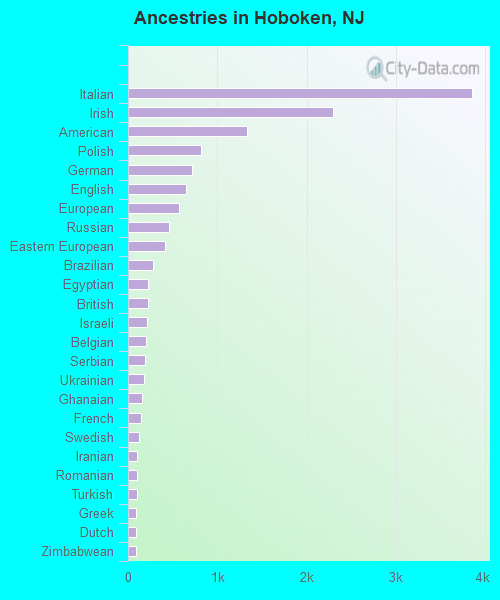
First ancestries reported:
Italian: 3,852 (13.6%)
Irish: 2,298 (8.1%)
American: 1,335 (4.7%)
Polish: 816 (2.9%)
German: 718 (2.5%)
English: 651 (2.3%)
European: 570 (2.0%)
Russian: 459 (1.6%)
Eastern European: 414 (1.5%)
Brazilian: 279 (1.0%)
Egyptian: 225 (0.8%)
British: 224 (0.8%)
Israeli: 210 (0.7%)
Belgian: 204 (0.7%)
Serbian: 194 (0.7%)
Ukrainian: 180 (0.6%)
Ghanaian: 159 (0.6%)
French: 144 (0.5%)
Swedish: 119 (0.4%)
Iranian: 106 (0.4%)
Romanian: 103 (0.4%)
Turkish: 98 (0.3%)
Greek: 93 (0.3%)
Dutch: 90 (0.3%)
Zimbabwean: 87 (0.3%)
African: 76 (0.3%)
Scottish: 67 (0.2%)
Norwegian: 65 (0.2%)
Arab: 65 (0.2%)
Jamaican: 61 (0.2%)
Lebanese: 56 (0.2%)
Hungarian: 52 (0.2%)
Croatian: 51 (0.2%)
Bulgarian: 43 (0.2%)
Danish: 39 (0.1%)
Portuguese: 38 (0.1%)
Pennsylvania German: 37 (0.1%)
Slovak: 37 (0.1%)
Welsh: 32 (0.1%)
Armenian: 31 (0.1%)
Scotch-Irish: 30 (0.1%)
Iraqi: 29 (0.1%)
West Indian: 29 (0.1%)
South African: 25 (0.09%)
Austrian: 24 (0.08%)
Australian: 21 (0.07%)
Macedonian: 20 (0.07%)
Moroccan: 16 (0.06%)
French Canadian: 16 (0.06%)
Latvian: 15 (0.05%)
Trinidadian and Tobagonian: 14 (0.05%)
Albanian: 12 (0.04%)
Haitian: 11 (0.04%)
Czech: 8 (0.03%)
Swiss: 8 (0.03%)
Palestinian: 5 (0.02%)
New Zealander: 4 (0.01%)
Scandinavian: 3 (0.01%)
Estonian: 2 (0.01%)
Most common places of birth for foreign-born residents (%): India Hoboken:
15.5% (1,824)New Jersey:
12.8% (274,609)
China, excluding Hong Kong and Taiwan Hoboken:
13.7% (1,615)New Jersey:
3.7% (78,969)
Dominican Republic Hoboken:
4.9% (578)New Jersey:
9.7% (209,055)
Canada Hoboken:
3.5% (417)New Jersey:
0.9% (18,317)
United Kingdom, excluding England and Scotland Hoboken:
3.4% (398)New Jersey:
0.6% (12,793)
Israel Hoboken:
3.3% (393)New Jersey:
0.5% (10,975)
Italy Hoboken:
3.1% (359)New Jersey:
1.5% (33,198)
Ecuador Hoboken:
2.5% (295)New Jersey:
4.4% (95,275)
Brazil Hoboken:
2.5% (290)New Jersey:
2.1% (46,020)
Taiwan Hoboken:
2.3% (267)New Jersey:
0.7% (15,548)
Germany Hoboken:
2.2% (254)New Jersey:
0.8% (17,217)
Philippines Hoboken:
2.1% (249)New Jersey:
4.0% (85,934)
Korea Hoboken:
2.1% (245)New Jersey:
3.3% (70,512)
Cuba Hoboken:
1.9% (227)New Jersey:
2.1% (45,435)
Mexico Hoboken:
1.9% (222)New Jersey:
4.8% (102,527)
Argentina Hoboken:
1.7% (197)New Jersey:
0.5% (10,607)
Russia Hoboken:
1.6% (189)New Jersey:
0.9% (20,371)
England Hoboken:
1.6% (185)New Jersey:
0.5% (10,886)
Place of birth for U.S.-born residents:
This state: 21,810Other state: 25,042Northeast: 18,016Midwest: 1,897South: 3,402West: 1,663 79.9% of Hoboken residents lived in the same house 1 years ago.
Out of people who lived in different houses, 29.0% lived in this county.
Out of people who lived in different counties, 37.7% lived in New Jersey.
Hoboken:
79.9%State average:
90.4%
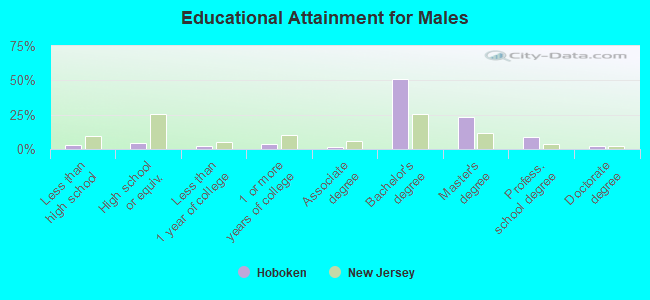
Education attainment for males 25 years and older:
No schooling: 155Nursery to 4th grade: 05th and 6th grade: 1087th and 8th grade: 409th grade: 14910th grade: 14311th grade: 1212th grade, no diploma: 74High school graduate (or equivalency): 987Less than 1 year of college: 482Some college more than 1 year, no degree: 846Associate degree: 350Bachelor's degree: 10,890Master's degree: 4,993Professional school degree: 1,825Doctorate degree: 419
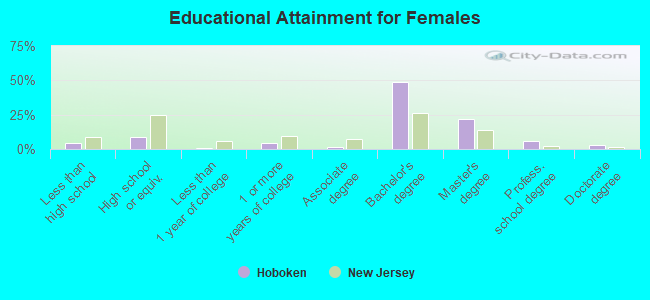
Education attainment for females 25 years and older:
No schooling: 173Nursery to 4th grade: 1045th and 6th grade: 1317th and 8th grade: 1149th grade: 15110th grade: 7911th grade: 15412th grade, no diploma: 128High school graduate (or equivalency): 2,070Less than 1 year of college: 186Some college more than 1 year, no degree: 1,031Associate degree: 341Bachelor's degree: 11,423Master's degree: 5,155Professional school degree: 1,362Doctorate degree: 693
Housing units in structures:
One, detached: 473One, attached: 834Two: 7453 or 4: 4,2655 to 9: 6,11610 to 19: 3,51520 to 49: 4,56950 or more: 10,425Mobile homes: 6Housing units lacking complete plumbing facilities in 2022: 0.1%Housing units lacking complete kitchen facilities in 2022: 0.4%House/condo owner moved in on average 7 years ago
Renter moved in on average 2 years ago
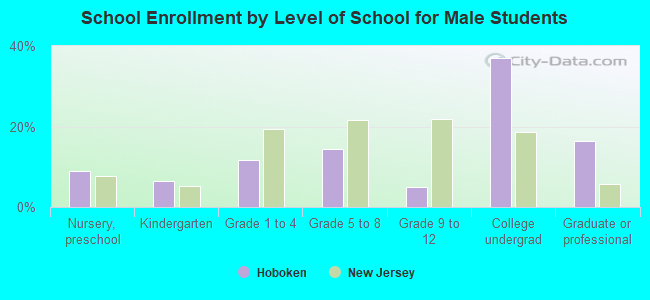
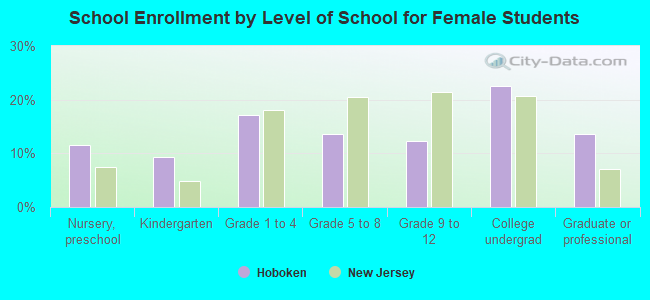
Private vs. public school enrollment:
Students in private schools in grades 1 to 8 (elementary and middle school): 658 Here:
22.9%New Jersey:
12.3%
Students in private schools in grades 9 to 12 (high school): 527 Here:
51.7%New Jersey:
13.1%
Students in private undergraduate colleges: 2,818 Here:
84.0%New Jersey:
33.2%