Races in Hoboken, New Jersey (NJ) Detailed Stats
Data:
Races - White alone (%)
Races - White alone (% change since 2000)
Races - Black alone (%)
Races - Black alone (% change since 2000)
Races - American Indian alone (%)
Races - American Indian alone (% change since 2000)
Races - Asian alone (%)
Races - Asian alone (% change since 2000)
Races - Hispanic (%)
Races - Hispanic (% change since 2000)
Races - Native Hawaiian and Other Pacific Islander alone (%)
Races - Native Hawaiian and Other Pacific Islander alone (% change since 2000)
Races - Two or more races(%)
Races - Two or more races(% change since 2000)
Races - Other race alone (%)
Races - Other race alone (% change since 2000)
Racial diversity
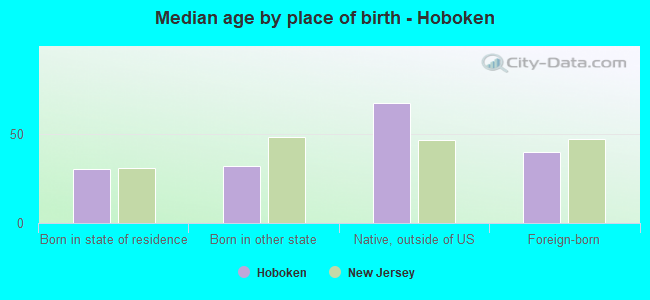
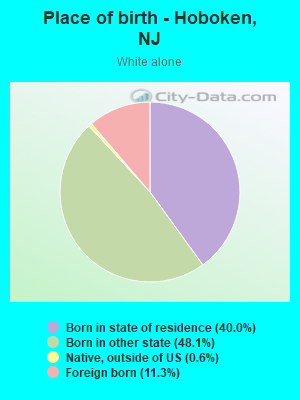
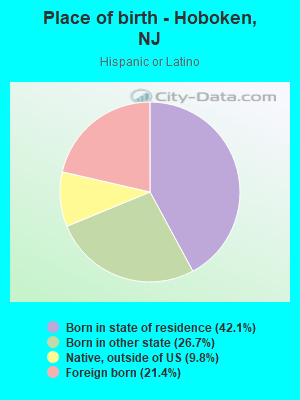
Place of birth - Born in state of residence (%)
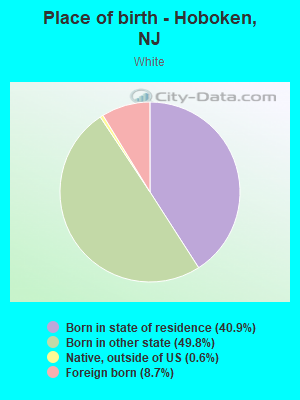
Place of birth - Born in state of residence (%) - White
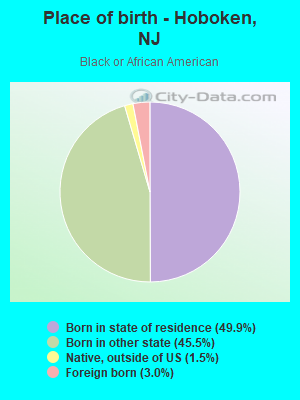
Place of birth - Born in state of residence (%) - Black or African American
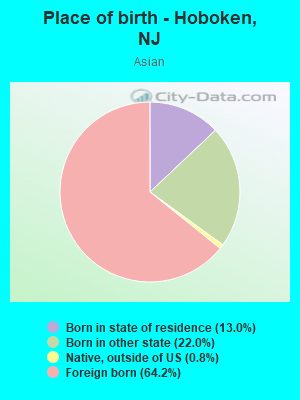
Place of birth - Born in state of residence (%) - Asian
Place of birth - Born in state of residence (%) - Hispanic or Latino
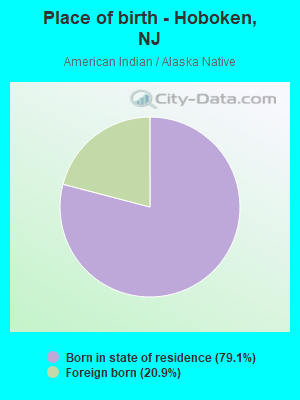
Place of birth - Born in state of residence (%) - American Indian and Alaska Native
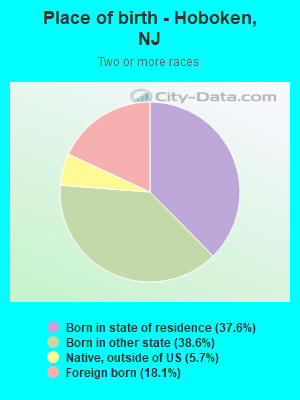
Place of birth - Born in state of residence (%) - Multirace
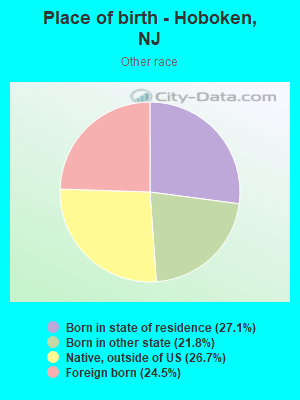
Place of birth - Born in state of residence (%) - Other Race
Place of birth - Born in other state (%)
Place of birth - Born in other state (%) - White
Place of birth - Born in other state (%) - Black or African American
Place of birth - Born in other state (%) - Asian
Place of birth - Born in other state (%) - Hispanic or Latino
Place of birth - Born in other state (%) - American Indian and Alaska Native
Place of birth - Born in other state (%) - Multirace
Place of birth - Born in other state (%) - Other Race
Place of birth - Native, outside of US (%)
Place of birth - Native, outside of US (%) - White
Place of birth - Native, outside of US (%) - Black or African American
Place of birth - Native, outside of US (%) - Asian
Place of birth - Native, outside of US (%) - Hispanic or Latino
Place of birth - Native, outside of US (%) - American Indian and Alaska Native
Place of birth - Native, outside of US (%) - Multirace
Place of birth - Native, outside of US (%) - Other Race
Place of birth - Foreign born (%)
Place of birth - Foreign born (%) - White
Place of birth - Foreign born (%) - Black or African American
Place of birth - Foreign born (%) - Asian
Place of birth - Foreign born (%) - Hispanic or Latino
Place of birth - Foreign born (%) - American Indian and Alaska Native
Place of birth - Foreign born (%) - Multirace
Place of birth - Foreign born (%) - Other Race
Residents speaking English at home (%)
Residents speaking English at home - Born in the United States (%)
Residents speaking English at home - Native, born elsewhere (%)
Residents speaking English at home - Foreign born (%)
Residents speaking Spanish at home (%)
Residents speaking Spanish at home - Born in the United States (%)
Residents speaking Spanish at home - Native, born elsewhere (%)
Residents speaking Spanish at home - Foreign born (%)
Residents speaking other language at home (%)
Residents speaking other language at home - Born in the United States (%)
Residents speaking other language at home - Native, born elsewhere (%)
Residents speaking other language at home - Foreign born (%)
Marital status - Never married (%)
Marital status - Now married (%)
Marital status - Separated (%)
Marital status - Widowed (%)
Marital status - Divorced (%)
Ancestries Reported - Arab (%)
Ancestries Reported - Czech (%)
Ancestries Reported - Danish (%)
Ancestries Reported - Dutch (%)
Ancestries Reported - English (%)
Ancestries Reported - French (%)
Ancestries Reported - French Canadian (%)
Ancestries Reported - German (%)
Ancestries Reported - Greek (%)
Ancestries Reported - Hungarian (%)
Ancestries Reported - Irish (%)
Ancestries Reported - Italian (%)
Ancestries Reported - Lithuanian (%)
Ancestries Reported - Norwegian (%)
Ancestries Reported - Polish (%)
Ancestries Reported - Portuguese (%)
Ancestries Reported - Russian (%)
Ancestries Reported - Scotch-Irish (%)
Ancestries Reported - Scottish (%)
Ancestries Reported - Slovak (%)
Ancestries Reported - Subsaharan African (%)
Ancestries Reported - Swedish (%)
Ancestries Reported - Swiss (%)
Ancestries Reported - Ukrainian (%)
Ancestries Reported - United States (%)
Ancestries Reported - Welsh (%)
Ancestries Reported - West Indian (%)
Ancestries Reported - Other (%)
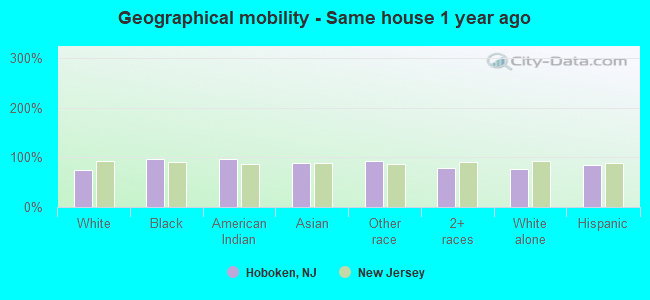
Geographical mobility - Same house 1 year ago (%)
Geographical mobility - Same house 1 year ago (%) - White
Geographical mobility - Same house 1 year ago (%) - Black or African American
Geographical mobility - Same house 1 year ago (%) - Asian
Geographical mobility - Same house 1 year ago (%) - Hispanic or Latino
Geographical mobility - Same house 1 year ago (%) - American Indian and Alaska Native
Geographical mobility - Same house 1 year ago (%) - Multirace
Geographical mobility - Same house 1 year ago (%) - Other Race
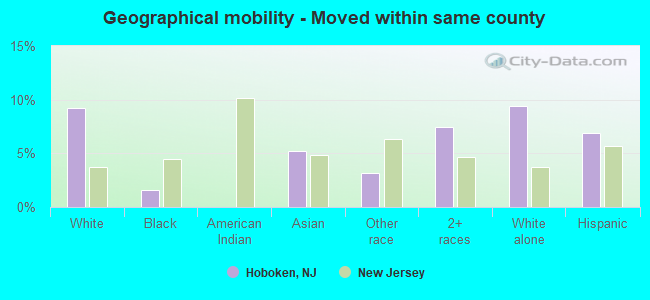
Geographical mobility - Moved within same county (%)
Geographical mobility - Moved within same county (%) - White
Geographical mobility - Moved within same county (%) - Black or African American
Geographical mobility - Moved within same county (%) - Asian
Geographical mobility - Moved within same county (%) - Hispanic or Latino
Geographical mobility - Moved within same county (%) - American Indian and Alaska Native
Geographical mobility - Moved within same county (%) - Multirace
Geographical mobility - Moved within same county (%) - Other Race
Geographical mobility - Moved from different county within same state (%)
Geographical mobility - Moved from different county within same state (%) - White
Geographical mobility - Moved from different county within same state (%) - Black or African American
Geographical mobility - Moved from different county within same state (%) - Asian
Geographical mobility - Moved from different county within same state (%) - Hispanic or Latino
Geographical mobility - Moved from different county within same state (%) - American Indian and Alaska Native
Geographical mobility - Moved from different county within same state (%) - Multirace
Geographical mobility - Moved from different county within same state (%) - Other Race
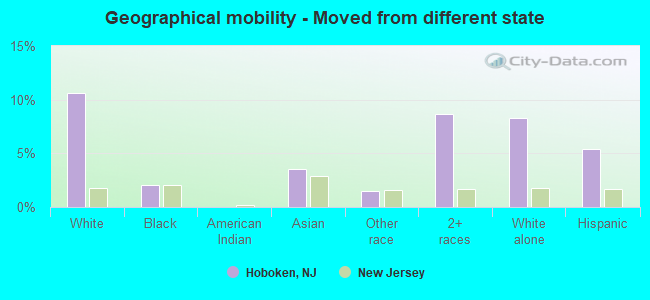
Geographical mobility - Moved from different state (%)
Geographical mobility - Moved from different state (%) - White
Geographical mobility - Moved from different state (%) - Black or African American
Geographical mobility - Moved from different state (%) - Asian
Geographical mobility - Moved from different state (%) - Hispanic or Latino
Geographical mobility - Moved from different state (%) - American Indian and Alaska Native
Geographical mobility - Moved from different state (%) - Multirace
Geographical mobility - Moved from different state (%) - Other Race
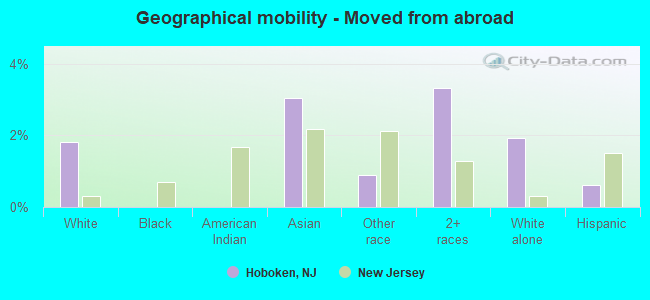
Geographical mobility - Moved from abroad (%)
Geographical mobility - Moved from abroad (%) - White
Geographical mobility - Moved from abroad (%) - Black or African American
Geographical mobility - Moved from abroad (%) - Asian
Geographical mobility - Moved from abroad (%) - Hispanic or Latino
Geographical mobility - Moved from abroad (%) - American Indian and Alaska Native
Geographical mobility - Moved from abroad (%) - Multirace
Geographical mobility - Moved from abroad (%) - Other Race
Place of birth for the foreign-born population - Ireland (%)
Place of birth for the foreign-born population - Denmark (%)
Place of birth for the foreign-born population - Norway (%)
Place of birth for the foreign-born population - Sweden (%)
Place of birth for the foreign-born population - United Kingdom (%)
Place of birth for the foreign-born population - England (%)
Place of birth for the foreign-born population - Scotland (%)
Place of birth for the foreign-born population - Other Northern Europe (%)
Place of birth for the foreign-born population - Austria (%)
Place of birth for the foreign-born population - Belgium (%)
Place of birth for the foreign-born population - France (%)
Place of birth for the foreign-born population - Germany (%)
Place of birth for the foreign-born population - Netherlands (%)
Place of birth for the foreign-born population - Switzerland (%)
Place of birth for the foreign-born population - Other Western Europe (%)
Place of birth for the foreign-born population - Greece (%)
Place of birth for the foreign-born population - Italy (%)
Place of birth for the foreign-born population - Portugal (%)
Place of birth for the foreign-born population - Spain (%)
Place of birth for the foreign-born population - Other Southern Europe (%)
Place of birth for the foreign-born population - Albania (%)
Place of birth for the foreign-born population - Belarus (%)
Place of birth for the foreign-born population - Bosnia and Herzegovina (%)
Place of birth for the foreign-born population - Bulgaria (%)
Place of birth for the foreign-born population - Croatia (%)
Place of birth for the foreign-born population - Czechoslovakia (%)
Place of birth for the foreign-born population - Hungary (%)
Place of birth for the foreign-born population - Latvia (%)
Place of birth for the foreign-born population - Lithuania (%)
Place of birth for the foreign-born population - North Macedonia (Macedonia) (%)
Place of birth for the foreign-born population - Moldova (%)
Place of birth for the foreign-born population - Poland (%)
Place of birth for the foreign-born population - Romania (%)
Place of birth for the foreign-born population - Russia (%)
Place of birth for the foreign-born population - Serbia (%)
Place of birth for the foreign-born population - Ukraine (%)
Place of birth for the foreign-born population - Other Eastern Europe (%)
Place of birth for the foreign-born population - China (%)
Place of birth for the foreign-born population - Hong Kong (%)
Place of birth for the foreign-born population - Taiwan (%)
Place of birth for the foreign-born population - Japan (%)
Place of birth for the foreign-born population - Korea (%)
Place of birth for the foreign-born population - Other Eastern Asia (%)
Place of birth for the foreign-born population - Afghanistan (%)
Place of birth for the foreign-born population - Bangladesh (%)
Place of birth for the foreign-born population - India (%)
Place of birth for the foreign-born population - Iran (%)
Place of birth for the foreign-born population - Kazakhstan (%)
Place of birth for the foreign-born population - Nepal (%)
Place of birth for the foreign-born population - Pakistan (%)
Place of birth for the foreign-born population - Sri Lanka (%)
Place of birth for the foreign-born population - Uzbekistan (%)
Place of birth for the foreign-born population - Other South Central Asia (%)
Place of birth for the foreign-born population - Burma (%)
Place of birth for the foreign-born population - Cambodia (%)
Place of birth for the foreign-born population - Indonesia (%)
Place of birth for the foreign-born population - Laos (%)
Place of birth for the foreign-born population - Malaysia (%)
Place of birth for the foreign-born population - Philippines (%)
Place of birth for the foreign-born population - Singapore (%)
Place of birth for the foreign-born population - Thailand (%)
Place of birth for the foreign-born population - Vietnam (%)
Place of birth for the foreign-born population - Other South Eastern Asia (%)
Place of birth for the foreign-born population - Armenia (%)
Place of birth for the foreign-born population - Iraq (%)
Place of birth for the foreign-born population - Israel (%)
Place of birth for the foreign-born population - Jordan (%)
Place of birth for the foreign-born population - Kuwait (%)
Place of birth for the foreign-born population - Lebanon (%)
Place of birth for the foreign-born population - Saudi Arabia (%)
Place of birth for the foreign-born population - Syria (%)
Place of birth for the foreign-born population - Turkey (%)
Place of birth for the foreign-born population - Yemen (%)
Place of birth for the foreign-born population - Other Western Asia (%)
Place of birth for the foreign-born population - Eritrea (%)
Place of birth for the foreign-born population - Ethiopia (%)
Place of birth for the foreign-born population - Kenya (%)
Place of birth for the foreign-born population - Somalia (%)
Place of birth for the foreign-born population - Uganda (%)
Place of birth for the foreign-born population - Zimbabwe (%)
Place of birth for the foreign-born population - Other Eastern Africa (%)
Place of birth for the foreign-born population - Cameroon (%)
Place of birth for the foreign-born population - Congo (%)
Place of birth for the foreign-born population - Democratic Republic of Congo (Zaire) (%)
Place of birth for the foreign-born population - Other Middle Africa (%)
Place of birth for the foreign-born population - Egypt (%)
Place of birth for the foreign-born population - Morocco (%)
Place of birth for the foreign-born population - Sudan (%)
Place of birth for the foreign-born population - Other Northern Africa (%)
Place of birth for the foreign-born population - South Africa (%)
Place of birth for the foreign-born population - Other Southern Africa (%)
Place of birth for the foreign-born population - Cabo Verde (%)
Place of birth for the foreign-born population - Ghana (%)
Place of birth for the foreign-born population - Liberia (%)
Place of birth for the foreign-born population - Nigeria (%)
Place of birth for the foreign-born population - Senegal (%)
Place of birth for the foreign-born population - Sierra Leone (%)
Place of birth for the foreign-born population - Other Western Africa (%)
Place of birth for the foreign-born population - Australia (%)
Place of birth for the foreign-born population - New Zealand (%)
Place of birth for the foreign-born population - Fiji (%)
Place of birth for the foreign-born population - Micronesia (%)
Place of birth for the foreign-born population - Bahamas (%)
Place of birth for the foreign-born population - Barbados (%)
Place of birth for the foreign-born population - Cuba (%)
Place of birth for the foreign-born population - Dominica (%)
Place of birth for the foreign-born population - Dominican Republic (%)
Place of birth for the foreign-born population - Grenada (%)
Place of birth for the foreign-born population - Haiti (%)
Place of birth for the foreign-born population - Jamaica (%)
Place of birth for the foreign-born population - St. Vincent and the Grenadines (%)
Place of birth for the foreign-born population - Trinidad and Tobago (%)
Place of birth for the foreign-born population - West Indies (%)
Place of birth for the foreign-born population - Other Caribbean (%)
Place of birth for the foreign-born population - Belize (%)
Place of birth for the foreign-born population - Costa Rica (%)
Place of birth for the foreign-born population - El Salvador (%)
Place of birth for the foreign-born population - Guatemala (%)
Place of birth for the foreign-born population - Honduras (%)
Place of birth for the foreign-born population - Mexico (%)
Place of birth for the foreign-born population - Nicaragua (%)
Place of birth for the foreign-born population - Panama (%)
Place of birth for the foreign-born population - Other Central America (%)
Place of birth for the foreign-born population - Argentina (%)
Place of birth for the foreign-born population - Bolivia (%)
Place of birth for the foreign-born population - Brazil (%)
Place of birth for the foreign-born population - Chile (%)
Place of birth for the foreign-born population - Colombia (%)
Place of birth for the foreign-born population - Ecuador (%)
Place of birth for the foreign-born population - Guyana (%)
Place of birth for the foreign-born population - Peru (%)
Place of birth for the foreign-born population - Uruguay (%)
Place of birth for the foreign-born population - Venezuela (%)
Place of birth for the foreign-born population - Other South America (%)
Place of birth for the foreign-born population - Canada (%)
Place of birth for the foreign-born population - Other Northern America (%)
Place of birth for the foreign-born population - Other (%)
Latest news about races in Hoboken, NJ collected exclusively by city-data.com from local newspapers, TV, and radio stations
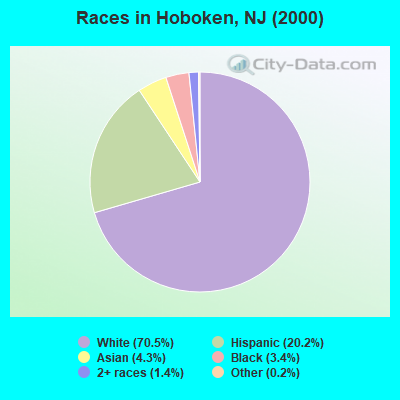
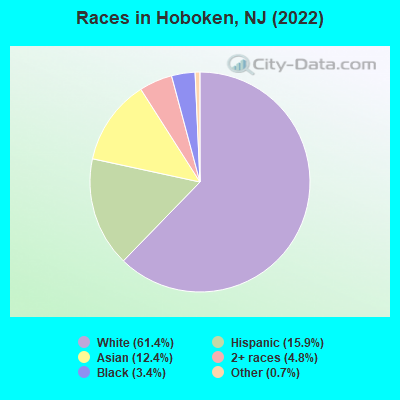
According to 2022 data, the most numerous races in Hoboken, NJ are White alone (35,663 residents), Hispanic (9,235 residents), and Black alone (1,999 residents). 77.3% of Hoboken residents speak English at home. 20.3% of Hoboken, NJ residents are foreign-born (9.1% born in Asia, 5.1% born in Europe, 3.9% born in Latin America), which is 13.5% less than the foreign-born rate of 23.0% across the entire state of New Jersey.
Race distribution in Hoboken
2000 2022
5,557,209 66.0% White alone 1,117,191 13.3% Hispanic 1,096,171 13.0% Black alone 477,012 5.7% Asian alone 133,689 1.6% Two or more races 19,565 0.2% Other race alone 11,338 0.1% American Indian alone 2,175 0.03% Native Hawaiian and Other
4,766,476 51.5% White alone 2,028,470 21.9% Hispanic 1,111,632 12.0% Black alone 923,546 10.0% Asian alone 332,237 3.6% Two or more races 89,847 1.0% Other race alone 8,557 0.09% American Indian alone 934 0.01% Native Hawaiian and Other
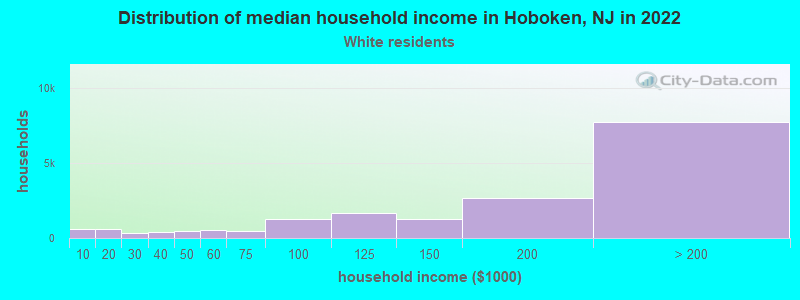
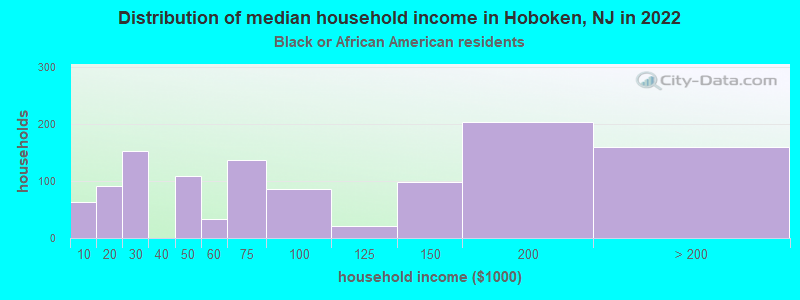
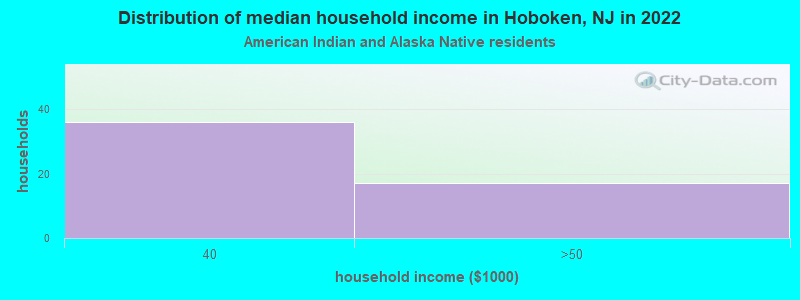
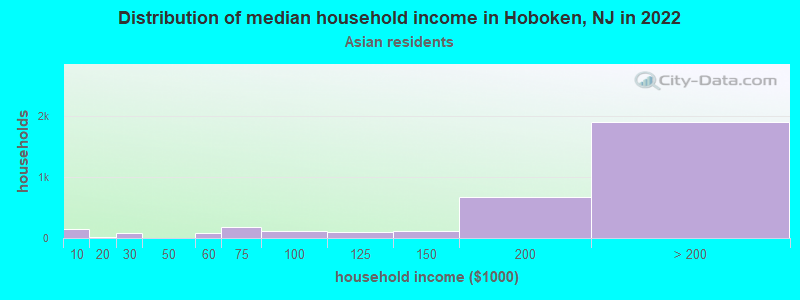
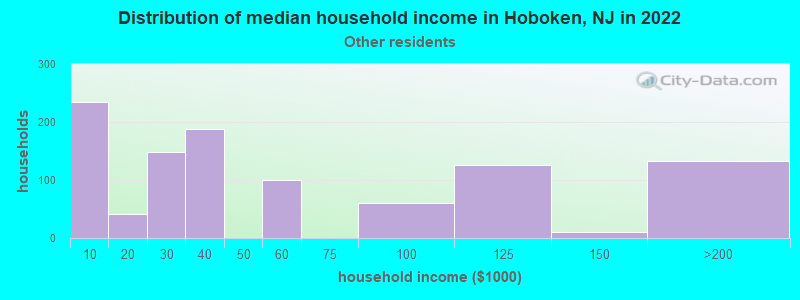
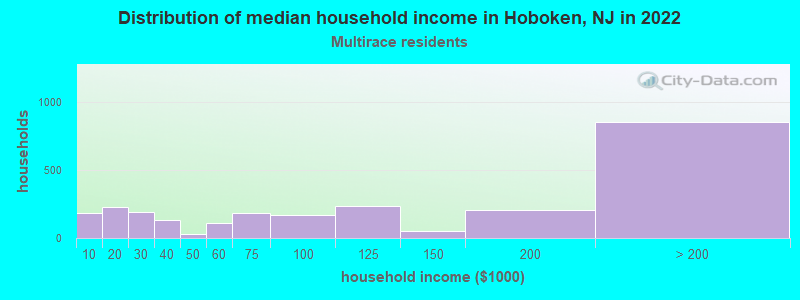
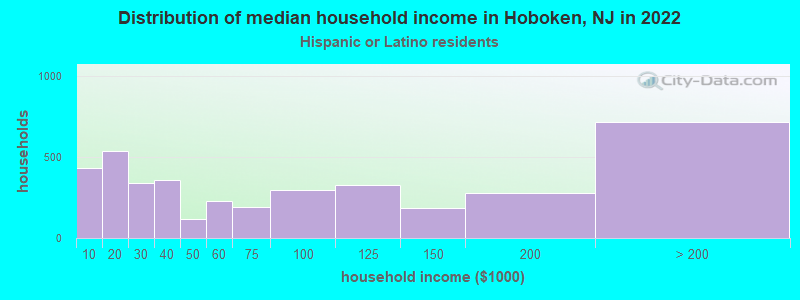
Income and house value in Hoboken Median household income in 2022 $165,934 White non-Hispanic householders$77,775 Black householdersover $200,000 Asian householders$30,978 Some other race householders$111,847 Two or more races householders$60,749 Hispanic or Latino race householdersMedian 2022 house value over $1,000,000 White Non-Hispanic householdersover $1,000,000 Black or African American householders $838,139 Asian householdersover $1,000,000 Some other race householdersover $1,000,000 Hispanic or Latino householders
Median age by race in Hoboken
31.7 Median age for White residents32.3 31.1 34.4 Median age for Black or African American residents35.9 27.4 31.3 Median age for American Indian / Alaska Native residents15.8 49.0 34.1 Median age for Asian residents32.8 35.7 -804,177,544.9 Median age for Native Hawaiian / Pacific Islander residents-860,335,194.7 -713,070,378.3 41.2 Median age for Other race residents51.8 37.3 31.1 Median age for Two or more races residents28.1 33.5 32.2 Median age for White alone residents32.2 32.1 33.5 Median age for Hispanic or Latino residents32.7 34.6
Owner/renter occupied households by race in Hoboken
House owners and renters - White residents 5,694 32.7% Owner occupied11,745 67.3% Renter occupiedHouse owners and renters - Black or African American residents 155 14.3% Owner occupied934 85.7% Renter occupiedHouse owners and renters - American Indian / Alaska Native residents 43 100.0% Renter occupiedHouse owners and renters - Asian residents 2,063 61.0% Owner occupied1,319 39.0% Renter occupiedHouse owners and renters - Other race residents 167 17.3% Owner occupied797 82.7% Renter occupiedHouse owners and renters - Two or more races residents 980 34.7% Owner occupied1,843 65.3% Renter occupiedHouse owners and renters - White alone residents 6,266 31.9% Owner occupied13,350 68.1% Renter occupiedHouse owners and renters - Hispanic or Latino residents 896 22.0% Owner occupied3,168 78.0% Renter occupied
Language usage in Hoboken
English speakers - Total 77.3% of residents of Hoboken speak English at home.
10.4% of residents speak Spanish at home 3,752 66.6% Speak English very well1,885 33.4% Speak English less than very well15.8% of residents speak other language at home 7,549 88.2% Speak English very well1,006 11.8% Speak English less than very well
English speakers - Born in the United States 90.1% of residents of Hoboken speak English at home.
4.6% of residents speak Spanish at home 981 91.6% Speak English very well90 8.4% Speak English less than very well7.4% of residents speak other language at home 1,718 99.5% Speak English very well9 0.5% Speak English less than very well
English speakers - Native, born elsewhere 15.9% of residents of Hoboken speak English at home.
69.7% of residents speak Spanish at home 242 29.6% Speak English very well576 70.4% Speak English less than very well20.5% of residents speak other language at home 240 100.0% Speak English very well
English speakers - Foreign-born 31.3% of residents of Hoboken speak English at home.
15.7% of residents speak Spanish at home 819 47.1% Speak English very well921 52.9% Speak English less than very well55.5% of residents speak other language at home 5,155 83.7% Speak English very well1,001 16.3% Speak English less than very well
White (Caucasian) - Speak only English Native:
100.0% (27,701)Foreign-born:
64.9% (1,853)
White (Caucasian) - Speak another language Native:
6.5% (1,803)Foreign-born:
56.6% (1,617)
Black or African American - Speak only English Native:
92.5% (2,442)Foreign-born:
39.5% (34)
Black or African American - Speak another language Native:
7.1% (187)Foreign-born:
57.4% (50)
Asian - Speak only English Native:
70.6% (1,569)Foreign-born:
24.8% (1,222)
Asian - Speak another language Native:
33.0% (733)Foreign-born:
75.8% (3,732)
Other race - Speak only English Native:
38.4% (586)Foreign-born:
4.1% (21)
Other race - Speak another language Native:
57.2% (874)Foreign-born:
95.3% (477)
Two or more races - Speak only English Native:
64.5% (3,453)Foreign-born:
12.7% (183)
Two or more races - Speak another language Native:
37.4% (2,002)Foreign-born:
87.6% (1,261)
White alone - Speak only English Native:
94.2% (27,962)Foreign-born:
51.7% (2,044)
White alone - Speak another language Native:
6.0% (1,776)Foreign-born:
55.4% (2,192)
Hispanic or Latino - Speak only English Native:
47.4% (3,189)Foreign-born:
14.3% (283)
Hispanic or Latino - Speak another language Native:
54.0% (3,633)Foreign-born:
87.2% (1,728)
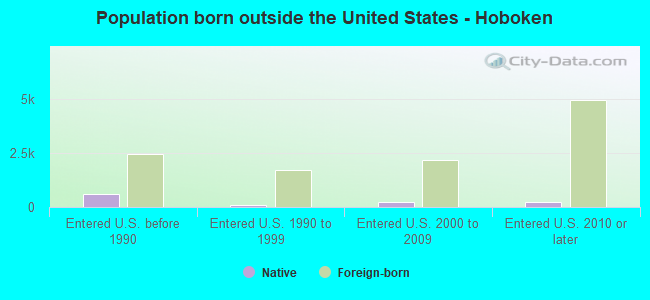
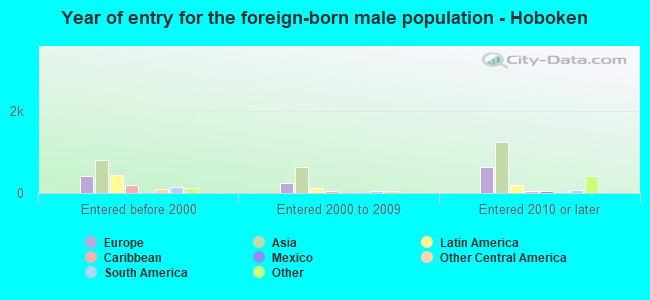
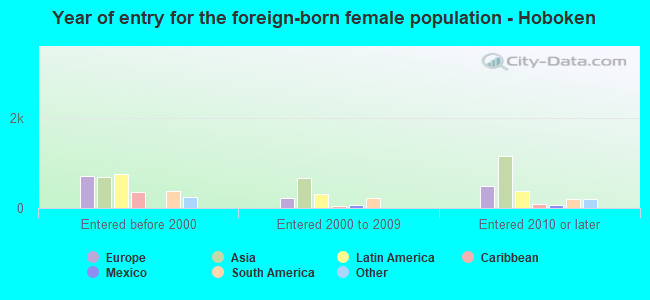
Foreign-born residents in Hoboken 11,760 residents are foreign born (9.1% Asia , 5.1% Europe , 3.9% Latin America ).
This city:
20.3%New Jersey:
23.2%
Marital status for residents in Hoboken Marital status - White (Caucasian) population 15 years and over
Males 56.1% Never married37.9% Now married1.3% Separated0.5% Widowed4.2% DivorcedFemales 53.2% Never married36.2% Now married0.6% Separated3.6% Widowed6.5% DivorcedWomen who gave birth in the past 12 months Now married:
86.7% (539)Unmarried:
13.3% (82)
Women who did not give birth in the past 12 months Now married:
34.6% (3,643)Unmarried:
65.4% (6,893)
Marital status - Black or African American population 15 years and over
Males 42.2% Never married41.9% Now married11.2% Separated1.2% Widowed3.5% DivorcedFemales 61.2% Never married21.9% Now married0.7% Separated1.9% Widowed14.4% DivorcedWomen who did not give birth in the past 12 months Now married:
20.4% (197)Unmarried:
79.6% (768)
Marital status - American Indian / Alaska Native population 15 years and over
Males 100.0% Never married0.0% Now married0.0% Separated0.0% Widowed0.0% DivorcedFemales 0.0% Never married0.0% Now married0.0% Separated0.0% Widowed100.0% DivorcedWomen who did not give birth in the past 12 months Now married:
0.0% (0)Unmarried:
100.0% (57)
Marital status - Asian population 15 years and over
Males 36.8% Never married60.9% Now married0.0% Separated0.0% Widowed2.3% DivorcedFemales 30.6% Never married62.7% Now married0.9% Separated2.6% Widowed3.2% DivorcedWomen who gave birth in the past 12 months Now married:
100.0% (265)Unmarried:
0.0% (0)
Women who did not give birth in the past 12 months Now married:
58.8% (1,354)Unmarried:
41.2% (950)
Marital status - Other race population 15 years and over
Males 32.3% Never married50.5% Now married2.1% Separated0.0% Widowed15.1% DivorcedFemales 47.2% Never married20.0% Now married0.0% Separated21.5% Widowed11.3% DivorcedWomen who gave birth in the past 12 months Now married:
100.0% (38)Unmarried:
0.0% (0)
Women who did not give birth in the past 12 months Now married:
11.3% (63)Unmarried:
88.7% (500)
Marital status - Two or more races population 15 years and over
Males 45.4% Never married49.7% Now married1.8% Separated0.2% Widowed2.9% DivorcedFemales 47.4% Never married38.9% Now married0.4% Separated6.8% Widowed6.5% DivorcedWomen who gave birth in the past 12 months Now married:
100.0% (55)Unmarried:
0.0% (0)
Women who did not give birth in the past 12 months Now married:
38.4% (737)Unmarried:
61.6% (1,180)
Marital status - White alone, not Hispanic / Latino population 15 years and over
Males 56.4% Never married38.0% Now married1.3% Separated0.4% Widowed3.9% DivorcedFemales 53.6% Never married36.6% Now married0.5% Separated3.5% Widowed5.8% DivorcedWomen who gave birth in the past 12 months Now married:
86.0% (627)Unmarried:
14.0% (102)
Women who did not give birth in the past 12 months Now married:
34.6% (4,109)Unmarried:
65.4% (7,767)
Marital status - Hispanic or Latino population 15 years and over
Males 46.6% Never married45.0% Now married1.8% Separated0.5% Widowed6.0% DivorcedFemales 46.5% Never married29.3% Now married1.1% Separated10.1% Widowed13.1% DivorcedWomen who gave birth in the past 12 months Now married:
100.0% (113)Unmarried:
0.0% (0)
Women who did not give birth in the past 12 months Now married:
29.1% (761)Unmarried:
70.9% (1,855)
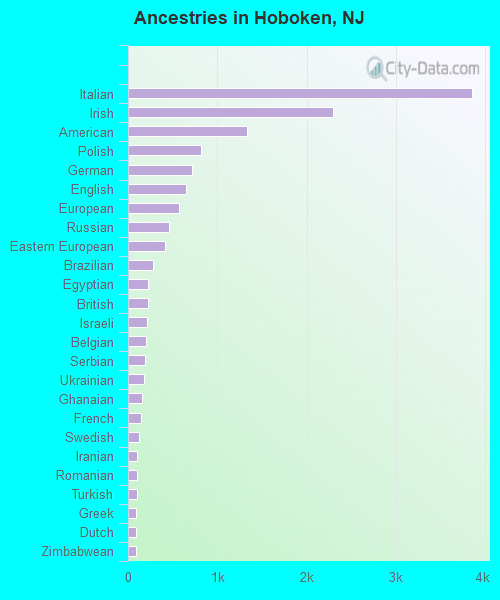
Ancestries in Hoboken
3,852 13.6% Italian2,298 8.1% Irish1,335 4.7% American816 2.9% Polish718 2.5% German651 2.3% English570 2.0% European459 1.6% Russian414 1.5% Eastern European279 1.0% Brazilian225 0.8% Egyptian224 0.8% British210 0.7% Israeli204 0.7% Belgian194 0.7% Serbian180 0.6% Ukrainian159 0.6% Ghanaian144 0.5% French119 0.4% Swedish106 0.4% Iranian103 0.4% Romanian98 0.3% Turkish93 0.3% Greek90 0.3% Dutch87 0.3% Zimbabwean76 0.3% African67 0.2% Scottish65 0.2% Norwegian65 0.2% Arab61 0.2% Jamaican56 0.2% Lebanese52 0.2% Hungarian51 0.2% Croatian43 0.2% Bulgarian39 0.1% Danish38 0.1% Portuguese37 0.1% Pennsylvania German37 0.1% Slovak32 0.1% Welsh31 0.1% Armenian30 0.1% Scotch-Irish29 0.1% Iraqi29 0.1% West Indian25 0.09% South African24 0.08% Austrian21 0.07% Australian20 0.07% Macedonian16 0.06% Moroccan16 0.06% French Canadian15 0.05% Latvian14 0.05% Trinidadian and Tobagonian12 0.04% Albanian11 0.04% Haitian8 0.03% Czech8 0.03% Swiss5 0.02% Palestinian4 0.01% New Zealander3 0.01% Scandinavian2 0.01% Estonian
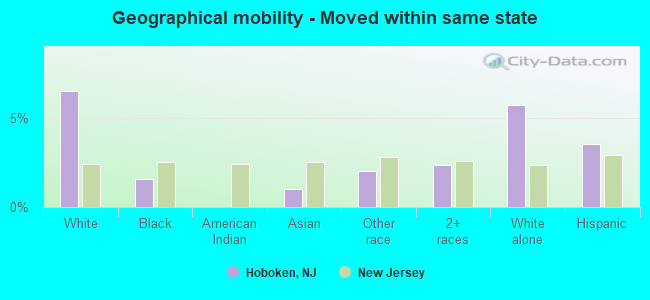
Geographical mobility in Hoboken Same house 1 year ago 22,711 75.4% White (Caucasian)2,530 95.8% Black or African American132 96.6% American Indian / Alaska Native6,372 87.6% Asian1,886 92.2% Other race5,999 78.6% Two or more races26,804 76.0% White alone, not Hispanic / Latino7,630 84.1% Hispanic or LatinoMoved within same county 2,791 9.3% White / Caucasian41 1.5% Black or African American383 5.3% Asian65 3.2% Other race572 7.5% Two or more races3,308 9.4% White alone, not Hispanic / Latino623 6.9% Hispanic or LatinoMoved within same state 1,948 6.5% White / Caucasian42 1.6% Black or African American73 1.0% Asian41 2.0% Other race178 2.3% Two or more races2,016 5.7% White alone, not Hispanic / Latino319 3.5% Hispanic or LatinoMoved from different state 3,191 10.6% White / Caucasian54 2.0% Black or African American260 3.6% Asian31 1.5% Other race661 8.7% Two or more races2,917 8.3% White alone, not Hispanic / Latino495 5.5% Hispanic or LatinoMoved from abroad 550 1.8% White222 3.1% Asian18 0.9% Other race253 3.3% Two or more races684 1.9% White alone, not Hispanic / Latino55 0.6% Hispanic or Latino
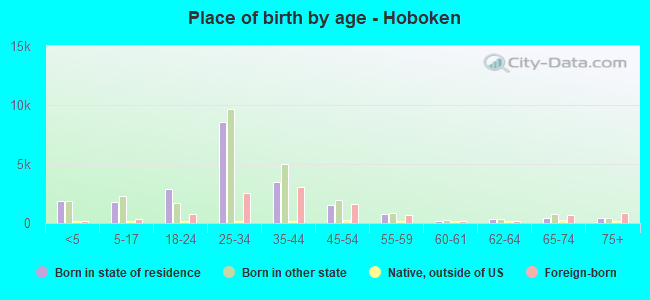
Children Nativity (place of birth) in Hoboken
Children under 6 years - Living with two parents Both parents native 2,206 100.0% NativeBoth parents foreign-born 747 89.6% Native87 10.4% Foreign-bornOne native, one foreign-born parent 570 94.8% Native31 5.2% Foreign-bornChildren under 6 years - Living with one parent Native parent 616 100.0% NativeForeign-born parent 119 100.0% NativeChildren 6 to 17 years - Living with two parents Both parents native 1,242 100.0% NativeBoth parents foreign-born 336 62.7% Native200 37.3% Foreign-bornOne native, one foreign-born parent 633 99.0% Native7 1.0% Foreign-bornChildren 6 to 17 years - Living with one parent Native parent 807 100.0% NativeForeign-born parent 373 56.1% Native291 43.9% Foreign-born
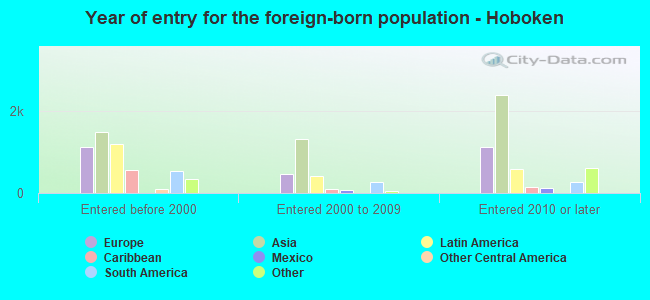
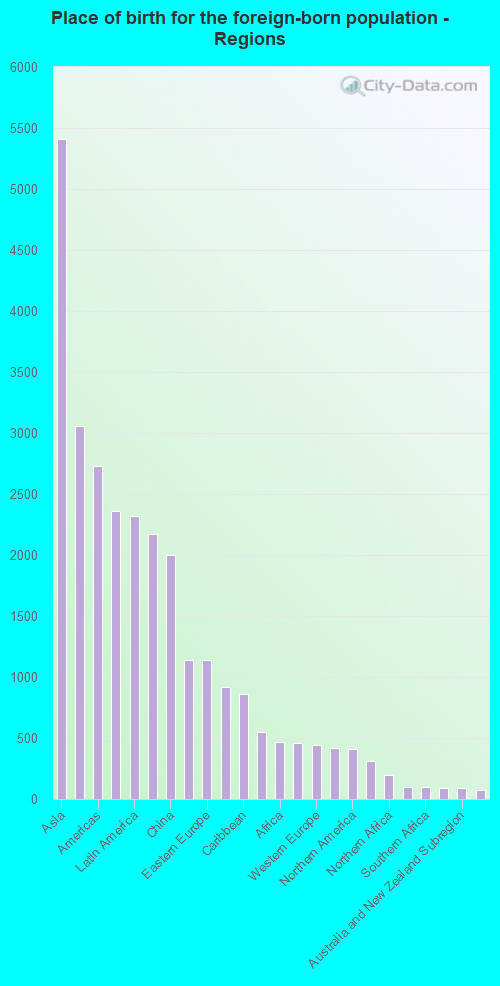
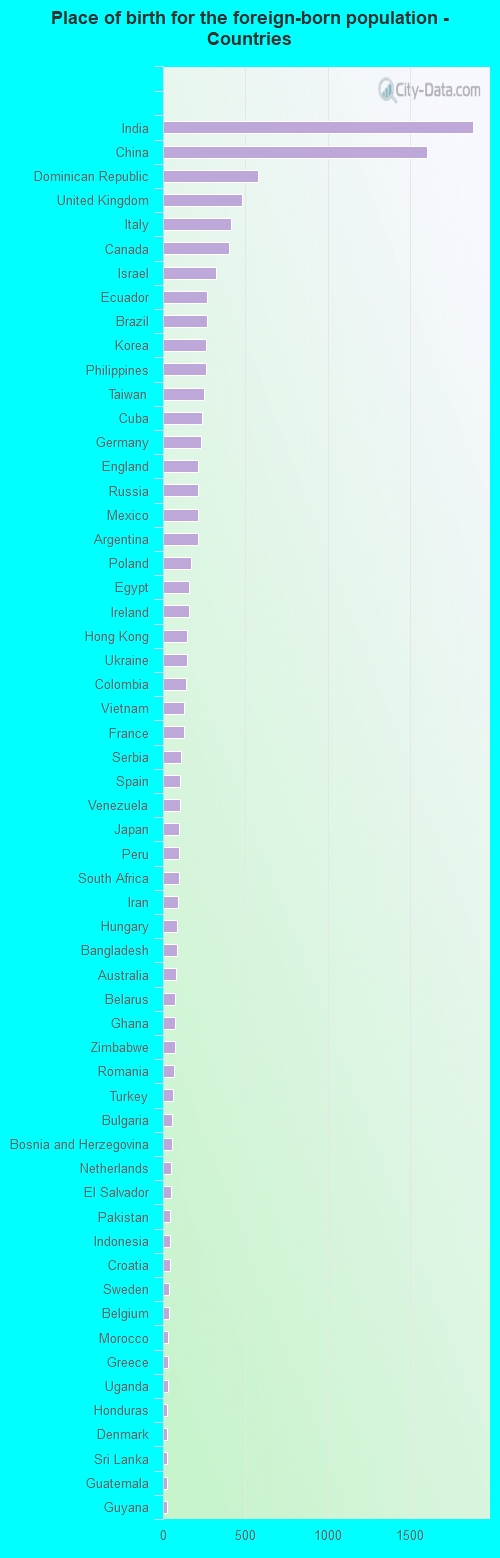
Place of birth for residents in Hoboken 5,408 Asia3,056 Europe2,732 Americas2,359 Eastern Asia2,320 Latin America2,171 South Central Asia1,998 China1,140 South America1,138 Eastern Europe916 Northern Europe864 Caribbean550 Southern Europe469 Africa457 South Eastern Asia444 Western Europe419 Western Asia412 Northern America315 Central America197 Northern Africa100 Eastern Africa98 Southern Africa92 Oceania92 Australia and New Zealand Subregion73 Western Africa1,886 India1,602 China575 Dominican Republic478 United Kingdom413 Italy403 Canada321 Israel270 Ecuador268 Brazil260 Korea259 Philippines248 Taiwan236 Cuba232 Germany215 England213 Russia212 Mexico210 Argentina170 Poland158 Egypt157 Ireland148 Hong Kong143 Ukraine142 Colombia130 Vietnam125 France109 Serbia106 Spain104 Venezuela100 Japan100 Peru98 South Africa94 Iran87 Hungary85 Bangladesh78 Australia74 Belarus73 Ghana72 Zimbabwe69 Romania61 Turkey56 Bulgaria55 Bosnia and Herzegovina51 Netherlands50 El Salvador43 Pakistan43 Indonesia40 Croatia37 Sweden34 Belgium29 Morocco29 Greece28 Uganda27 Honduras26 Denmark26 Sri Lanka24 Guatemala22 Guyana17 Bahamas17 Trinidad and Tobago16 Lebanon16 Jamaica15 Malaysia14 New Zealand14 Lithuania13 United Arab Emirates13 Uzbekistan12 Uruguay12 North Macedonia (Macedonia)9 Bolivia9 Singapore8 Moldova8 Iraq1 Haiti