Highland, CA (California) Houses and Residents
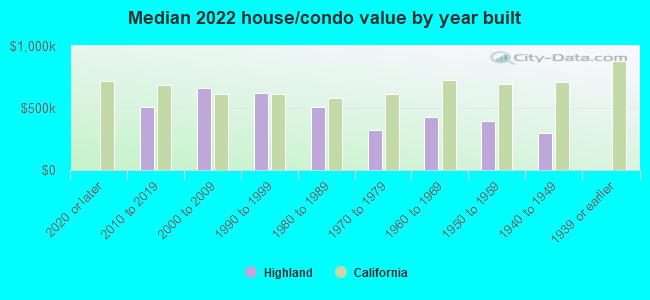
| Highland: | $481,829 |
| California: | $715,900 |
Mean price in 2022:
Detached houses: $445,474
Here: $445,474 State: $988,808 Townhouses or other attached units: $356,279
Here: $356,279 State: $838,546 In 2-unit structures: $268,149
Here: $268,149 State: $1,138,100 In 5-or-more-unit structures: $211,505
Here: $211,505 State: $730,996 Mobile homes: $55,597
Here: $55,597 State: $184,506 Occupied boats, RVs, vans, etc.: $171,075
Here: $171,075 State: $204,957
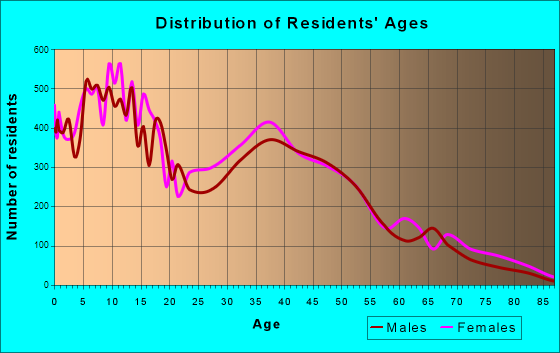
Total population: 54,651 (Urban population: 43,697, Rural population: 932 (all nonfarm))
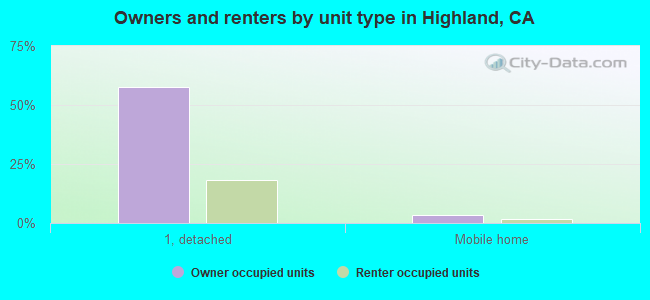
Houses: 17,078 (16,666 occupied: 11,159 owner occupied, 5,660 renter occupied)
| % of renters here: | 34% |
| State: | 44% |
Housing density: 1,253 houses/condos per square mile
Median price asked for vacant for-sale houses and condos in 2022: $225,825.
Median contract rent in 2022: $1,262 (lower quartile is $973, upper quartile is $1,728)
Median rent asked for vacant for-rent units in 2022: $1,798
Median gross rent in Highland, CA in 2022: $1,404
Housing units in Highland with a mortgage: 7,730 (410 second mortgage, 5 home equity loan, 348 both second mortgage and home equity loan)
Houses without a mortgage: 0
Median household income for houses/condos with a mortgage: $108,023
Median household income for apartments without a mortgage: $76,245
Median monthly housing costs: $1,523
Compare current foreclosures in Highland, CA:
| Photo | Address | Area | Beds / Baths | Price | Details |
|---|---|---|---|---|---|

|
#1
Watson Ct
Highland, CA 92346
|
2,888 sq. feet
|
3 baths 5 beds |
show details | |

|
#2
Kane Ct
Highland, CA 92346
|
1,699 sq. feet
|
2 baths 4 beds |
show details | |

|
#3
Greenbrier Pl
Highland, CA 92346
|
2,751 sq. feet
|
3 baths 4 beds |
show details | |

|
#4
Winthrop Way
Highland, CA 92346
|
1,437 sq. feet
|
2 baths 4 beds |
show details | |

|
#5
Peacock Ave
Highland, CA 92346
|
1,460 sq. feet
|
2 baths 3 beds |
show details | |

|
#6
Highland Ave Spc 43
Highland, CA 92346
|
1,020 sq. feet
|
2 baths 2 beds |
show details | |

|
#7
Yellow Jasmine Dr
Highland, CA 92346
|
2,434 sq. feet
|
3 baths 4 beds |
show details | |

|
#8
Villa Ct
Highland, CA 92346
|
1,546 sq. feet
|
2 baths 4 beds |
show details | |

|
#9
Jasmine Pl
Highland, CA 92346
|
2,052 sq. feet
|
3 baths 4 beds |
show details | |

|
#10
Los Feliz Dr
Highland, CA 92346
|
2,033 sq. feet
|
2 baths 3 beds |
show details |
| Photo | Address | Area | Beds / Baths | Price | Details |
|---|---|---|---|---|---|

|
#11
Clifton Ave
Highland, CA 92346
|
1,330 sq. feet
|
2 baths 4 beds |
show details | |

|
#12
Olive Tree Ln
Highland, CA 92346
|
1,430 sq. feet
|
1 baths 2 beds |
show details | |

|
#13
Tiara Ave
Highland, CA 92346
|
2,244 sq. feet
|
3 baths 5 beds |
show details | |

|
#14
Valaria Ct
Highland, CA 92346
|
1,886 sq. feet
|
3 baths 4 beds |
show details | |

|
#15
Bruce St
Highland, CA 92346
|
1,363 sq. feet
|
1 baths 3 beds |
show details | |

|
#16
Greenbrier Pl
Highland, CA 92346
|
2,052 sq. feet
|
3 baths 4 beds |
show details | |

|
#17
Highland Spring Ln
Highland, CA 92346
|
2,130 sq. feet
|
2 baths 3 beds |
show details | |

|
#18
Buena Vista Ln
Highland, CA 92346
|
2,656 sq. feet
|
2 baths 4 beds |
show details | |

|
#19
Tiara Ave
Highland, CA 92346
|
3,917 sq. feet
|
3 baths 5 beds |
show details | |

|
#20
Laurel Ave
Highland, CA 92346
|
1,365 sq. feet
|
2 baths 4 beds |
show details |
| Photo | Address | Area | Beds / Baths | Price | Details |
|---|---|---|---|---|---|

|
#21
Browning Rd
Highland, CA 92346
|
1,708 sq. feet
|
2 baths 2 beds |
show details | |

|
#22
Tiffani Pl
Highland, CA 92346
|
1,703 sq. feet
|
2 baths 3 beds |
show details | |

|
#23
Bella Terra Ave
Highland, CA 92346
|
- sq. feet
|
- baths - beds |
show details | |

|
#24
Streater Ave
Highland, CA 92346
|
- sq. feet
|
- baths - beds |
show details | |

|
#25
Baseline St Spc 29
Highland, CA 92346
|
- sq. feet
|
- baths - beds |
show details | |

|
#26
Fenwick Way
Highland, CA 92346
|
- sq. feet
|
- baths - beds |
show details | |

|
#27
Victoria Ave Apt 112
Highland, CA 92346
|
- sq. feet
|
- baths - beds |
show details | |

|
#28
Cypress St
Highland, CA 92346
|
- sq. feet
|
- baths - beds |
show details | |

|
#29
Mirada Rd
Highland, CA 92346
|
- sq. feet
|
- baths - beds |
show details | |

|
#30
Vista Rio
Highland, CA 92346
|
- sq. feet
|
- baths - beds |
show details |
| Photo | Address | Area | Beds / Baths | Price | Details |
|---|---|---|---|---|---|

|
#31
Indian Canyon Ct
Highland, CA 92346
|
- sq. feet
|
- baths - beds |
show details | |

|
#32
Pepper Dr
Highland, CA 92346
|
- sq. feet
|
- baths - beds |
show details | |

|
#33
Central Ave Apt 66
Highland, CA 92346
|
- sq. feet
|
- baths - beds |
show details | |

|
#34
Via Deldene
Highland, CA 92346
|
- sq. feet
|
- baths - beds |
show details | |

|
Check over 1 million property listings on Foreclosure.com!
|
browse all offers | |||

Latest news about housing in Highland, CA collected exclusively by city-data.com from local newspapers, TV, and radio stations

 | Rent condo in highland or san bernardino (3 replies) |
| Looking for our First Home: Highland, Rancho Cucamonga, San Dimas, Redlands... (5 replies) |
| Buying a house for under 1.3. Highland Park, Van Nuys, or Burbank? (6 replies) |
| Tiny Lots - Not so Tiny Houses - NELA (11 replies) |
| Seeking advice on Highland Park houses (4 replies) |
| Houses in East Highland Area (5 replies) |
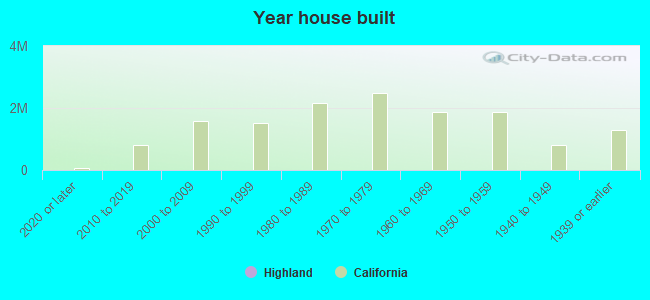
Median year apartment built: 1979
Household type by relationship:
Households: 57,129- Male householders: 7,969 (978 living alone), Female householders: 8,593 (1,345 living alone)
8,553 spouses (8,535 opposite-sex spouses), 1,734 unmarried partners, (1,654 opposite-sex unmarried partners), 20,458 children (19,473 natural, 265 adopted, 719 stepchildren), 2,422 grandchildren, 1,106 brothers or sisters, 1,161 parents, 0 foster children, 2,502 other relatives, 2,433 non-relatives
- In group quarters: 194
Size of family households: 4,092 2-persons, 3,373 3-persons, 2,361 4-persons, 2,293 5-persons, 468 6-persons, 978 7-or-more-persons.
Size of nonfamily households: 2,300 1-person, 616 2-persons, 269 3-persons, 90 4-persons, 77 7-or-more-persons.
7,596 married couples with children.
4,784 single-parent households (1,697 men, 3,087 women).
50.9% of residents of Highland speak English at home.
41.5% of residents speak Spanish at home (68% speak English very well, 11% speak English well, 12% speak English not well, 8% don't speak English at all).
1.6% of residents speak other Indo-European language at home (62% speak English very well, 21% speak English well, 7% speak English not well, 10% don't speak English at all).
6.0% of residents speak Asian or Pacific Island language at home (63% speak English very well, 20% speak English well, 13% speak English not well, 4% don't speak English at all).
0.3% of residents speak other language at home (79% speak English very well, 6% speak English well, 15% speak English not well).
Foreign born population: 13,441 (23.5%)
(46.6% of them are naturalized citizens)
| Here: | 6.1 |
| State: | 6.0 |
| Here: | 4.5 |
| State: | 3.9 |
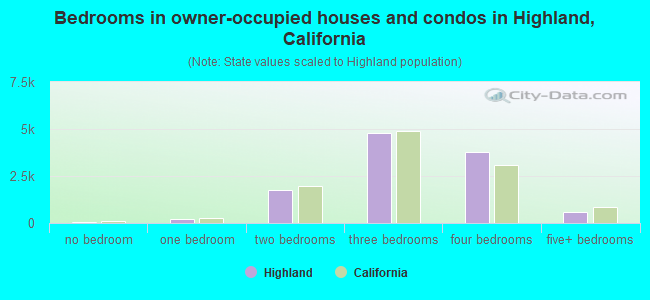
- Bedrooms in owner-occupied houses and condos in Highland, California
- 53no bedroom
- 2121 bedroom
- 1,7502 bedrooms
- 4,7873 bedrooms
- 3,7604 bedrooms
- 5975+ bedrooms
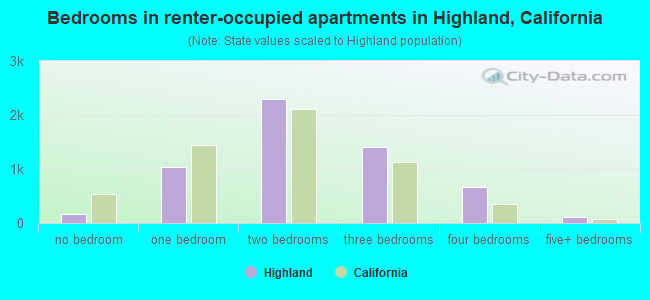
- Bedrooms in renter-occupied apartments in Highland, California
- 163no bedroom
- 1,0381 bedroom
- 2,2912 bedrooms
- 1,4003 bedrooms
- 6604 bedrooms
- 1085+ bedrooms
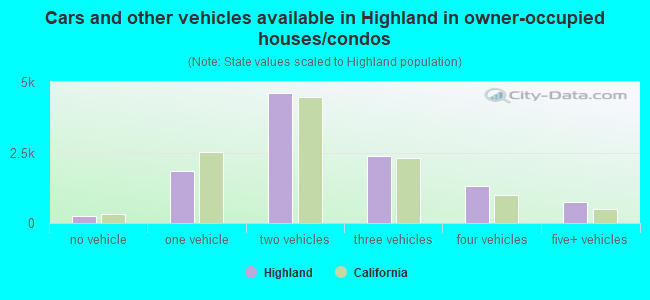
- Cars and other vehicles available in Highland in owner-occupied houses/condos
- 246no vehicle
- 1,8271 vehicle
- 4,6182 vehicles
- 2,3893 vehicles
- 1,3264 vehicles
- 7545+ vehicles
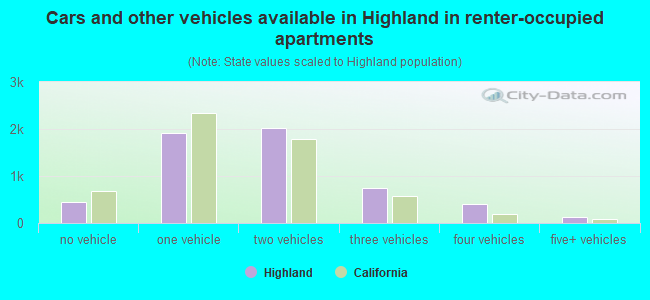
- Cars and other vehicles available in Highland in renter-occupied apartments
- 450no vehicle
- 1,9201 vehicle
- 2,0232 vehicles
- 7533 vehicles
- 3944 vehicles
- 1225+ vehicles
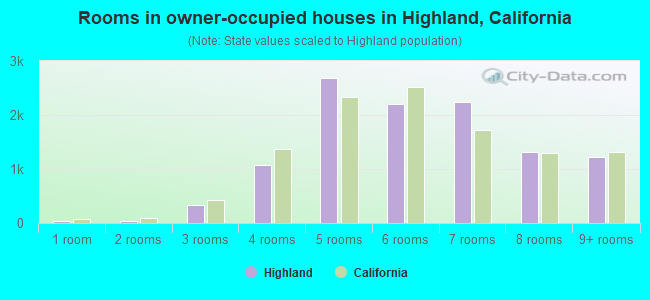
- Rooms in owner-occupied houses in Highland, California
- 351 room
- 362 rooms
- 3333 rooms
- 1,0734 rooms
- 2,6945 rooms
- 2,2116 rooms
- 2,2417 rooms
- 1,3188 rooms
- 1,2199+ rooms
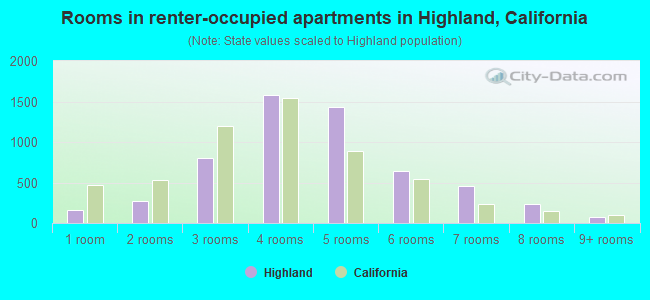
- Rooms in renter-occupied apartments in Highland, California
- 1631 room
- 2712 rooms
- 8083 rooms
- 1,5824 rooms
- 1,4315 rooms
- 6466 rooms
- 4517 rooms
- 2348 rooms
- 759+ rooms
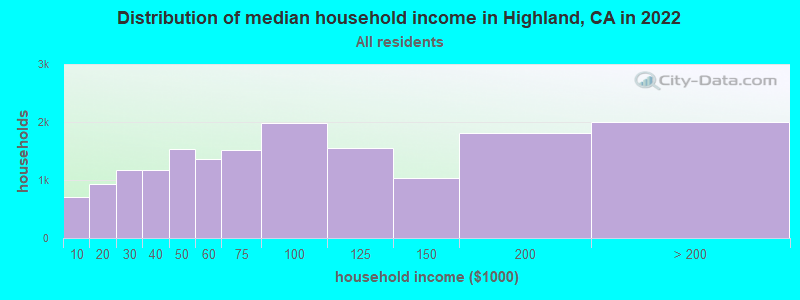
Highland, CA household income distribution

- 709Less than $10,000
- 940$10,000 to $19,999
- 1,167$20,000 to $29,999
- 1,179$30,000 to $39,999
- 1,530$40,000 to $49,999
- 1,358$50,000 to $59,999
- 1,526$60,000 to $74,999
- 1,978$75,000 to $99,999
- 1,546$100,000 to $124,999
- 1,044$125,000 to $149,999
- 1,815$150,000 to $199,999
- 2,002$200,000 or more
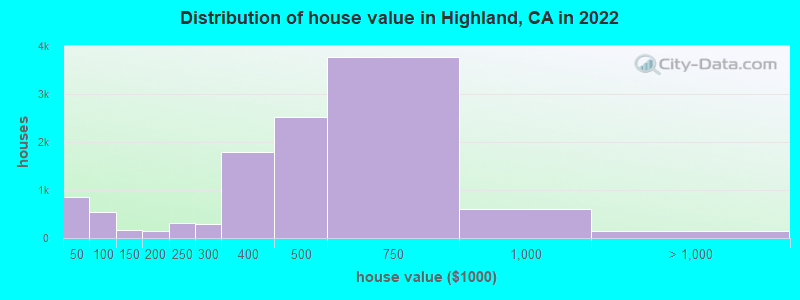
Home value of owner - occupied houses in 2022 in Highland, CA
-
- 237Less than $10,000
- 84$10,000 to $14,999
- 43$15,000 to $19,999
- 104$20,000 to $24,999
- 75$25,000 to $29,999
- 211$30,000 to $34,999
- 14$35,000 to $39,999
- 74$40,000 to $49,999
- 173$50,000 to $59,999
- 62$60,000 to $69,999
- 49$70,000 to $79,999
- 178$80,000 to $89,999
- 129$100,000 to $124,999
- 45$125,000 to $149,999
- 21$150,000 to $174,999
- 121$175,000 to $199,999
- 312$200,000 to $249,999
- 290$250,000 to $299,999
- 1,799$300,000 to $399,999
- 2,521$400,000 to $499,999
- 3,779$500,000 to $749,999
- 595$750,000 to $999,999
- 104$1,000,000 to $1,499,999
- 39$2,000,000 or more
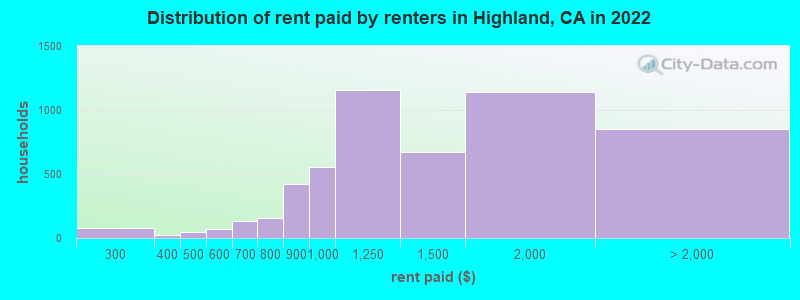
Rent paid by renters in 2022 in Highland, CA
-
- 68$200 to $249
- 5$250 to $299
- 23$300 to $349
- 48$450 to $499
- 32$500 to $549
- 35$550 to $599
- 50$600 to $649
- 78$650 to $699
- 92$700 to $749
- 63$750 to $799
- 424$800 to $899
- 554$900 to $999
- 1,154$1,000 to $1,249
- 671$1,250 to $1,499
- 1,136$1,500 to $1,999
- 529$2,000 to $2,499
- 141$2,500 to $2,999
- 19$3,000 to $3,499
- 162No cash rent
Percentage of workers working in this county: 83.3%
Number of people working at home: 1,786 (7.0% of all workers)
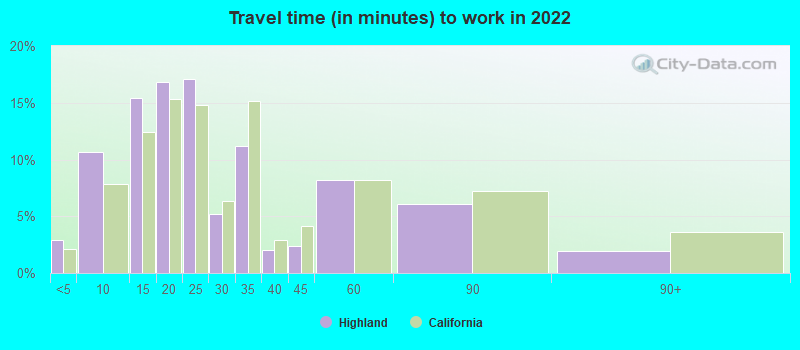
Travel time to work (commute)
- Less than 5 minutes: 400
- 5 to 9 minutes: 1,197
- 10 to 14 minutes: 3,681
- 15 to 19 minutes: 4,712
- 20 to 24 minutes: 3,450
- 25 to 29 minutes: 1,034
- 30 to 34 minutes: 3,568
- 35 to 39 minutes: 500
- 40 to 44 minutes: 421
- 45 to 59 minutes: 1,731
- 60 to 89 minutes: 1,970
- 90 or more minutes: 1,044
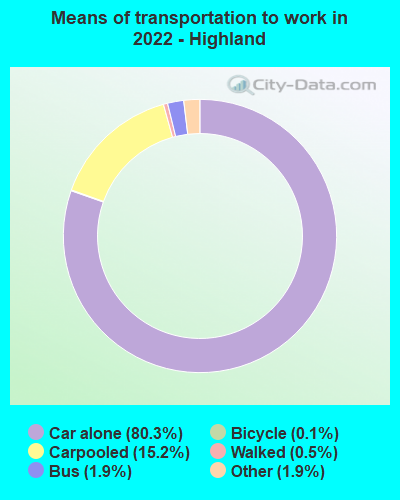
Means of transportation to work:
- Drove a car alone: 7,437 (67.2%)
- Carpooled: 1,508 (13.6%)
- Bus: 182 (1.6%)
- Taxi: 202 (1.8%)
- Bicycle: 8 (0.1%)
- Walked: 54 (0.5%)
- Worked at home: 1,786 (16.1%)
- Unemployment by race in 2022
- Unemployment rate for White non-Hispanic residents
- 6.4%Males
- 4.7%Females
- Unemployment rate for Black residents
- 10.8%Males
- Unemployment rate for American Indian and Alaska Native residents
- 6.5%Males
- Unemployment rate for Asian residents
- 1.6%Males
- 2.7%Females
- Unemployment rate for other race residents
- 2.8%Males
- 1.6%Females
- Unemployment rate for two or more race residents
- 11.8%Males
- 12.2%Females
- Unemployment rate for Hispanic or Latino residents
- 4.5%Males
- 5.9%Females
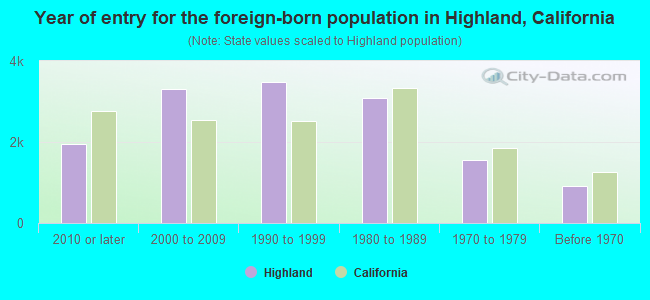
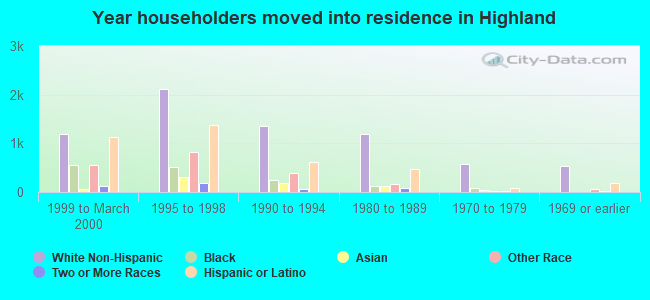
- Year of entry for the foreign-born population in Highland, California
- 1,9392010 or later
- 3,3112000 to 2009
- 3,4841990 to 1999
- 3,0821980 to 1989
- 1,5571970 to 1979
- 902Before 1970
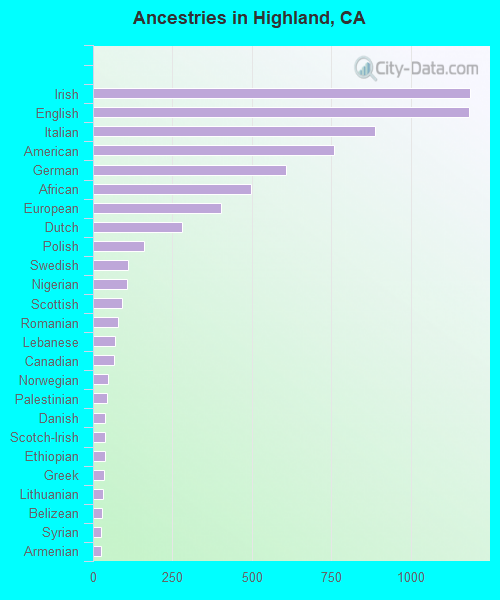
First ancestries reported:
- Irish: 1,187 (3.0%)
- English: 1,184 (3.0%)
- Italian: 886 (2.3%)
- American: 760 (2.0%)
- German: 607 (1.6%)
- African: 498 (1.3%)
- European: 403 (1.0%)
- Dutch: 281 (0.7%)
- Polish: 160 (0.4%)
- Swedish: 109 (0.3%)
- Nigerian: 108 (0.3%)
- Scottish: 92 (0.2%)
- Romanian: 80 (0.2%)
- Lebanese: 70 (0.2%)
- Canadian: 65 (0.2%)
- Norwegian: 47 (0.1%)
- Palestinian: 45 (0.1%)
- Danish: 39 (0.1%)
- Scotch-Irish: 38 (0.10%)
- Ethiopian: 37 (0.09%)
- Greek: 35 (0.09%)
- Lithuanian: 31 (0.08%)
- Belizean: 28 (0.07%)
- Syrian: 25 (0.06%)
- Armenian: 24 (0.06%)
- Croatian: 20 (0.05%)
- Moroccan: 19 (0.05%)
- Hungarian: 17 (0.04%)
- French: 16 (0.04%)
- Ukrainian: 16 (0.04%)
- Arab: 14 (0.04%)
- Austrian: 12 (0.03%)
- Russian: 12 (0.03%)
- Soviet Union: 10 (0.03%)
- Czechoslovakian: 9 (0.02%)
- Latvian: 7 (0.02%)
- Eastern European: 7 (0.02%)
- British: 6 (0.02%)
- Scandinavian: 6 (0.02%)
- Swiss: 6 (0.02%)
Most common places of birth for foreign-born residents (%):
| Highland: | 59.9% (7,845) |
| California: | 37.2% (3,881,193) |
| Highland: | 8.3% (1,092) |
| California: | 4.9% (512,335) |
| Highland: | 4.9% (640) |
| California: | 7.8% (818,297) |
| Highland: | 3.6% (473) |
| California: | 5.2% (539,184) |
| Highland: | 2.7% (357) |
| California: | 4.2% (440,287) |
| Highland: | 2.7% (355) |
| California: | 2.8% (290,436) |
| Highland: | 1.6% (210) |
| California: | 0.2% (16,998) |
Place of birth for U.S.-born residents:
- This state: 38,357
- Other state: 4,947
- Northeast: 1,022
- Midwest: 1,295
- South: 1,651
- West: 974
92.4% of Highland residents lived in the same house 1 years ago.
Out of people who lived in different houses, 42.5% lived in this county.
Out of people who lived in different counties, 61.2% lived in California.
| Highland: | 92.4% |
| State average: | 88.9% |
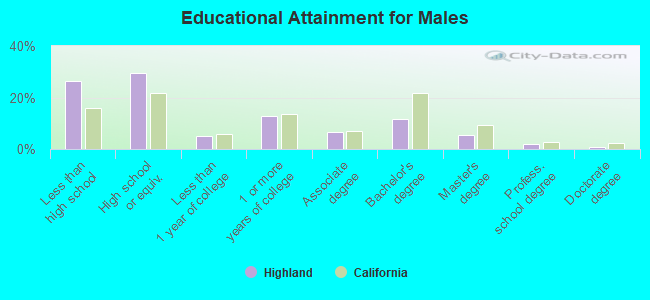
Education attainment for males 25 years and older:
- No schooling: 646
- Nursery to 4th grade: 483
- 5th and 6th grade: 921
- 7th and 8th grade: 154
- 9th grade: 733
- 10th grade: 434
- 11th grade: 618
- 12th grade, no diploma: 591
- High school graduate (or equivalency): 5,107
- Less than 1 year of college: 862
- Some college more than 1 year, no degree: 2,213
- Associate degree: 1,172
- Bachelor's degree: 1,998
- Master's degree: 976
- Professional school degree: 321
- Doctorate degree: 159
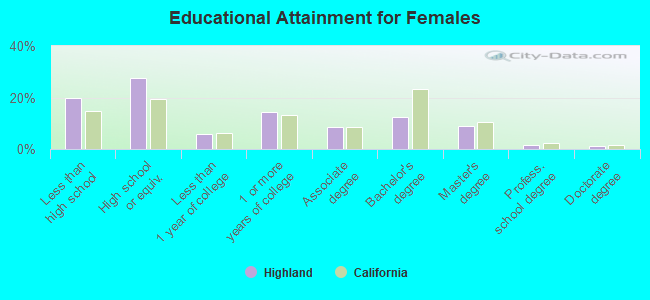
Education attainment for females 25 years and older:
- No schooling: 797
- Nursery to 4th grade: 183
- 5th and 6th grade: 550
- 7th and 8th grade: 431
- 9th grade: 429
- 10th grade: 203
- 11th grade: 448
- 12th grade, no diploma: 553
- High school graduate (or equivalency): 4,989
- Less than 1 year of college: 1,051
- Some college more than 1 year, no degree: 2,587
- Associate degree: 1,511
- Bachelor's degree: 2,225
- Master's degree: 1,605
- Professional school degree: 264
- Doctorate degree: 220
Housing units in structures:
- One, detached: 12,767
- One, attached: 363
- Two: 99
- 3 or 4: 398
- 5 to 9: 430
- 10 to 19: 323
- 20 to 49: 455
- 50 or more: 969
- Mobile homes: 1,231
- Boats, RVs, vans, etc.: 38
Median worth of mobile homes: $45,490
Housing units lacking complete kitchen facilities in 2022: 1.9%
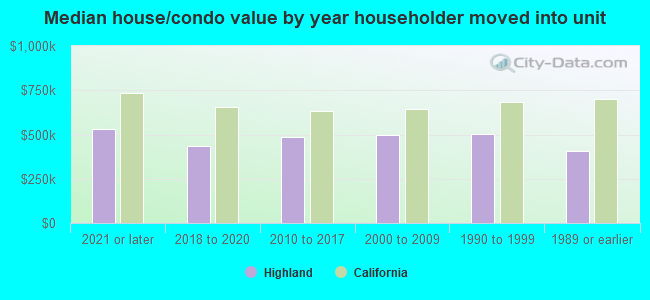
House/condo owner moved in on average 13 years ago
Renter moved in on average 3 years ago
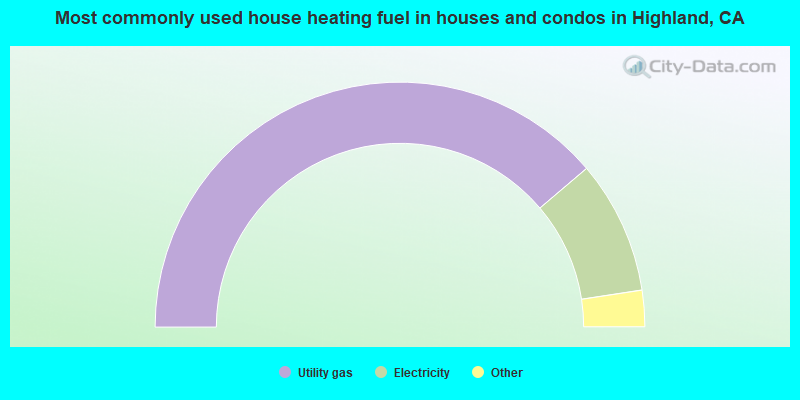
- 77.5%Utility gas
- 17.6%Electricity
- 1.5%Bottled, tank, or LP gas
- 1.5%No fuel used
- 1.2%Solar energy
- 0.2%Coal or coke
- 0.2%Wood
- 0.1%Other fuel
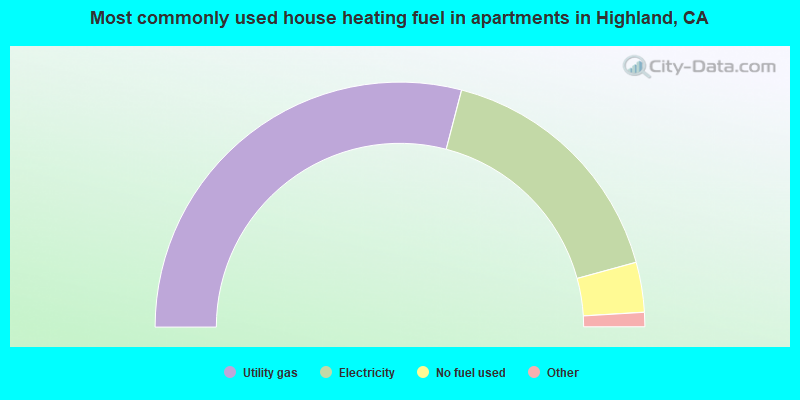
- 58.1%Utility gas
- 33.4%Electricity
- 6.6%No fuel used
- 1.7%Bottled, tank, or LP gas
- 0.2%Wood
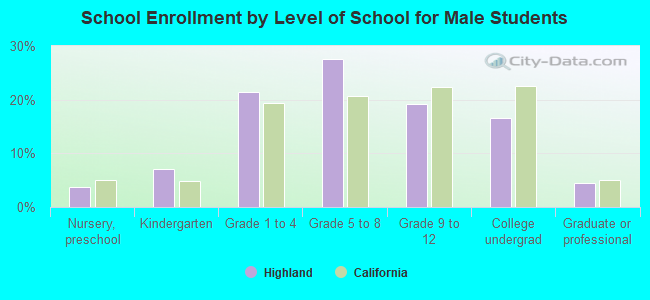
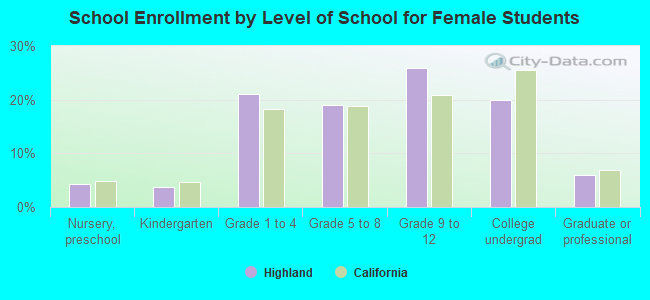
Private vs. public school enrollment:
| Here: | 3.8% |
| California: | 10.5% |
| Here: | 5.0% |
| California: | 8.5% |
| Here: | 16.3% |
| California: | 15.9% |