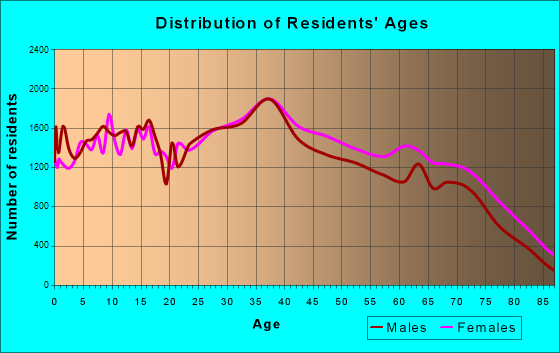
Hialeah, FL (Florida) Houses and Residents
| Hialeah: | $369,100 |
| Florida: | $354,100 |
Mean price in 2022:
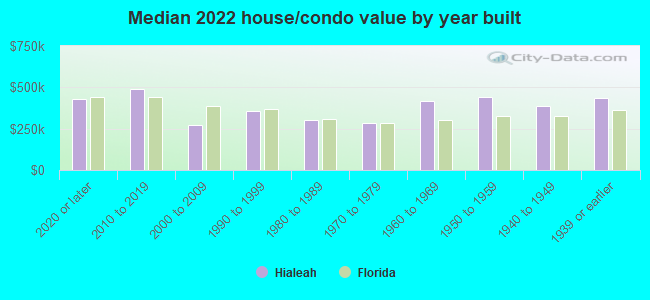
Detached houses: $443,712
Here: $443,712 State: $500,941 Townhouses or other attached units: $359,479
Here: $359,479 State: $370,869 In 2-unit structures: $291,366
Here: $291,366 State: $423,188 In 3-to-4-unit structures: $217,091
Here: $217,091 State: $309,944 In 5-or-more-unit structures: $299,723
Here: $299,723 State: $447,145 Mobile homes: $56,810
Here: $56,810 State: $113,202
Total population: 235,563 (Urban population: 226,411, Rural population: 0)
Houses: 80,412 (78,015 occupied: 37,857 owner occupied, 40,158 renter occupied)
| % of renters here: | 51% |
| State: | 33% |
Housing density: 4,179 houses/condos per square mile
Median price asked for vacant for-sale houses and condos in 2022: $378,263.
Median contract rent in 2022: $1,371 (lower quartile is $1,075, upper quartile is $1,737)
Median rent asked for vacant for-rent units in 2022: $2,074
Median gross rent in Hialeah, FL in 2022: $1,521
Housing units in Hialeah with a mortgage: 20,210 (1,159 second mortgage, 0 home equity loan, 1,017 both second mortgage and home equity loan)
Houses without a mortgage: 508
Median household income for houses/condos with a mortgage: $77,609
Median household income for apartments without a mortgage: $39,089
Median monthly housing costs: $1,420
Compare current foreclosures in Hialeah, FL:
| Photo | Address | Area | Beds / Baths | Price | Details |
|---|---|---|---|---|---|

|
#1
W 6th Ave
Hialeah, FL 33014
|
780 sq. feet
|
1 baths 2 beds |
show details | |

|
#2
W 28th Ct Unit 106
Hialeah, FL 33018
|
850 sq. feet
|
2 baths 2 beds |
show details | |

|
#3
Brookline Dr
Hialeah, FL 33015
|
1,752 sq. feet
|
2 baths 2 beds |
show details | |

|
#4
E 20th St
Hialeah, FL 33013
|
1,444 sq. feet
|
1 baths 2 beds |
show details | |

|
#5
E 9th Ct
Hialeah, FL 33013
|
1,541 sq. feet
|
1 baths 3 beds |
show details | |

|
#6
NW 153rd Ter
Hialeah, FL 33018
|
2,560 sq. feet
|
3 baths 5 beds |
show details | |

|
#7
W 33rd St
Hialeah, FL 33012
|
1,723 sq. feet
|
1 baths 3 beds |
show details | |

|
#8
E 2nd Ave
Hialeah, FL 33013
|
1,214 sq. feet
|
2 baths 3 beds |
show details | |

|
#9
NW 185th St
Hialeah, FL 33015
|
1,174 sq. feet
|
2 baths 3 beds |
show details | |

|
#10
W 2nd Ave
Hialeah, FL 33012
|
1,175 sq. feet
|
1 baths 3 beds |
show details |
| Photo | Address | Area | Beds / Baths | Price | Details |
|---|---|---|---|---|---|

|
#11
W 68th Pl
Hialeah, FL 33018
|
1,431 sq. feet
|
2 baths 3 beds |
show details | |

|
#12
W 56th St
Hialeah, FL 33012
|
1,250 sq. feet
|
1 baths 2 beds |
show details | |

|
#13
E 20th St
Hialeah, FL 33010
|
1,099 sq. feet
|
1 baths 2 beds |
show details | |

|
#14
NW 174th Ter
Hialeah, FL 33015
|
1,244 sq. feet
|
2 baths 3 beds |
show details | |

|
#15
E 43rd St
Hialeah, FL 33013
|
1,328 sq. feet
|
1 baths 2 beds |
show details | |

|
#16
W 31st St
Hialeah, FL 33012
|
1,860 sq. feet
|
2 baths 3 beds |
show details | |

|
#17
W 70th Pl
Hialeah, FL 33014
|
1,938 sq. feet
|
2 baths 3 beds |
show details | |

|
#18
E 9th Ct
Hialeah, FL 33013
|
1,348 sq. feet
|
1 baths 2 beds |
show details | |

|
#19
W 72nd St
Hialeah, FL 33018
|
1,141 sq. feet
|
2 baths 3 beds |
show details | |

|
#20
W 63rd St
Hialeah, FL 33012
|
939 sq. feet
|
2 baths 3 beds |
show details |
| Photo | Address | Area | Beds / Baths | Price | Details |
|---|---|---|---|---|---|

|
#21
W 14th St
Hialeah, FL 33010
|
2,234 sq. feet
|
1 baths 3 beds |
show details | |

|
#22
NW 201st Ter
Hialeah, FL 33015
|
2,499 sq. feet
|
2 baths 4 beds |
show details | |

|
#23
Lake George Ct
Hialeah, FL 33014
|
2,848 sq. feet
|
1 baths 3 beds |
show details | |

|
#24
W 31st St
Hialeah, FL 33012
|
1,283 sq. feet
|
2 baths 3 beds |
show details | |

|
#25
NW 126th Ter
Hialeah, FL 33018
|
1,350 sq. feet
|
2 baths 3 beds |
show details | |

|
#26
E 10th Ave
Hialeah, FL 33013
|
1,985 sq. feet
|
2 baths 3 beds |
show details | |

|
#27
W 45th Pl
Hialeah, FL 33012
|
1,690 sq. feet
|
2 baths 3 beds |
show details | |

|
#28
NW 198th Ter
Hialeah, FL 33015
|
1,839 sq. feet
|
2 baths 4 beds |
show details | |

|
#29
E 46th St
Hialeah, FL 33013
|
1,518 sq. feet
|
1 baths 2 beds |
show details | |

|
#30
E Palm Ct
Hialeah, FL 33013
|
1,239 sq. feet
|
2 baths 3 beds |
show details |
| Photo | Address | Area | Beds / Baths | Price | Details |
|---|---|---|---|---|---|

|
#31
NW 77th Pl
Hialeah, FL 33016
|
2,300 sq. feet
|
2 baths 3 beds |
show details | |

|
#32
NW 170th St
Hialeah, FL 33015
|
1,866 sq. feet
|
1 baths 3 beds |
show details | |

|
#33
NW 108th St
Hialeah, FL 33018
|
1,286 sq. feet
|
2 baths 3 beds |
show details | |

|
#34
W 63rd St
Hialeah, FL 33012
|
1,284 sq. feet
|
2 baths 3 beds |
show details | |

|
#35
NW 65th Ct
Hialeah, FL 33015
|
1,942 sq. feet
|
2 baths 3 beds |
show details | |

|
#36
NW 177th Ter
Hialeah, FL 33018
|
2,419 sq. feet
|
2 baths 3 beds |
show details | |

|
#37
NW 129th Ter
Hialeah, FL 33018
|
1,621 sq. feet
|
2 baths 3 beds |
show details | |

|
#38
NW 102nd Ct
Hialeah, FL 33018
|
1,398 sq. feet
|
2 baths 3 beds |
show details | |

|
#39
W 33rd Ln
Hialeah, FL 33018
|
1,435 sq. feet
|
2 baths 3 beds |
show details | |

|
#40
W 69th Pl
Hialeah, FL 33018
|
1,233 sq. feet
|
2 baths 3 beds |
show details |
| Photo | Address | Area | Beds / Baths | Price | Details |
|---|---|---|---|---|---|

|
#41
E 64th St
Hialeah, FL 33013
|
1,455 sq. feet
|
1 baths 1 beds |
show details | |

|
#42
W 14th St
Hialeah, FL 33010
|
3,659 sq. feet
|
1 baths 1 beds |
show details | |

|
#43
E 16th St
Hialeah, FL 33010
|
4,623 sq. feet
|
2 baths 2 beds |
show details | |

|
#44
W 1st Ave
Hialeah, FL 33012
|
2,846 sq. feet
|
3 baths 3 beds |
show details | |

|
#45
E 58th St
Hialeah, FL 33013
|
1,093 sq. feet
|
1 baths 3 beds |
show details | |

|
#46
NW 152nd Ln
Hialeah, FL 33018
|
1,956 sq. feet
|
2 baths 3 beds |
show details | |

|
#47
SE 6th Ave
Hialeah, FL 33010
|
1,871 sq. feet
|
2 baths 3 beds |
show details | |

|
#48
W 72nd Ter
Hialeah, FL 33018
|
1,416 sq. feet
|
2 baths 3 beds |
show details | |

|
#49
NW 92nd Ave
Hialeah, FL 33018
|
1,809 sq. feet
|
2 baths 3 beds |
show details | |

|
Check over 1 million property listings on Foreclosure.com!
|
browse all offers | |||

Latest news about housing in Hialeah, FL collected exclusively by city-data.com from local newspapers, TV, and radio stations


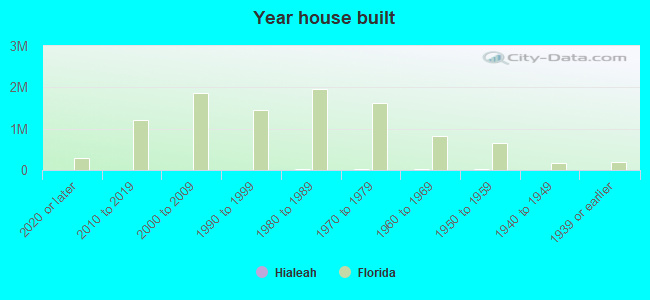
Median year apartment built: 1979
Household type by relationship:
Households: 220,274- Male householders: 34,568 (5,977 living alone), Female householders: 43,447 (10,219 living alone)
32,192 spouses (31,713 opposite-sex spouses), 12,178 unmarried partners, (11,476 opposite-sex unmarried partners), 54,126 children (51,285 natural, 504 adopted, 2,337 stepchildren), 6,698 grandchildren, 3,711 brothers or sisters, 12,685 parents, 62 foster children, 12,488 other relatives, 6,527 non-relatives
- In group quarters: 1,592
Size of family households: 18,290 2-persons, 15,970 3-persons, 11,779 4-persons, 5,689 5-persons, 2,584 6-persons, 1,480 7-or-more-persons.
Size of nonfamily households: 16,196 1-person, 5,620 2-persons, 253 3-persons, 59 5-persons, 95 7-or-more-persons.
15,575 married couples with children.
14,320 single-parent households (3,243 men, 11,077 women).
7.5% of residents of Hialeah speak English at home.
92.7% of residents speak Spanish at home (38% speak English very well, 15% speak English well, 22% speak English not well, 25% don't speak English at all).
0.6% of residents speak other Indo-European language at home (71% speak English very well, 14% speak English well, 15% speak English not well).
0.3% of residents speak Asian or Pacific Island language at home (34% speak English very well, 32% speak English well, 32% speak English not well, 2% don't speak English at all).
0.1% of residents speak other language at home (41% speak English very well, 59% speak English well).
Foreign born population: 161,430 (73.3%)
(56.6% of them are naturalized citizens)
| Here: | 5.2 |
| State: | 5.9 |
| Here: | 3.8 |
| State: | 4.2 |
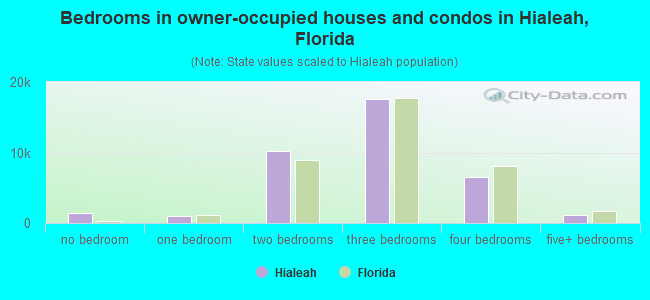
- Bedrooms in owner-occupied houses and condos in Hialeah, Florida
- 1,392no bedroom
- 1,0481 bedroom
- 10,1682 bedrooms
- 17,5663 bedrooms
- 6,5044 bedrooms
- 1,1795+ bedrooms
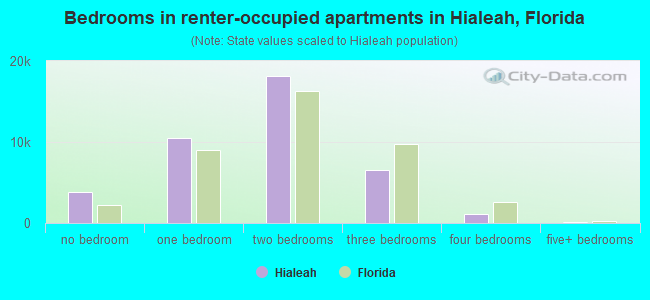
- Bedrooms in renter-occupied apartments in Hialeah, Florida
- 3,769no bedroom
- 10,4531 bedroom
- 18,1502 bedrooms
- 6,4943 bedrooms
- 1,1624 bedrooms
- 1305+ bedrooms
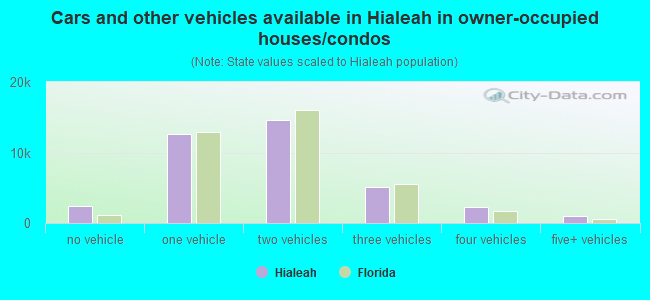
- Cars and other vehicles available in Hialeah in owner-occupied houses/condos
- 2,378no vehicle
- 12,6241 vehicle
- 14,5482 vehicles
- 5,0943 vehicles
- 2,2874 vehicles
- 9265+ vehicles
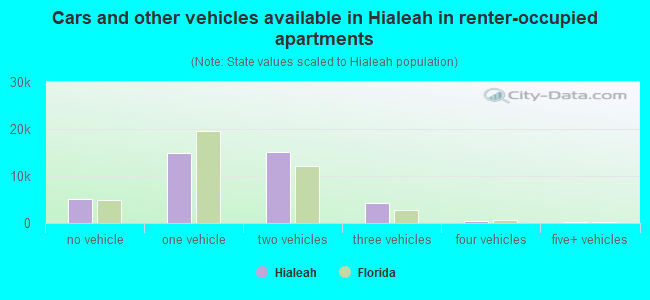
- Cars and other vehicles available in Hialeah in renter-occupied apartments
- 5,094no vehicle
- 14,8911 vehicle
- 15,1142 vehicles
- 4,2773 vehicles
- 5044 vehicles
- 2785+ vehicles
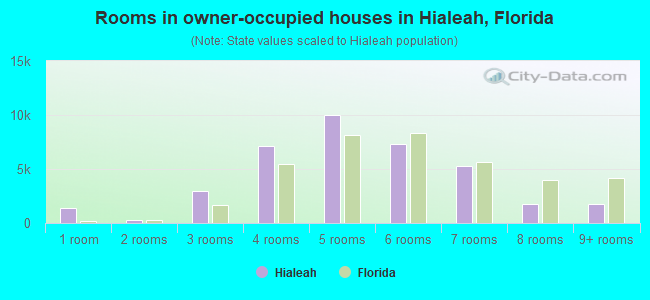
- Rooms in owner-occupied houses in Hialeah, Florida
- 1,3481 room
- 2962 rooms
- 2,9863 rooms
- 7,1554 rooms
- 10,0275 rooms
- 7,2866 rooms
- 5,2997 rooms
- 1,7148 rooms
- 1,7469+ rooms
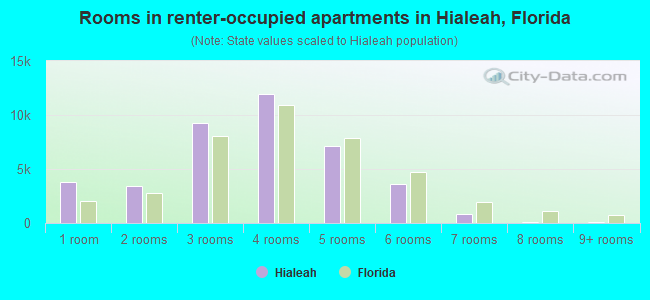
- Rooms in renter-occupied apartments in Hialeah, Florida
- 3,7691 room
- 3,3822 rooms
- 9,2633 rooms
- 11,9734 rooms
- 7,1355 rooms
- 3,5836 rooms
- 8137 rooms
- 1108 rooms
- 1309+ rooms
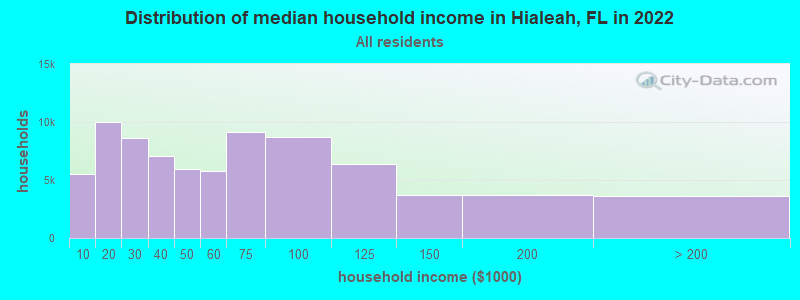
Hialeah, FL household income distribution

- 5,486Less than $10,000
- 10,004$10,000 to $19,999
- 8,618$20,000 to $29,999
- 7,076$30,000 to $39,999
- 5,908$40,000 to $49,999
- 5,733$50,000 to $59,999
- 9,111$60,000 to $74,999
- 8,673$75,000 to $99,999
- 6,377$100,000 to $124,999
- 3,709$125,000 to $149,999
- 3,734$150,000 to $199,999
- 3,586$200,000 or more
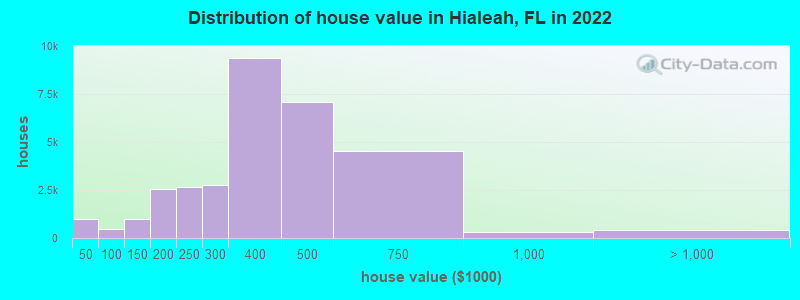
Home value of owner - occupied houses in 2022 in Hialeah, FL
-
- 414Less than $10,000
- 46$10,000 to $14,999
- 37$15,000 to $19,999
- 44$20,000 to $24,999
- 101$25,000 to $29,999
- 94$30,000 to $34,999
- 81$35,000 to $39,999
- 144$40,000 to $49,999
- 43$50,000 to $59,999
- 23$60,000 to $69,999
- 51$70,000 to $79,999
- 36$80,000 to $89,999
- 151$90,000 to $99,999
- 358$100,000 to $124,999
- 654$125,000 to $149,999
- 1,118$150,000 to $174,999
- 1,458$175,000 to $199,999
- 2,675$200,000 to $249,999
- 2,735$250,000 to $299,999
- 9,399$300,000 to $399,999
- 7,065$400,000 to $499,999
- 4,526$500,000 to $749,999
- 320$750,000 to $999,999
- 69$1,000,000 to $1,499,999
- 70$1,500,000 to $1,999,999
- 268$2,000,000 or more
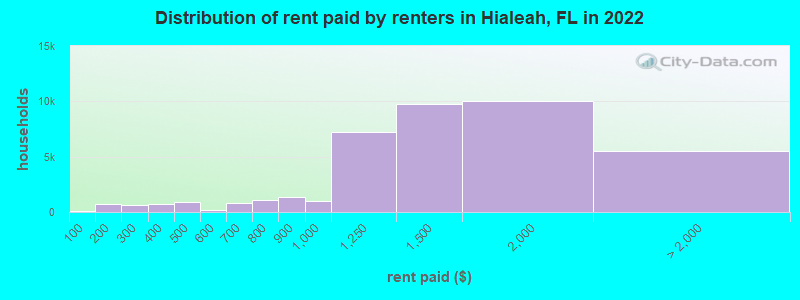
Rent paid by renters in 2022 in Hialeah, FL
-
- 129Less than $100
- 264$100 to $149
- 431$150 to $199
- 317$200 to $249
- 353$250 to $299
- 714$300 to $349
- 719$400 to $449
- 207$450 to $499
- 225$500 to $549
- 732$600 to $649
- 60$650 to $699
- 538$700 to $749
- 518$750 to $799
- 1,394$800 to $899
- 1,019$900 to $999
- 7,259$1,000 to $1,249
- 9,764$1,250 to $1,499
- 10,023$1,500 to $1,999
- 3,507$2,000 to $2,499
- 878$2,500 to $2,999
- 140$3,000 to $3,499
- 967No cash rent
Percentage of workers working in this county: 93.8%
Number of people working at home: 16,971 (15.3% of all workers)
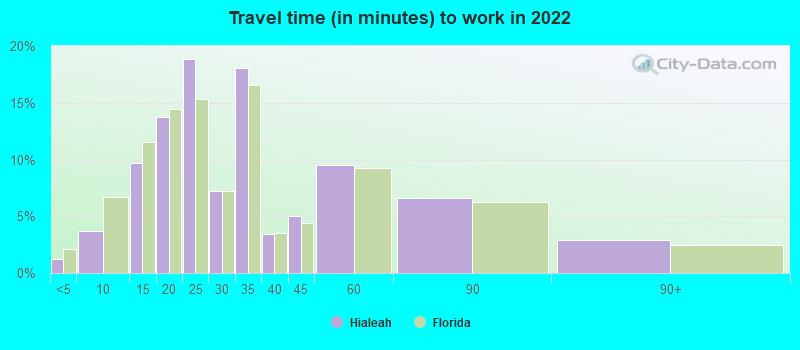
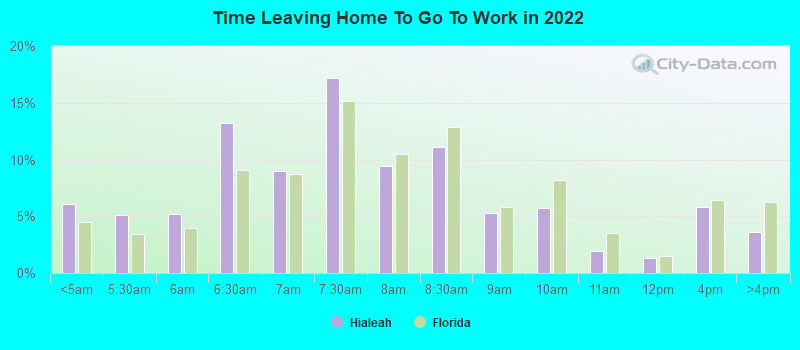
Travel time to work (commute)
- Less than 5 minutes: 810
- 5 to 9 minutes: 3,953
- 10 to 14 minutes: 7,656
- 15 to 19 minutes: 16,169
- 20 to 24 minutes: 15,732
- 25 to 29 minutes: 5,618
- 30 to 34 minutes: 16,573
- 35 to 39 minutes: 3,451
- 40 to 44 minutes: 6,912
- 45 to 59 minutes: 7,987
- 60 to 89 minutes: 7,004
- 90 or more minutes: 1,957
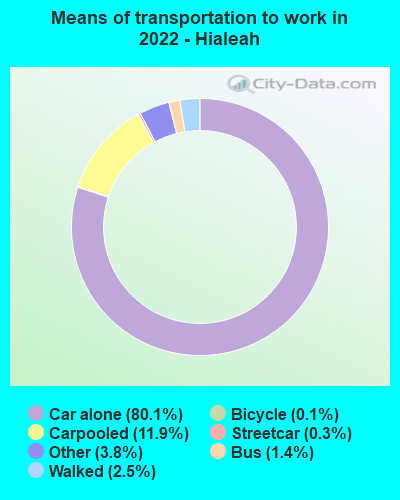
Means of transportation to work:
- Drove a car alone: 57,698 (64.8%)
- Carpooled: 8,545 (9.6%)
- Bus: 979 (1.1%)
- Subway or elevated rail: 225 (0.3%)
- Long-distance train or commuter rail: 49 (0.1%)
- Taxi: 2,714 (3.0%)
- Bicycle: 96 (0.1%)
- Walked: 1,768 (2.0%)
- Worked at home: 16,971 (19.1%)
- Unemployment by race in 2022
- Unemployment rate for White non-Hispanic residents
- 2.1%Males
- 0.1%Females
- Unemployment rate for Black residents
- 11.0%Males
- 11.1%Females
- Unemployment rate for Asian residents
- 6.0%Females
- Unemployment rate for other race residents
- 2.2%Males
- 2.1%Females
- Unemployment rate for two or more race residents
- 2.7%Males
- 3.9%Females
- Unemployment rate for Hispanic or Latino residents
- 2.7%Males
- 3.7%Females
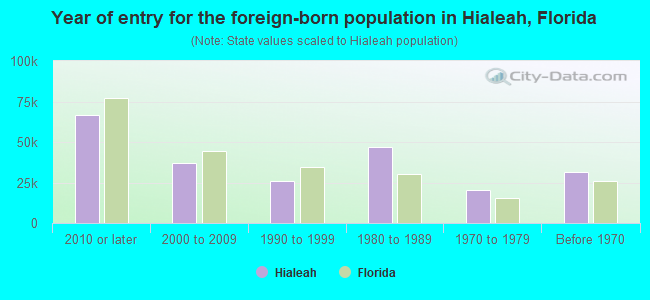
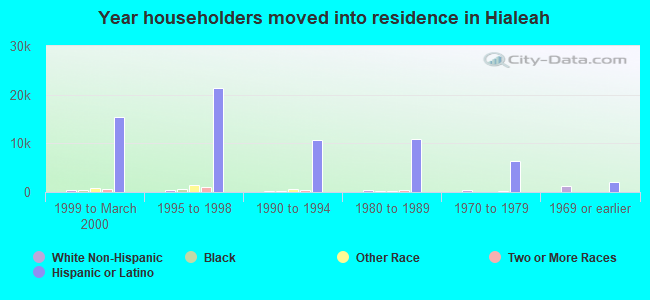
- Year of entry for the foreign-born population in Hialeah, Florida
- 66,6342010 or later
- 36,8262000 to 2009
- 25,6541990 to 1999
- 47,0901980 to 1989
- 20,1761970 to 1979
- 31,665Before 1970
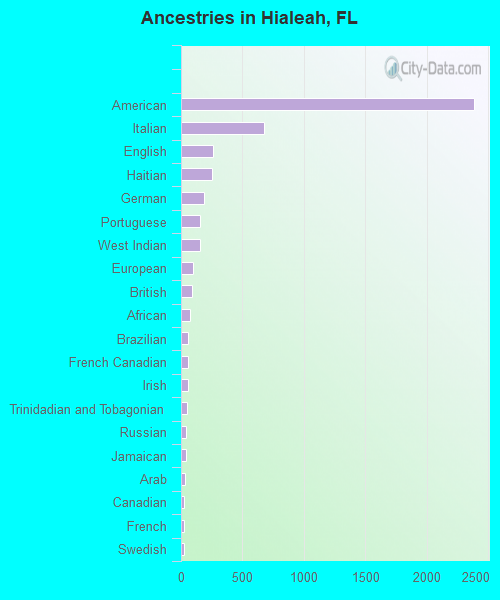
First ancestries reported:
- American: 2,385 (1.5%)
- Italian: 676 (0.4%)
- English: 259 (0.2%)
- Haitian: 254 (0.2%)
- German: 191 (0.1%)
- Portuguese: 155 (0.10%)
- West Indian: 154 (0.10%)
- European: 97 (0.06%)
- British: 92 (0.06%)
- African: 71 (0.05%)
- Brazilian: 57 (0.04%)
- French Canadian: 55 (0.04%)
- Irish: 54 (0.03%)
- Trinidadian and Tobagonian: 48 (0.03%)
- Russian: 42 (0.03%)
- Jamaican: 38 (0.02%)
- Arab: 33 (0.02%)
- Canadian: 27 (0.02%)
- French: 25 (0.02%)
- Swedish: 22 (0.01%)
- Lebanese: 19 (0.01%)
- Greek: 17 (0.01%)
- Serbian: 14 (0.01%)
- Lithuanian: 13 (0.01%)
- Polish: 13 (0.01%)
- Romanian: 13 (0.01%)
Most common places of birth for foreign-born residents (%):
| Hialeah: | 77.8% (128,494) |
| Florida: | 22.0% (1,006,576) |
| Hialeah: | 5.1% (8,461) |
| Florida: | 2.3% (105,066) |
| Hialeah: | 3.1% (5,141) |
| Florida: | 6.5% (298,669) |
| Hialeah: | 1.9% (3,137) |
| Florida: | 5.7% (262,042) |
| Hialeah: | 1.6% (2,701) |
| Florida: | 3.0% (137,727) |
| Hialeah: | 1.5% (2,484) |
| Florida: | 2.3% (107,160) |
Place of birth for U.S.-born residents:
- This state: 46,747
- Other state: 7,432
- Northeast: 4,523
- Midwest: 946
- South: 1,220
- West: 743
86.8% of Hialeah residents lived in the same house 1 years ago.
Out of people who lived in different houses, 44.4% lived in this county.
Out of people who lived in different counties, 38.6% lived in Florida.
| Hialeah: | 86.8% |
| State average: | 86.3% |
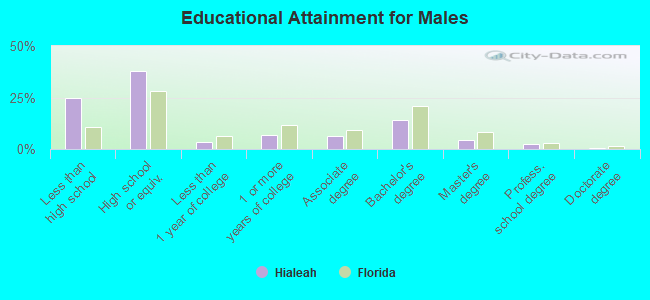
Education attainment for males 25 years and older:
- No schooling: 3,053
- Nursery to 4th grade: 751
- 5th and 6th grade: 2,436
- 7th and 8th grade: 1,351
- 9th grade: 5,095
- 10th grade: 1,027
- 11th grade: 795
- 12th grade, no diploma: 4,904
- High school graduate (or equivalency): 29,678
- Less than 1 year of college: 2,609
- Some college more than 1 year, no degree: 5,209
- Associate degree: 4,973
- Bachelor's degree: 11,214
- Master's degree: 3,286
- Professional school degree: 1,848
- Doctorate degree: 309
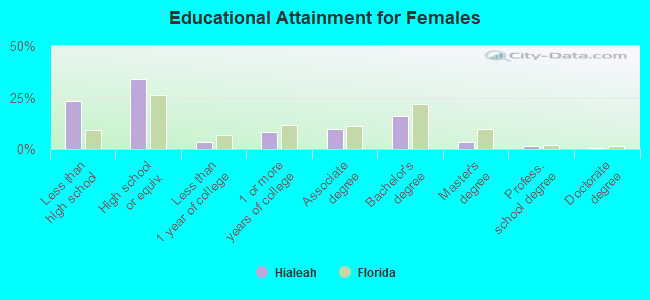
Education attainment for females 25 years and older:
- No schooling: 3,502
- Nursery to 4th grade: 1,314
- 5th and 6th grade: 2,564
- 7th and 8th grade: 2,743
- 9th grade: 3,140
- 10th grade: 1,059
- 11th grade: 1,279
- 12th grade, no diploma: 4,885
- High school graduate (or equivalency): 30,224
- Less than 1 year of college: 2,990
- Some college more than 1 year, no degree: 7,208
- Associate degree: 8,627
- Bachelor's degree: 14,057
- Master's degree: 3,135
- Professional school degree: 1,297
- Doctorate degree: 603
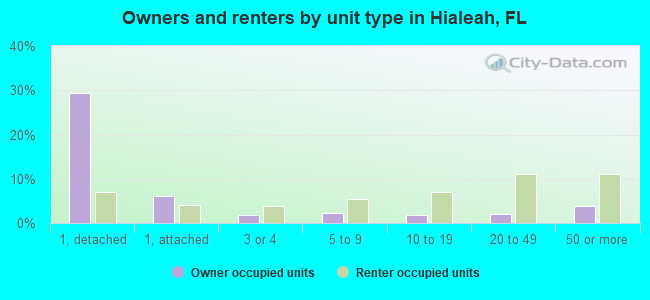
Housing units in structures:
- One, detached: 29,493
- One, attached: 8,071
- Two: 1,885
- 3 or 4: 4,757
- 5 to 9: 6,048
- 10 to 19: 6,886
- 20 to 49: 10,469
- 50 or more: 11,748
- Mobile homes: 1,055
Median worth of mobile homes: $47,600
Housing units lacking complete kitchen facilities in 2022: 1.3%
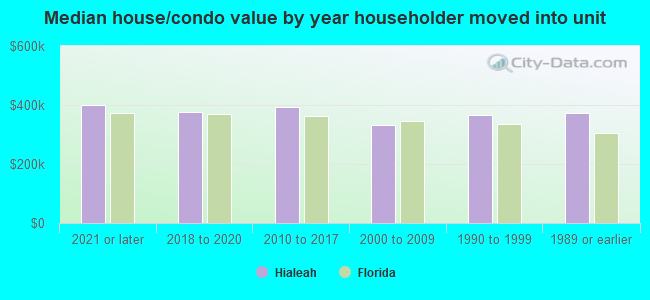
House/condo owner moved in on average 16 years ago
Renter moved in on average 4 years ago
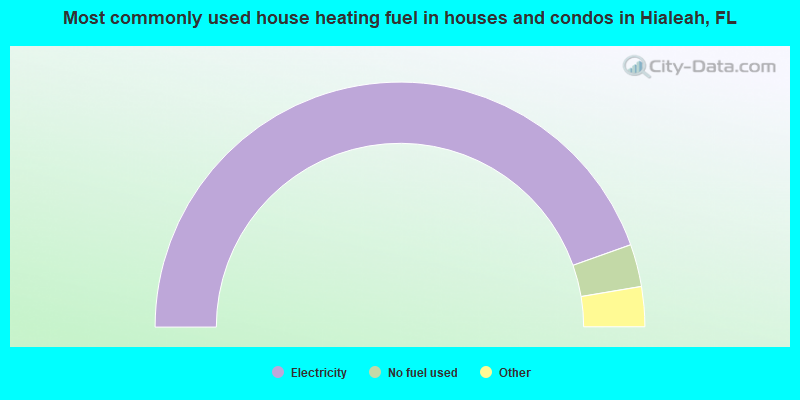
- 89.2%Electricity
- 5.6%No fuel used
- 3.9%Utility gas
- 0.7%Bottled, tank, or LP gas
- 0.5%Solar energy
- 0.1%Fuel oil, kerosene, etc.
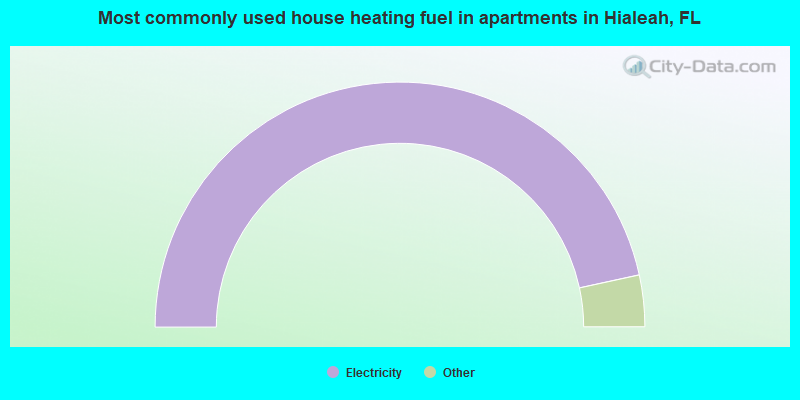
- 93.2%Electricity
- 3.1%No fuel used
- 3.0%Utility gas
- 0.4%Bottled, tank, or LP gas
- 0.3%Fuel oil, kerosene, etc.
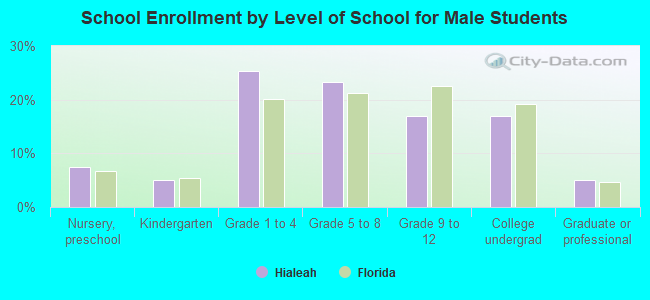
Private vs. public school enrollment:
| Here: | 20.4% |
| Florida: | 15.8% |
| Here: | 12.1% |
| Florida: | 12.9% |
| Here: | 28.8% |
| Florida: | 23.6% |