Races in Hialeah, Florida (FL) Detailed Stats
Data:
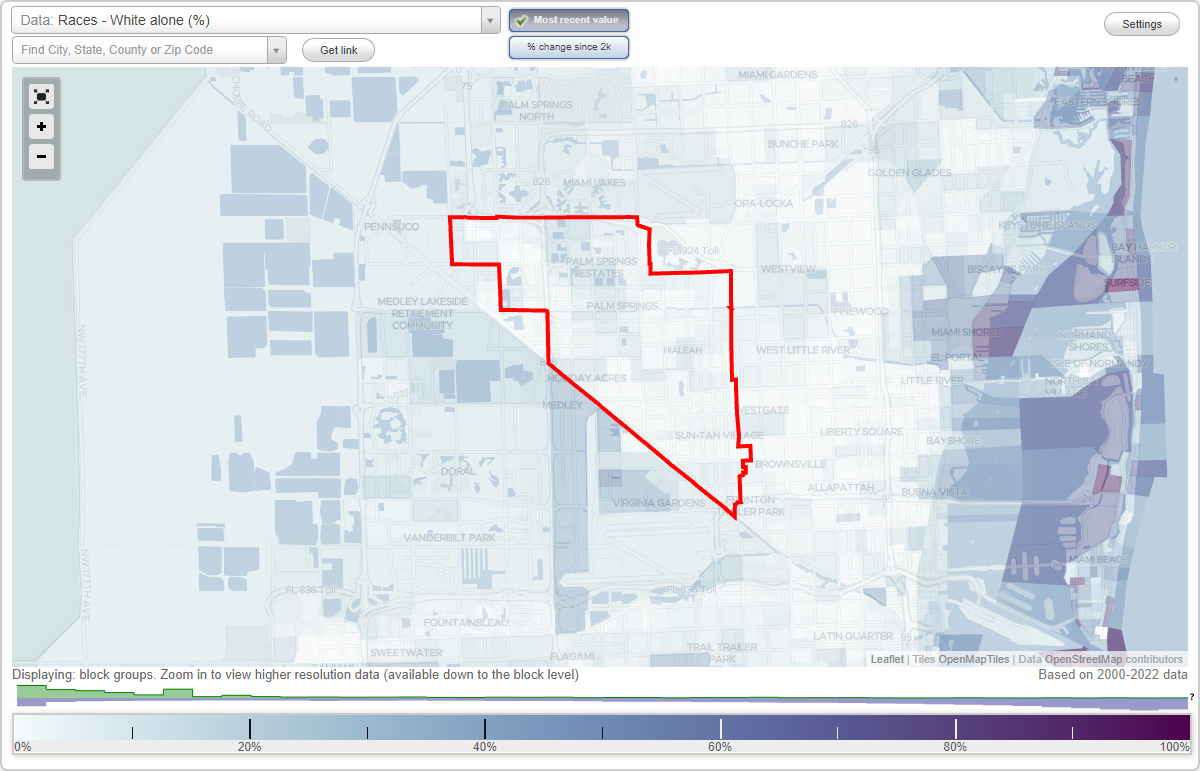
Races - White alone (%)
Races - White alone (% change since 2000)
Races - Black alone (%)
Races - Black alone (% change since 2000)
Races - American Indian alone (%)
Races - American Indian alone (% change since 2000)
Races - Asian alone (%)
Races - Asian alone (% change since 2000)
Races - Hispanic (%)
Races - Hispanic (% change since 2000)
Races - Native Hawaiian and Other Pacific Islander alone (%)
Races - Native Hawaiian and Other Pacific Islander alone (% change since 2000)
Races - Two or more races(%)
Races - Two or more races(% change since 2000)
Races - Other race alone (%)
Races - Other race alone (% change since 2000)
Racial diversity
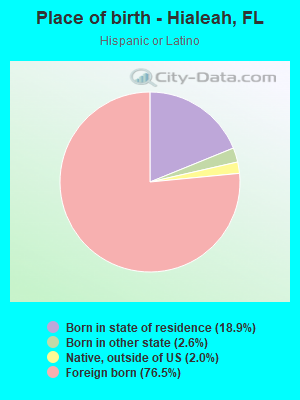
Place of birth - Born in state of residence (%)
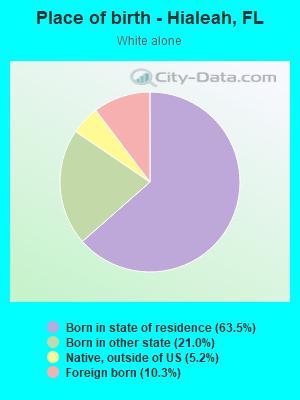
Place of birth - Born in state of residence (%) - White
Place of birth - Born in state of residence (%) - Black or African American
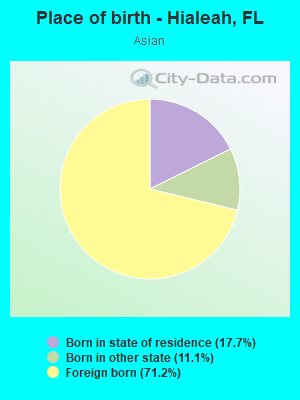
Place of birth - Born in state of residence (%) - Asian
Place of birth - Born in state of residence (%) - Hispanic or Latino
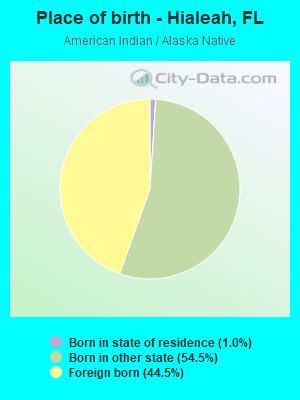
Place of birth - Born in state of residence (%) - American Indian and Alaska Native
Place of birth - Born in state of residence (%) - Multirace
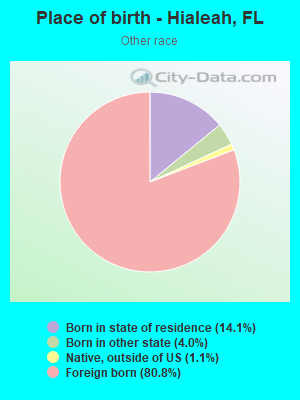
Place of birth - Born in state of residence (%) - Other Race
Place of birth - Born in other state (%)
Place of birth - Born in other state (%) - White
Place of birth - Born in other state (%) - Black or African American
Place of birth - Born in other state (%) - Asian
Place of birth - Born in other state (%) - Hispanic or Latino
Place of birth - Born in other state (%) - American Indian and Alaska Native
Place of birth - Born in other state (%) - Multirace
Place of birth - Born in other state (%) - Other Race
Place of birth - Native, outside of US (%)
Place of birth - Native, outside of US (%) - White
Place of birth - Native, outside of US (%) - Black or African American
Place of birth - Native, outside of US (%) - Asian
Place of birth - Native, outside of US (%) - Hispanic or Latino
Place of birth - Native, outside of US (%) - American Indian and Alaska Native
Place of birth - Native, outside of US (%) - Multirace
Place of birth - Native, outside of US (%) - Other Race
Place of birth - Foreign born (%)
Place of birth - Foreign born (%) - White
Place of birth - Foreign born (%) - Black or African American
Place of birth - Foreign born (%) - Asian
Place of birth - Foreign born (%) - Hispanic or Latino
Place of birth - Foreign born (%) - American Indian and Alaska Native
Place of birth - Foreign born (%) - Multirace
Place of birth - Foreign born (%) - Other Race
Residents speaking English at home (%)
Residents speaking English at home - Born in the United States (%)
Residents speaking English at home - Native, born elsewhere (%)
Residents speaking English at home - Foreign born (%)
Residents speaking Spanish at home (%)
Residents speaking Spanish at home - Born in the United States (%)
Residents speaking Spanish at home - Native, born elsewhere (%)
Residents speaking Spanish at home - Foreign born (%)
Residents speaking other language at home (%)
Residents speaking other language at home - Born in the United States (%)
Residents speaking other language at home - Native, born elsewhere (%)
Residents speaking other language at home - Foreign born (%)
Marital status - Never married (%)
Marital status - Now married (%)
Marital status - Separated (%)
Marital status - Widowed (%)
Marital status - Divorced (%)
Ancestries Reported - Arab (%)
Ancestries Reported - Czech (%)
Ancestries Reported - Danish (%)
Ancestries Reported - Dutch (%)
Ancestries Reported - English (%)
Ancestries Reported - French (%)
Ancestries Reported - French Canadian (%)
Ancestries Reported - German (%)
Ancestries Reported - Greek (%)
Ancestries Reported - Hungarian (%)
Ancestries Reported - Irish (%)
Ancestries Reported - Italian (%)
Ancestries Reported - Lithuanian (%)
Ancestries Reported - Norwegian (%)
Ancestries Reported - Polish (%)
Ancestries Reported - Portuguese (%)
Ancestries Reported - Russian (%)
Ancestries Reported - Scotch-Irish (%)
Ancestries Reported - Scottish (%)
Ancestries Reported - Slovak (%)
Ancestries Reported - Subsaharan African (%)
Ancestries Reported - Swedish (%)
Ancestries Reported - Swiss (%)
Ancestries Reported - Ukrainian (%)
Ancestries Reported - United States (%)
Ancestries Reported - Welsh (%)
Ancestries Reported - West Indian (%)
Ancestries Reported - Other (%)
Geographical mobility - Same house 1 year ago (%)
Geographical mobility - Same house 1 year ago (%) - White
Geographical mobility - Same house 1 year ago (%) - Black or African American
Geographical mobility - Same house 1 year ago (%) - Asian
Geographical mobility - Same house 1 year ago (%) - Hispanic or Latino
Geographical mobility - Same house 1 year ago (%) - American Indian and Alaska Native
Geographical mobility - Same house 1 year ago (%) - Multirace
Geographical mobility - Same house 1 year ago (%) - Other Race
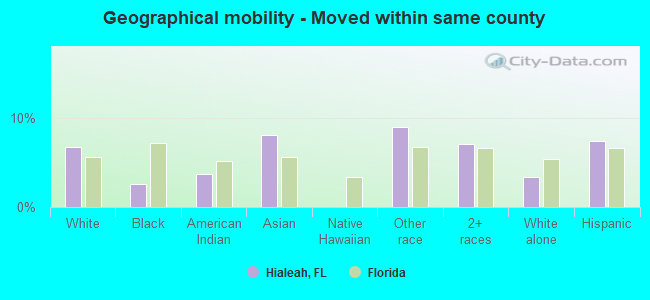
Geographical mobility - Moved within same county (%)
Geographical mobility - Moved within same county (%) - White
Geographical mobility - Moved within same county (%) - Black or African American
Geographical mobility - Moved within same county (%) - Asian
Geographical mobility - Moved within same county (%) - Hispanic or Latino
Geographical mobility - Moved within same county (%) - American Indian and Alaska Native
Geographical mobility - Moved within same county (%) - Multirace
Geographical mobility - Moved within same county (%) - Other Race
Geographical mobility - Moved from different county within same state (%)
Geographical mobility - Moved from different county within same state (%) - White
Geographical mobility - Moved from different county within same state (%) - Black or African American
Geographical mobility - Moved from different county within same state (%) - Asian
Geographical mobility - Moved from different county within same state (%) - Hispanic or Latino
Geographical mobility - Moved from different county within same state (%) - American Indian and Alaska Native
Geographical mobility - Moved from different county within same state (%) - Multirace
Geographical mobility - Moved from different county within same state (%) - Other Race
Geographical mobility - Moved from different state (%)
Geographical mobility - Moved from different state (%) - White
Geographical mobility - Moved from different state (%) - Black or African American
Geographical mobility - Moved from different state (%) - Asian
Geographical mobility - Moved from different state (%) - Hispanic or Latino
Geographical mobility - Moved from different state (%) - American Indian and Alaska Native
Geographical mobility - Moved from different state (%) - Multirace
Geographical mobility - Moved from different state (%) - Other Race
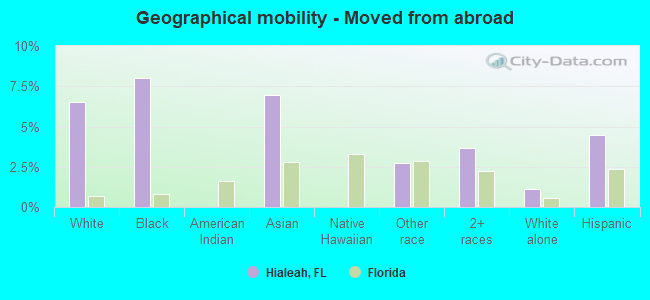
Geographical mobility - Moved from abroad (%)
Geographical mobility - Moved from abroad (%) - White
Geographical mobility - Moved from abroad (%) - Black or African American
Geographical mobility - Moved from abroad (%) - Asian
Geographical mobility - Moved from abroad (%) - Hispanic or Latino
Geographical mobility - Moved from abroad (%) - American Indian and Alaska Native
Geographical mobility - Moved from abroad (%) - Multirace
Geographical mobility - Moved from abroad (%) - Other Race
Place of birth for the foreign-born population - Ireland (%)
Place of birth for the foreign-born population - Denmark (%)
Place of birth for the foreign-born population - Norway (%)
Place of birth for the foreign-born population - Sweden (%)
Place of birth for the foreign-born population - United Kingdom (%)
Place of birth for the foreign-born population - England (%)
Place of birth for the foreign-born population - Scotland (%)
Place of birth for the foreign-born population - Other Northern Europe (%)
Place of birth for the foreign-born population - Austria (%)
Place of birth for the foreign-born population - Belgium (%)
Place of birth for the foreign-born population - France (%)
Place of birth for the foreign-born population - Germany (%)
Place of birth for the foreign-born population - Netherlands (%)
Place of birth for the foreign-born population - Switzerland (%)
Place of birth for the foreign-born population - Other Western Europe (%)
Place of birth for the foreign-born population - Greece (%)
Place of birth for the foreign-born population - Italy (%)
Place of birth for the foreign-born population - Portugal (%)
Place of birth for the foreign-born population - Spain (%)
Place of birth for the foreign-born population - Other Southern Europe (%)
Place of birth for the foreign-born population - Albania (%)
Place of birth for the foreign-born population - Belarus (%)
Place of birth for the foreign-born population - Bosnia and Herzegovina (%)
Place of birth for the foreign-born population - Bulgaria (%)
Place of birth for the foreign-born population - Croatia (%)
Place of birth for the foreign-born population - Czechoslovakia (%)
Place of birth for the foreign-born population - Hungary (%)
Place of birth for the foreign-born population - Latvia (%)
Place of birth for the foreign-born population - Lithuania (%)
Place of birth for the foreign-born population - North Macedonia (Macedonia) (%)
Place of birth for the foreign-born population - Moldova (%)
Place of birth for the foreign-born population - Poland (%)
Place of birth for the foreign-born population - Romania (%)
Place of birth for the foreign-born population - Russia (%)
Place of birth for the foreign-born population - Serbia (%)
Place of birth for the foreign-born population - Ukraine (%)
Place of birth for the foreign-born population - Other Eastern Europe (%)
Place of birth for the foreign-born population - China (%)
Place of birth for the foreign-born population - Hong Kong (%)
Place of birth for the foreign-born population - Taiwan (%)
Place of birth for the foreign-born population - Japan (%)
Place of birth for the foreign-born population - Korea (%)
Place of birth for the foreign-born population - Other Eastern Asia (%)
Place of birth for the foreign-born population - Afghanistan (%)
Place of birth for the foreign-born population - Bangladesh (%)
Place of birth for the foreign-born population - India (%)
Place of birth for the foreign-born population - Iran (%)
Place of birth for the foreign-born population - Kazakhstan (%)
Place of birth for the foreign-born population - Nepal (%)
Place of birth for the foreign-born population - Pakistan (%)
Place of birth for the foreign-born population - Sri Lanka (%)
Place of birth for the foreign-born population - Uzbekistan (%)
Place of birth for the foreign-born population - Other South Central Asia (%)
Place of birth for the foreign-born population - Burma (%)
Place of birth for the foreign-born population - Cambodia (%)
Place of birth for the foreign-born population - Indonesia (%)
Place of birth for the foreign-born population - Laos (%)
Place of birth for the foreign-born population - Malaysia (%)
Place of birth for the foreign-born population - Philippines (%)
Place of birth for the foreign-born population - Singapore (%)
Place of birth for the foreign-born population - Thailand (%)
Place of birth for the foreign-born population - Vietnam (%)
Place of birth for the foreign-born population - Other South Eastern Asia (%)
Place of birth for the foreign-born population - Armenia (%)
Place of birth for the foreign-born population - Iraq (%)
Place of birth for the foreign-born population - Israel (%)
Place of birth for the foreign-born population - Jordan (%)
Place of birth for the foreign-born population - Kuwait (%)
Place of birth for the foreign-born population - Lebanon (%)
Place of birth for the foreign-born population - Saudi Arabia (%)
Place of birth for the foreign-born population - Syria (%)
Place of birth for the foreign-born population - Turkey (%)
Place of birth for the foreign-born population - Yemen (%)
Place of birth for the foreign-born population - Other Western Asia (%)
Place of birth for the foreign-born population - Eritrea (%)
Place of birth for the foreign-born population - Ethiopia (%)
Place of birth for the foreign-born population - Kenya (%)
Place of birth for the foreign-born population - Somalia (%)
Place of birth for the foreign-born population - Uganda (%)
Place of birth for the foreign-born population - Zimbabwe (%)
Place of birth for the foreign-born population - Other Eastern Africa (%)
Place of birth for the foreign-born population - Cameroon (%)
Place of birth for the foreign-born population - Congo (%)
Place of birth for the foreign-born population - Democratic Republic of Congo (Zaire) (%)
Place of birth for the foreign-born population - Other Middle Africa (%)
Place of birth for the foreign-born population - Egypt (%)
Place of birth for the foreign-born population - Morocco (%)
Place of birth for the foreign-born population - Sudan (%)
Place of birth for the foreign-born population - Other Northern Africa (%)
Place of birth for the foreign-born population - South Africa (%)
Place of birth for the foreign-born population - Other Southern Africa (%)
Place of birth for the foreign-born population - Cabo Verde (%)
Place of birth for the foreign-born population - Ghana (%)
Place of birth for the foreign-born population - Liberia (%)
Place of birth for the foreign-born population - Nigeria (%)
Place of birth for the foreign-born population - Senegal (%)
Place of birth for the foreign-born population - Sierra Leone (%)
Place of birth for the foreign-born population - Other Western Africa (%)
Place of birth for the foreign-born population - Australia (%)
Place of birth for the foreign-born population - New Zealand (%)
Place of birth for the foreign-born population - Fiji (%)
Place of birth for the foreign-born population - Micronesia (%)
Place of birth for the foreign-born population - Bahamas (%)
Place of birth for the foreign-born population - Barbados (%)
Place of birth for the foreign-born population - Cuba (%)
Place of birth for the foreign-born population - Dominica (%)
Place of birth for the foreign-born population - Dominican Republic (%)
Place of birth for the foreign-born population - Grenada (%)
Place of birth for the foreign-born population - Haiti (%)
Place of birth for the foreign-born population - Jamaica (%)
Place of birth for the foreign-born population - St. Vincent and the Grenadines (%)
Place of birth for the foreign-born population - Trinidad and Tobago (%)
Place of birth for the foreign-born population - West Indies (%)
Place of birth for the foreign-born population - Other Caribbean (%)
Place of birth for the foreign-born population - Belize (%)
Place of birth for the foreign-born population - Costa Rica (%)
Place of birth for the foreign-born population - El Salvador (%)
Place of birth for the foreign-born population - Guatemala (%)
Place of birth for the foreign-born population - Honduras (%)
Place of birth for the foreign-born population - Mexico (%)
Place of birth for the foreign-born population - Nicaragua (%)
Place of birth for the foreign-born population - Panama (%)
Place of birth for the foreign-born population - Other Central America (%)
Place of birth for the foreign-born population - Argentina (%)
Place of birth for the foreign-born population - Bolivia (%)
Place of birth for the foreign-born population - Brazil (%)
Place of birth for the foreign-born population - Chile (%)
Place of birth for the foreign-born population - Colombia (%)
Place of birth for the foreign-born population - Ecuador (%)
Place of birth for the foreign-born population - Guyana (%)
Place of birth for the foreign-born population - Peru (%)
Place of birth for the foreign-born population - Uruguay (%)
Place of birth for the foreign-born population - Venezuela (%)
Place of birth for the foreign-born population - Other South America (%)
Place of birth for the foreign-born population - Canada (%)
Place of birth for the foreign-born population - Other Northern America (%)
Place of birth for the foreign-born population - Other (%)
Latest news about races in Hialeah, FL collected exclusively by city-data.com from local newspapers, TV, and radio stations
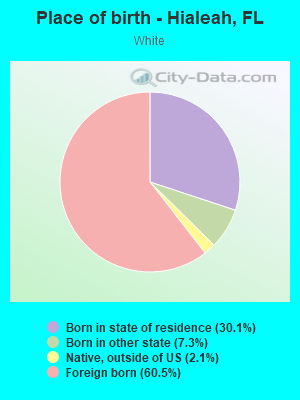
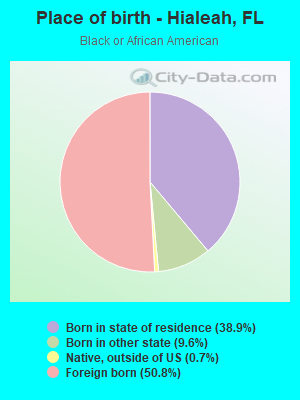
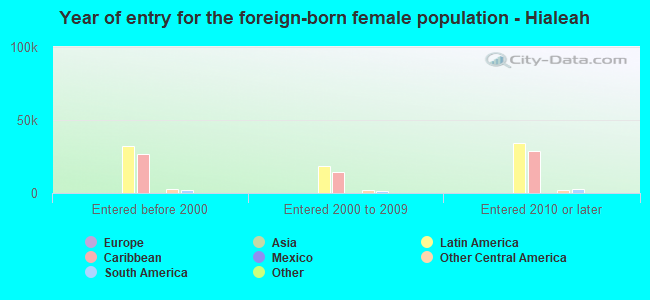
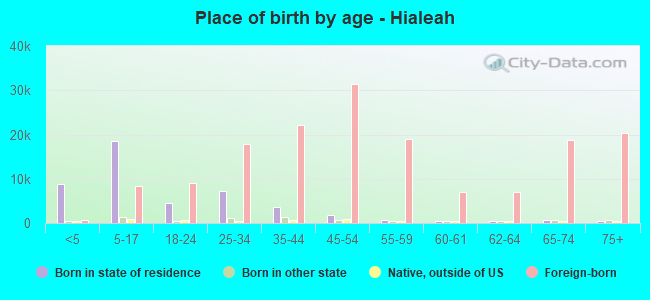
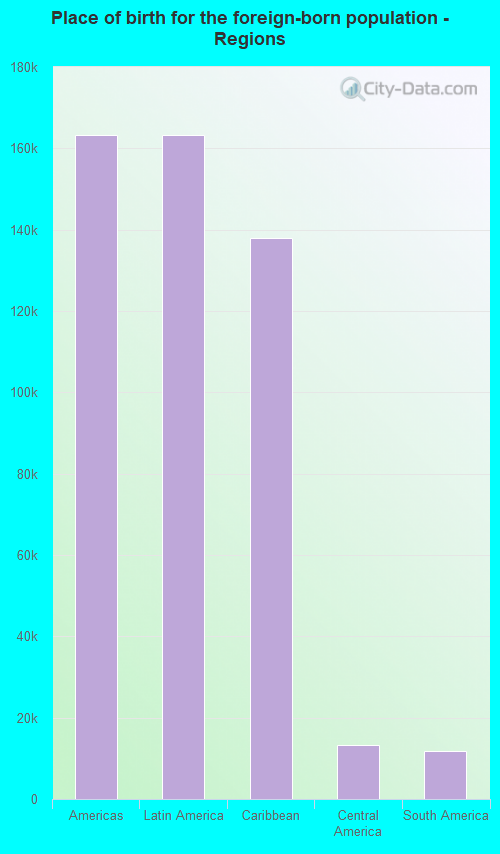
According to 2022 data, the most numerous races in Hialeah, FL are White alone (6,519 residents), Hispanic (212,712 residents), and Black alone (1,441 residents). 7.7% of Hialeah residents speak English at home. 74.5% of Hialeah, FL residents are foreign-born (73.2% born in Latin America), which is 71.8% greater than the foreign-born rate of 21.0% across the entire state of Florida.
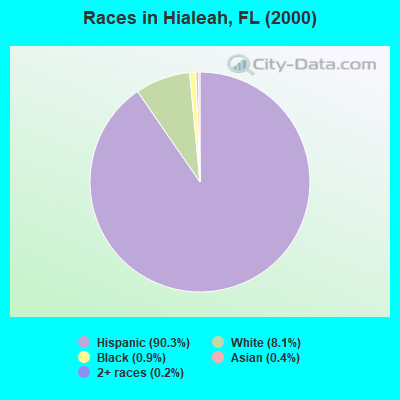
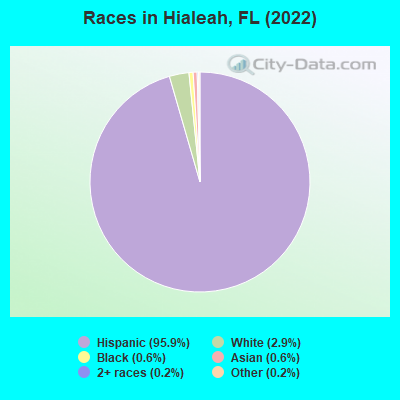
Race distribution in Hialeah
2000 2022
10,458,509 65.4% White alone 2,682,715 16.8% Hispanic 2,264,268 14.2% Black alone 261,693 1.6% Asian alone 236,954 1.5% Two or more races 42,358 0.3% American Indian alone 28,994 0.2% Other race alone 6,887 0.04% Native Hawaiian and Other
11,309,403 50.8% White alone 6,025,039 27.1% Hispanic 3,241,015 14.6% Black alone 861,630 3.9% Two or more races 623,692 2.8% Asian alone 152,054 0.7% Other race alone 22,504 0.1% American Indian alone 9,486 0.04% Native Hawaiian and Other
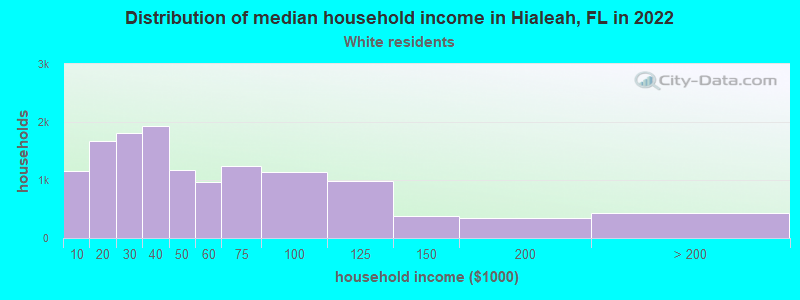
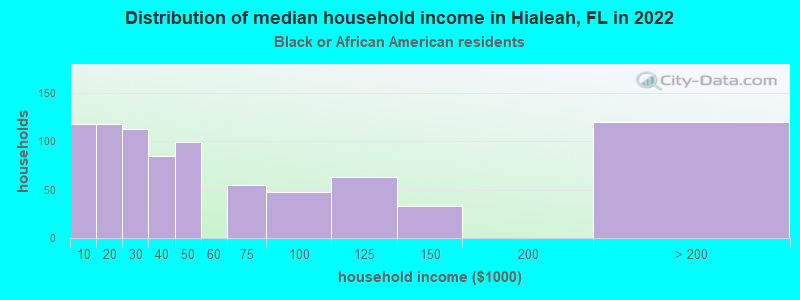
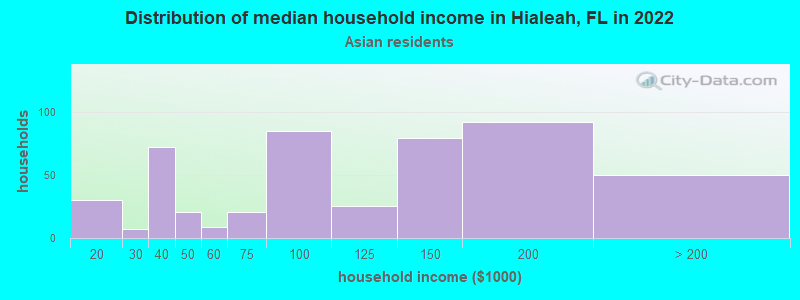
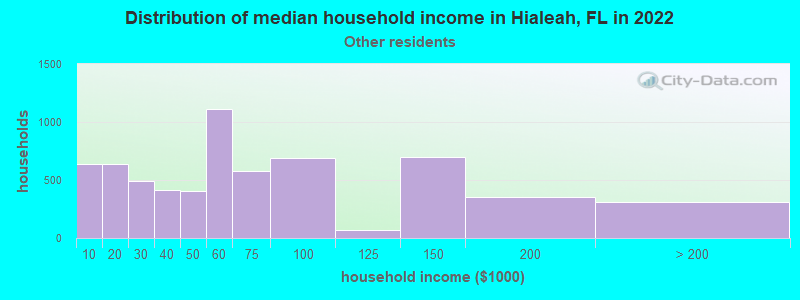
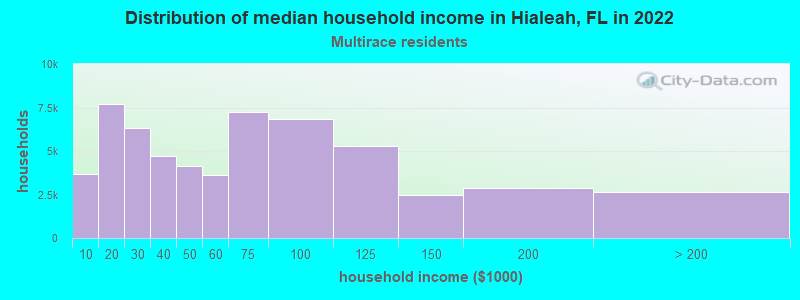
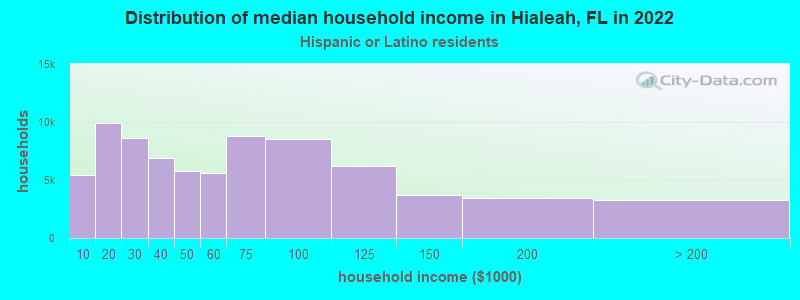
Income and house value in Hialeah Median household income in 2022 $71,494 White non-Hispanic householders$38,590 Black householders$141,826 Asian householders$54,515 Some other race householders$55,848 Two or more races householders$52,014 Hispanic or Latino race householdersMedian 2022 house value $412,756 White Non-Hispanic householders$347,451 Black or African American householders$333,741 American Indian or Alaska Native householders $342,761 Asian householders$234,521 Native Hawaiian and other Pacific Islander householders$394,356 Some other race householders$410,231 Two or more races householders$411,313 Hispanic or Latino householders
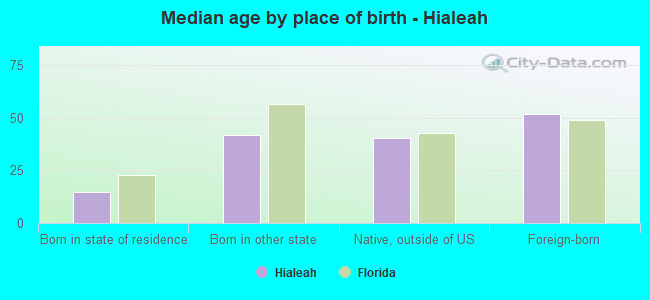
Median age by race in Hialeah
42.5 Median age for White residents41.1 45.1 31.8 Median age for Black or African American residents44.6 31.6 -666,666,666.0 Median age for American Indian / Alaska Native residents-666,666,666.0 -666,666,666.0 30.5 Median age for Asian residents29.6 31.8 -666,666,666.0 Median age for Native Hawaiian / Pacific Islander residents-666,666,666.0 -666,666,666.0 42.4 Median age for Other race residents43.8 41.9 46.7 Median age for Two or more races residents45.8 47.7 23.0 Median age for White alone residents18.0 23.2 46.6 Median age for Hispanic or Latino residents45.6 47.6
Owner/renter occupied households by race in Hialeah
House owners and renters - White residents 7,053 53.4% Owner occupied6,152 46.6% Renter occupiedHouse owners and renters - Black or African American residents 296 35.2% Owner occupied544 64.8% Renter occupiedHouse owners and renters - American Indian / Alaska Native residents 7 100.0% Owner occupiedHouse owners and renters - Asian residents 374 81.8% Owner occupied83 18.2% Renter occupiedHouse owners and renters - Other race residents 2,604 40.8% Owner occupied3,777 59.2% Renter occupiedHouse owners and renters - Two or more races residents 27,725 48.1% Owner occupied29,884 51.9% Renter occupiedHouse owners and renters - White alone residents 843 68.5% Owner occupied387 31.5% Renter occupiedHouse owners and renters - Hispanic or Latino residents 36,568 47.9% Owner occupied39,771 52.1% Renter occupied
Language usage in Hialeah
English speakers - Total 7.7% of residents of Hialeah speak English at home.
91.1% of residents speak Spanish at home 69,952 36.5% Speak English very well121,733 63.5% Speak English less than very well1.2% of residents speak other language at home 1,958 75.1% Speak English very well648 24.9% Speak English less than very well
English speakers - Born in the United States 36.8% of residents of Hialeah speak English at home.
63.2% of residents speak Spanish at home 4,247 92.1% Speak English very well362 7.9% Speak English less than very well
English speakers - Native, born elsewhere 12.5% of residents of Hialeah speak English at home.
82.7% of residents speak Spanish at home 2,397 63.8% Speak English very well1,363 36.2% Speak English less than very well4.8% of residents speak other language at home 61 27.9% Speak English very well158 72.1% Speak English less than very well
English speakers - Foreign-born 4.2% of residents of Hialeah speak English at home.
95.0% of residents speak Spanish at home 35,130 23.0% Speak English very well117,498 77.0% Speak English less than very well0.8% of residents speak other language at home 802 62.6% Speak English very well480 37.4% Speak English less than very well
White (Caucasian) - Speak only English Native:
31.5% (4,222)Foreign-born:
7.9% (1,779)
White (Caucasian) - Speak another language Native:
68.5% (9,178)Foreign-born:
92.1% (20,797)
Black or African American - Speak only English Native:
58.7% (870)Foreign-born:
10.9% (170)
Black or African American - Speak another language Native:
41.2% (611)Foreign-born:
87.2% (1,362)
American Indian / Alaska Native - Speak another language Native:
86.4% (41)Foreign-born:
98.3% (42)
Asian - Speak only English Native:
35.6% (130)Foreign-born:
7.4% (79)
Asian - Speak another language Native:
63.4% (231)Foreign-born:
94.8% (1,005)
Other race - Speak only English Native:
12.8% (361)Foreign-born:
2.5% (380)
Other race - Speak another language Native:
87.2% (2,460)Foreign-born:
97.5% (15,088)
Two or more races - Speak only English Native:
10.9% (3,405)Foreign-born:
3.7% (4,418)
Two or more races - Speak another language Native:
89.1% (27,874)Foreign-born:
96.3% (116,509)
White alone - Speak only English Native:
51.9% (2,607)Foreign-born:
25.7% (176)
White alone - Speak another language Native:
46.6% (2,338)Foreign-born:
74.1% (508)
Hispanic or Latino - Speak only English Native:
12.2% (5,063)Foreign-born:
4.2% (6,754)
Hispanic or Latino - Speak another language Native:
87.8% (36,498)Foreign-born:
95.8% (152,644)
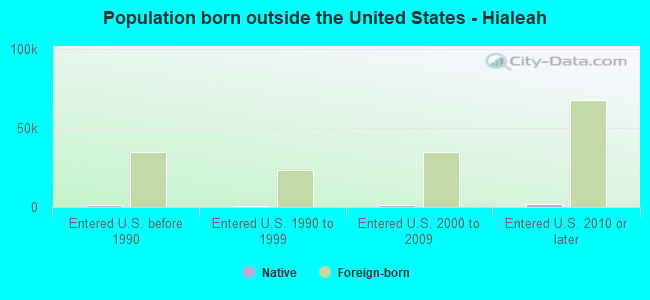
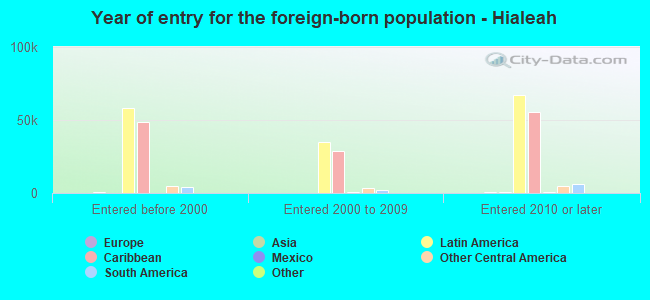
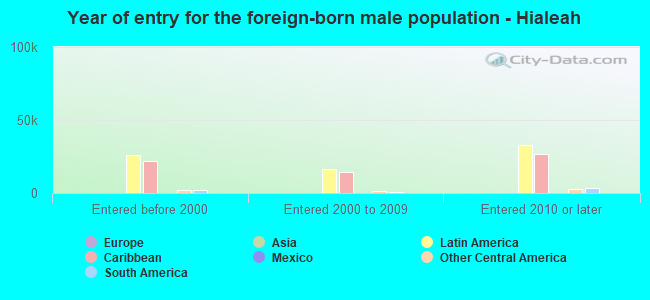
Foreign-born residents in Hialeah 165,154 residents are foreign born (73.2% Latin America ).
This city:
74.5%Florida:
21.1%
Marital status for residents in Hialeah Marital status - White (Caucasian) population 15 years and over
Males 30.6% Never married43.0% Now married4.3% Separated4.2% Widowed18.0% DivorcedFemales 30.7% Never married33.5% Now married3.1% Separated11.6% Widowed21.0% DivorcedWomen who gave birth in the past 12 months Now married:
100.0% (281)Unmarried:
0.0% (0)
Women who did not give birth in the past 12 months Now married:
29.9% (2,171)Unmarried:
70.1% (5,086)
Marital status - Black or African American population 15 years and over
Males 61.8% Never married23.8% Now married2.1% Separated0.3% Widowed12.1% DivorcedFemales 43.7% Never married21.8% Now married3.6% Separated15.8% Widowed15.1% DivorcedWomen who gave birth in the past 12 months Now married:
0.0% (0)Unmarried:
100.0% (5)
Women who did not give birth in the past 12 months Now married:
33.4% (249)Unmarried:
66.6% (496)
Marital status - American Indian / Alaska Native population 15 years and over
Males 58.5% Never married26.8% Now married0.0% Separated0.0% Widowed14.6% DivorcedFemales 61.9% Never married38.1% Now married0.0% Separated0.0% Widowed0.0% DivorcedWomen who did not give birth in the past 12 months Now married:
0.0% (0)Unmarried:
100.0% (21)
Marital status - Asian population 15 years and over
Males 21.1% Never married64.3% Now married1.6% Separated0.0% Widowed13.0% DivorcedFemales 16.2% Never married73.8% Now married0.0% Separated4.8% Widowed5.2% DivorcedWomen who gave birth in the past 12 months Now married:
100.0% (32)Unmarried:
0.0% (0)
Women who did not give birth in the past 12 months Now married:
69.8% (195)Unmarried:
30.2% (84)
Marital status - Other race population 15 years and over
Males 30.5% Never married47.9% Now married7.8% Separated2.1% Widowed11.7% DivorcedFemales 17.3% Never married47.5% Now married4.7% Separated8.4% Widowed22.1% DivorcedWomen who gave birth in the past 12 months Now married:
43.4% (191)Unmarried:
56.6% (249)
Women who did not give birth in the past 12 months Now married:
56.8% (2,496)Unmarried:
43.2% (1,900)
Marital status - Two or more races population 15 years and over
Males 34.2% Never married47.5% Now married2.0% Separated3.1% Widowed13.2% DivorcedFemales 30.4% Never married40.5% Now married3.1% Separated10.0% Widowed16.0% DivorcedWomen who gave birth in the past 12 months Now married:
31.7% (484)Unmarried:
68.3% (1,042)
Women who did not give birth in the past 12 months Now married:
38.9% (14,047)Unmarried:
61.1% (22,078)
Marital status - White alone, not Hispanic / Latino population 15 years and over
Males 36.8% Never married35.0% Now married0.0% Separated5.9% Widowed22.3% DivorcedFemales 37.3% Never married25.4% Now married7.2% Separated10.3% Widowed19.9% DivorcedWomen who gave birth in the past 12 months Now married:
91.8% (75)Unmarried:
8.2% (7)
Women who did not give birth in the past 12 months Now married:
24.1% (232)Unmarried:
75.9% (729)
Marital status - Hispanic or Latino population 15 years and over
Males 33.5% Never married47.0% Now married2.9% Separated3.1% Widowed13.5% DivorcedFemales 29.1% Never married40.2% Now married3.1% Separated10.1% Widowed17.5% DivorcedWomen who gave birth in the past 12 months Now married:
41.3% (907)Unmarried:
58.7% (1,291)
Women who did not give birth in the past 12 months Now married:
39.5% (18,360)Unmarried:
60.5% (28,084)
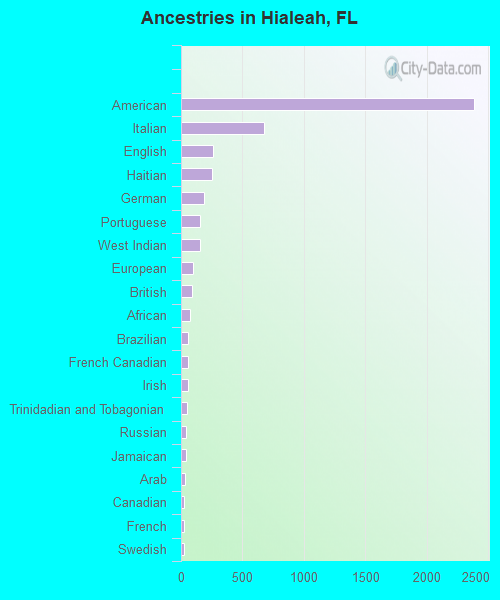
Ancestries in Hialeah
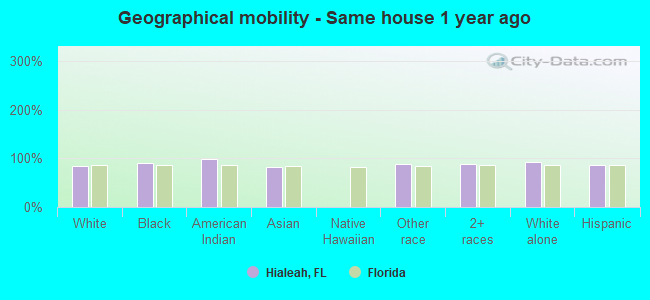
2,385 1.5% American676 0.4% Italian259 0.2% English254 0.2% Haitian191 0.1% German155 0.10% Portuguese154 0.10% West Indian97 0.06% European92 0.06% British71 0.05% African57 0.04% Brazilian55 0.04% French Canadian54 0.03% Irish48 0.03% Trinidadian and Tobagonian42 0.03% Russian38 0.02% Jamaican33 0.02% Arab27 0.02% Canadian25 0.02% French22 0.01% Swedish19 0.01% Lebanese17 0.01% Greek14 0.01% Serbian13 0.01% Lithuanian13 0.01% Polish13 0.01% Romanian
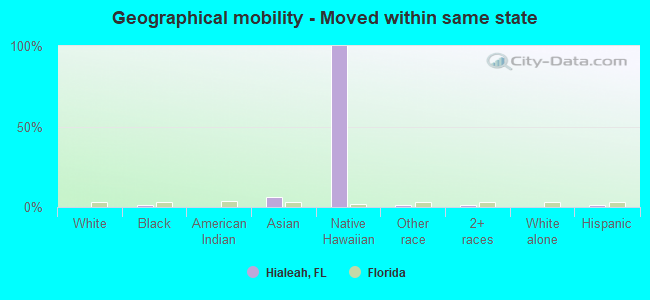
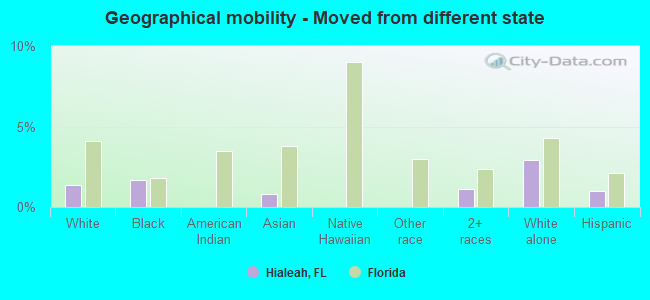
Geographical mobility in Hialeah Same house 1 year ago 31,907 85.2% White (Caucasian)2,880 91.2% Black or African American93 98.3% American Indian / Alaska Native1,207 82.2% Asian16,637 87.4% Other race137,875 87.4% Two or more races6,516 92.6% White alone, not Hispanic / Latino179,748 86.5% Hispanic or LatinoMoved within same county 2,530 6.8% White / Caucasian81 2.6% Black or African American4 3.7% American Indian / Alaska Native118 8.1% Asian1,700 8.9% Other race11,074 7.0% Two or more races239 3.4% White alone, not Hispanic / Latino15,292 7.4% Hispanic or LatinoMoved within same state 45 0.1% White / Caucasian22 0.7% Black or African American83 5.6% Asian8 100.0% Native Hawaiian / Pacific Islander180 0.9% Other race1,108 0.7% Two or more races1 0.0% White alone, not Hispanic / Latino1,466 0.7% Hispanic or LatinoMoved from different state 521 1.4% White / Caucasian53 1.7% Black or African American12 0.8% Asian1,809 1.1% Two or more races204 2.9% White alone, not Hispanic / Latino2,126 1.0% Hispanic or LatinoMoved from abroad 2,437 6.5% White253 8.0% Black or African American102 6.9% Asian521 2.7% Other race5,805 3.7% Two or more races80 1.1% White alone, not Hispanic / Latino9,251 4.5% Hispanic or Latino
Children Nativity (place of birth) in Hialeah
Children under 6 years - Living with two parents Both parents native 280 100.0% NativeBoth parents foreign-born 2,222 86.0% Native361 14.0% Foreign-bornOne native, one foreign-born parent 1,253 100.0% NativeChildren under 6 years - Living with one parent Native parent 1,743 90.5% Native182 9.5% Foreign-bornForeign-born parent 4,748 97.1% Native144 2.9% Foreign-bornChildren 6 to 17 years - Living with two parents Both parents native 1,040 100.0% NativeBoth parents foreign-born 4,802 50.3% Native4,741 49.7% Foreign-bornOne native, one foreign-born parent 1,817 84.7% Native328 15.3% Foreign-bornChildren 6 to 17 years - Living with one parent Native parent 804 100.0% NativeForeign-born parent 9,847 57.2% Native7,364 42.8% Foreign-born
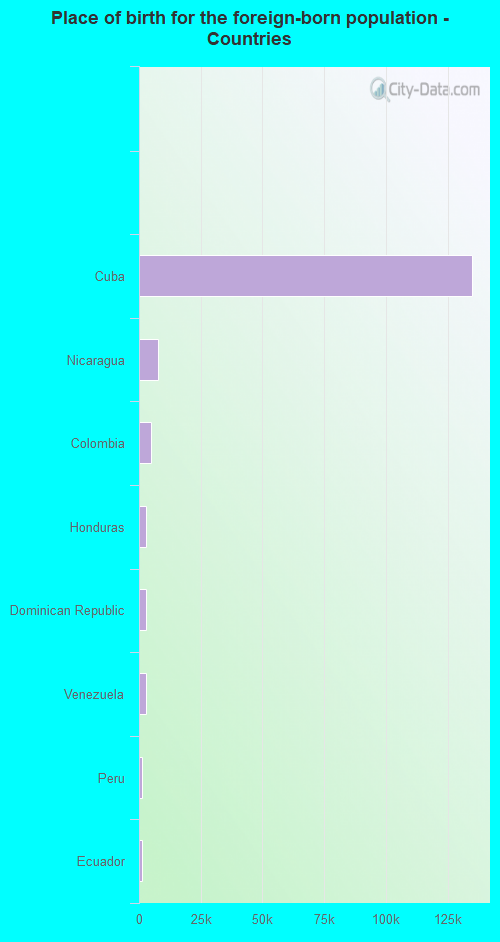
Place of birth for residents in Hialeah 163,232 Americas163,201 Latin America138,042 Caribbean13,341 Central America11,817 South America1,068 Europe823 Southern Europe808 Asia442 Eastern Asia424 China279 South Central Asia146 Eastern Europe63 Western Europe63 South Eastern Asia34 Oceania33 Northern Europe30 Northern America21 Western Asia10 Africa5 Eastern Africa4 Middle Africa134,974 Cuba7,852 Nicaragua4,871 Colombia2,801 Honduras2,682 Dominican Republic2,680 Venezuela1,399 Peru1,296 Ecuador948 El Salvador783 Mexico732 Argentina697 Spain438 Guatemala424 China291 Chile282 Panama234 Costa Rica233 Uruguay222 Brazil211 Haiti115 Pakistan111 Italy106 Romania80 India63 Germany51 Bangladesh48 Jamaica45 Vietnam40 Trinidad and Tobago34 Micronesia33 England30 Afghanistan30 Canada23 Bolivia21 Dominica21 Lebanon20 Bahamas19 Russia17 Philippines17 Korea14 West Indies14 Guyana13 Portugal13 Serbia5 Belarus4 Cameroon
Grandparents responsible for own grandchildren in Hialeah
Grandparents (30 to 59 years) White / Caucasian 162 17.7% Responsible for grandchildren752 82.3% Not responsible for grandchildrenBlack or African American 7 100.0% Responsible for grandchildrenOther race 51 36.2% Responsible for grandchildren89 63.8% Not responsible for grandchildrenTwo or more races 438 15.6% Responsible for grandchildren2,362 84.4% Not responsible for grandchildrenWhite alone, not Hispanic / Latino 11 43.5% Responsible for grandchildren14 56.5% Not responsible for grandchildrenHispanic or Latino 474 15.2% Responsible for grandchildren2,639 84.8% Not responsible for grandchildrenGrandparents (60 years and over) White / Caucasian 154 9.2% Responsible for grandchildren1,527 90.8% Not responsible for grandchildrenBlack or African American 21 42.4% Responsible for grandchildren28 57.6% Not responsible for grandchildrenOther race 49 7.5% Responsible for grandchildren599 92.5% Not responsible for grandchildrenTwo or more races 459 8.4% Responsible for grandchildren5,006 91.6% Not responsible for grandchildrenWhite alone, not Hispanic / Latino 24 43.5% Responsible for grandchildren31 56.5% Not responsible for grandchildrenHispanic or Latino 609 9.0% Responsible for grandchildren6,147 91.0% Not responsible for grandchildren