Havelock, NC (North Carolina) Houses and Residents
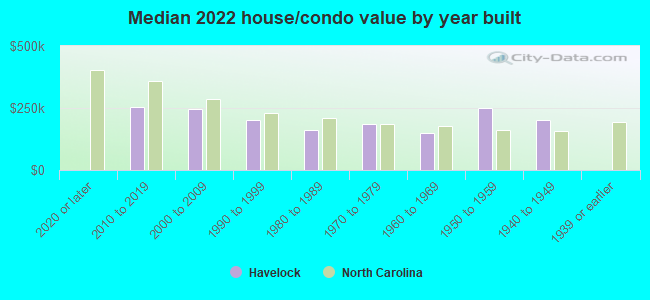
| Havelock: | $185,457 |
| North Carolina: | $280,600 |
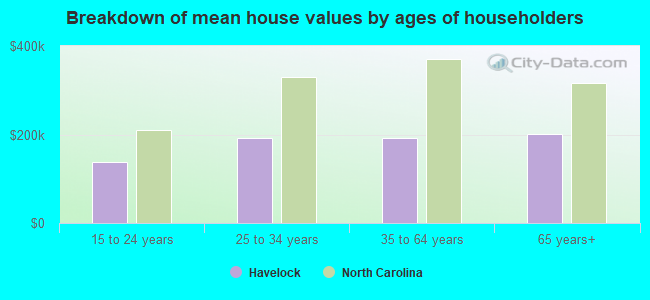
Mean price in 2022:
Detached houses: $232,982
Here: $232,982 State: $375,326 Townhouses or other attached units: $176,349
Here: $176,349 State: $317,935 Mobile homes: $93,289
Here: $93,289 State: $124,933
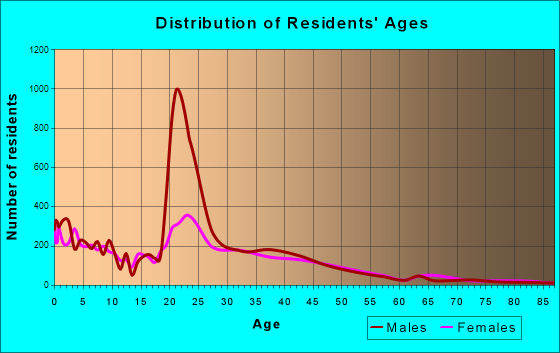
Total population: 20,706 (All urban)
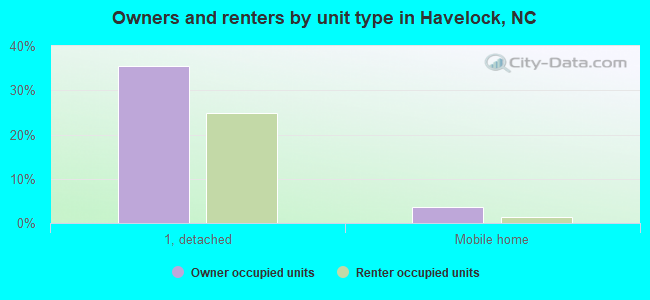
Houses: 5,944 (5,231 occupied: 2,259 owner occupied, 3,091 renter occupied)
| % of renters here: | 58% |
| State: | 33% |
Housing density: 356 houses/condos per square mile
Median price asked for vacant for-sale houses and condos in 2022 in this county: $145,196.
Median contract rent in 2022: $1,112 (lower quartile is $974, upper quartile is $1,365)
Median rent asked for vacant for-rent units in 2022: $733
Median gross rent in Havelock, NC in 2022: $1,193
Housing units in Havelock with a mortgage: 1,964 (85 second mortgage, 0 home equity loan, 61 both second mortgage and home equity loan)
Houses without a mortgage: 32
Median household income for houses/condos with a mortgage: $79,024
Median household income for apartments without a mortgage: $90,143
Median monthly housing costs: $1,168
Compare current foreclosures near Havelock, NC:
| Photo | Address | Area | Beds / Baths | Price | Details |
|---|---|---|---|---|---|

|
#1
Hillcrest St
Havelock, NC 28532
|
1,750 sq. feet
|
1 baths 4 beds |
show details | |

|
#2
Gooding Dr
Havelock, NC 28532
|
972 sq. feet
|
2 baths 2 beds |
show details | |

|
#3
Foxhunt Ln
Havelock, NC 28532
|
1,296 sq. feet
|
2 baths 3 beds |
show details | |

|
#4
John Ct
Havelock, NC 28532
|
1,092 sq. feet
|
2 baths 3 beds |
show details | |

|
#5
Lee K Allen Dr
Havelock, NC 28532
|
1,312 sq. feet
|
2 baths 3 beds |
show details | |

|
#6
Secretariat Dr
Havelock, NC 28532
|
936 sq. feet
|
2 baths 3 beds |
show details | |

|
#7
Twin Wood Dr
Havelock, NC 28532
|
837 sq. feet
|
1 baths 2 beds |
show details | |

|
#8
Nc Highway 101
Havelock, NC 28532
|
1,250 sq. feet
|
1 baths - beds |
show details | |

|
#9
Green Cove Dr
Havelock, NC 28532
|
1,560 sq. feet
|
1 baths - beds |
show details | |

|
#10
Hayden Ct
Havelock, NC 28532
|
- sq. feet
|
- baths - beds |
show details |
| Photo | Address | Area | Beds / Baths | Price | Details |
|---|---|---|---|---|---|

|
#11
Gray Rd # 4
Havelock, NC 28532
|
- sq. feet
|
- baths - beds |
show details | |

|
#12
Montreux Ln
New Bern, NC 28562
|
2,345 sq. feet
|
3 baths 5 beds |
$664,900
|
show details |

|
#13
Brody Ln
New Bern, NC 28562
|
1,178 sq. feet
|
2 baths 3 beds |
show details | |

|
#14
Woodland Dr
Swansboro, NC 28584
|
1,176 sq. feet
|
2 baths 3 beds |
show details | |

|
#15
Pearson Cir
Newport, NC 28570
|
2,040 sq. feet
|
2 baths 3 beds |
show details | |

|
#16
Croatan Dr
Newport, NC 28570
|
2,060 sq. feet
|
2 baths 3 beds |
show details | |

|
#17
Duffy Rd
Beaufort, NC 28516
|
1,135 sq. feet
|
1 baths 3 beds |
show details | |

|
#18
Tidewater Dr
Newport, NC 28570
|
1,457 sq. feet
|
2 baths 3 beds |
show details | |

|
#19
Hwy 58 S
Maysville, NC 28555
|
1,772 sq. feet
|
2 baths 3 beds |
show details | |

|
#20
Oak Dr
Morehead City, NC 28557
|
2,190 sq. feet
|
2 baths 3 beds |
show details |
| Photo | Address | Area | Beds / Baths | Price | Details |
|---|---|---|---|---|---|

|
#21
Walden Rd
New Bern, NC 28562
|
2,515 sq. feet
|
3 baths 3 beds |
show details | |

|
#22
Taberna Cir
New Bern, NC 28562
|
2,113 sq. feet
|
3 baths 3 beds |
show details | |

|
#23
Taberna Cir
New Bern, NC 28562
|
2,113 sq. feet
|
3 baths 3 beds |
show details | |

|
#24
Caracara Dr
New Bern, NC 28560
|
2,586 sq. feet
|
2 baths 3 beds |
show details | |

|
#25
Anita Forte Dr
Swansboro, NC 28584
|
1,464 sq. feet
|
2 baths 4 beds |
show details | |

|
#26
Cedarwood Dr
Swansboro, NC 28584
|
1,826 sq. feet
|
2 baths 3 beds |
show details | |

|
#27
Emerald Dr
Emerald Isle, NC 28594
|
3,647 sq. feet
|
3 baths 3 beds |
show details | |

|
#28
Red Sail Rd
New Bern, NC 28560
|
1,817 sq. feet
|
2 baths 3 beds |
show details | |

|
#29
Emmen Rd
New Bern, NC 28562
|
1,596 sq. feet
|
2 baths 3 beds |
show details | |

|
#30
Bay View Blvd
Atlantic Beach, NC 28512
|
3,819 sq. feet
|
10 baths 8 beds |
show details |
| Photo | Address | Area | Beds / Baths | Price | Details |
|---|---|---|---|---|---|

|
#31
Conner Grant Rd
New Bern, NC 28562
|
1,719 sq. feet
|
2 baths 3 beds |
show details | |

|
#32
Buccaneer Ct
Swansboro, NC 28584
|
2,264 sq. feet
|
2 baths 4 beds |
show details | |

|
#33
Silver Creek Landing Rd
Swansboro, NC 28584
|
3,142 sq. feet
|
2 baths 4 beds |
show details | |

|
#34
Carragood Trl
New Bern, NC 28560
|
1,205 sq. feet
|
1 baths 3 beds |
show details | |

|
#35
Longwood Dr
Stella, NC 28582
|
1,448 sq. feet
|
2 baths 3 beds |
show details | |

|
#36
Laura Dr
New Bern, NC 28562
|
1,634 sq. feet
|
2 baths 3 beds |
show details | |

|
#37
Didrikson Dr
New Bern, NC 28560
|
1,899 sq. feet
|
2 baths 3 beds |
show details | |

|
#38
Trinity Dr
New Bern, NC 28560
|
1,640 sq. feet
|
2 baths 3 beds |
show details | |

|
#39
Hawks Bluff Dr
New Bern, NC 28560
|
1,391 sq. feet
|
2 baths 3 beds |
show details | |

|
#40
Mill Creek Rd
Newport, NC 28570
|
1,662 sq. feet
|
2 baths 3 beds |
show details |
| Photo | Address | Area | Beds / Baths | Price | Details |
|---|---|---|---|---|---|

|
#41
Michele Dr
New Bern, NC 28560
|
1,446 sq. feet
|
2 baths 3 beds |
show details | |

|
#42
Teachey Ct
New Bern, NC 28562
|
1,493 sq. feet
|
2 baths 3 beds |
show details | |

|
#43
Carolina Pines Blvd
New Bern, NC 28560
|
1,689 sq. feet
|
2 baths - beds |
show details | |

|
#44
Woodland Dr
Swansboro, NC 28584
|
- sq. feet
|
2 baths 3 beds |
show details | |

|
#45
Bogue Loop Rd
Newport, NC 28570
|
- sq. feet
|
2 baths 3 beds |
show details | |

|
#46
Colony St
Newport, NC 28570
|
- sq. feet
|
2 baths 3 beds |
show details | |

|
#47
Janiero Rd
Oriental, NC 28571
|
2,128 sq. feet
|
- baths 3 beds |
show details | |

|
#48
Janiero Rd
Arapahoe, NC 28510
|
- sq. feet
|
- baths - beds |
show details | |

|
#49
Cyrus Pollard Rd Lot 6
Newport, NC 28570
|
- sq. feet
|
- baths - beds |
show details | |

|
Check over 1 million property listings on Foreclosure.com!
|
browse all offers | |||

Latest news about housing in Havelock, NC collected exclusively by city-data.com from local newspapers, TV, and radio stations


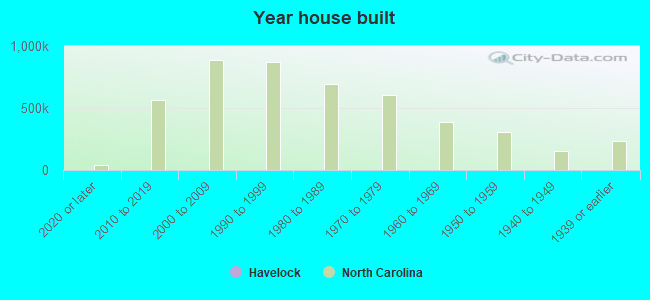
Median year apartment built: 1987
Household type by relationship:
Households: 16,721- Male householders: 3,131 (513 living alone), Female householders: 2,010 (584 living alone)
3,071 spouses (3,048 opposite-sex spouses), 305 unmarried partners, (289 opposite-sex unmarried partners), 4,360 children (4,088 natural, 105 adopted, 165 stepchildren), 144 grandchildren, 163 brothers or sisters, 101 parents, 5 foster children, 181 other relatives, 215 non-relatives
- In group quarters: 3,030
Size of family households: 1,813 2-persons, 919 3-persons, 760 4-persons, 234 5-persons, 157 6-persons, 95 7-or-more-persons.
Size of nonfamily households: 1,026 1-person, 310 2-persons, 13 3-persons, 37 4-persons.
3,056 married couples with children.
653 single-parent households (171 men, 482 women).
87.0% of residents of Havelock speak English at home.
9.1% of residents speak Spanish at home (77% speak English very well, 19% speak English well, 3% speak English not well, 1% don't speak English at all).
1.3% of residents speak other Indo-European language at home (93% speak English very well, 7% speak English well).
2.1% of residents speak Asian or Pacific Island language at home (55% speak English very well, 37% speak English well, 9% speak English not well).
Foreign born population: 616 (3.7%)
(73.4% of them are naturalized citizens)
| Here: | 6.5 |
| State: | 6.4 |
| Here: | 4.7 |
| State: | 4.4 |
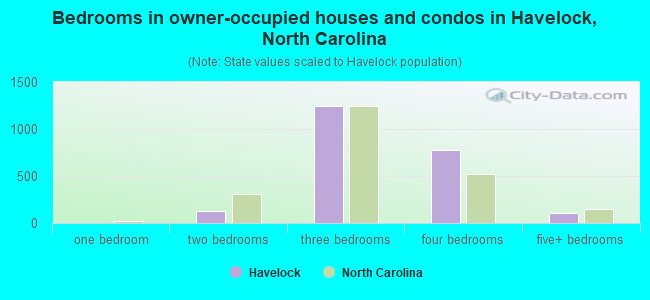
- Bedrooms in owner-occupied houses and condos in Havelock, North Carolina
- 0no bedroom
- 01 bedroom
- 1322 bedrooms
- 1,2423 bedrooms
- 7794 bedrooms
- 1075+ bedrooms
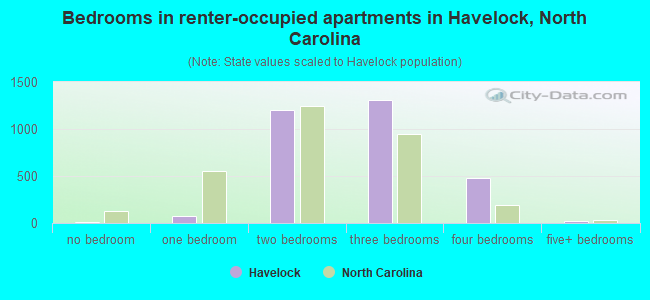
- Bedrooms in renter-occupied apartments in Havelock, North Carolina
- 15no bedroom
- 751 bedroom
- 1,1972 bedrooms
- 1,3083 bedrooms
- 4774 bedrooms
- 205+ bedrooms
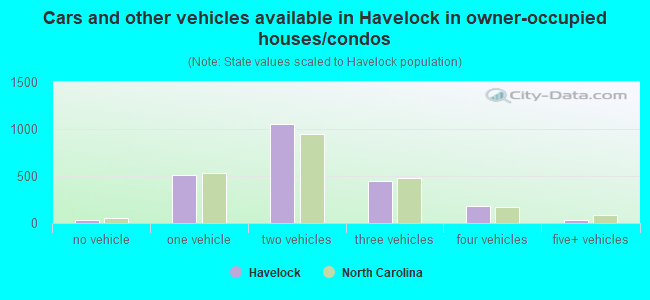
- Cars and other vehicles available in Havelock in owner-occupied houses/condos
- 32no vehicle
- 5151 vehicle
- 1,0562 vehicles
- 4443 vehicles
- 1854 vehicles
- 275+ vehicles
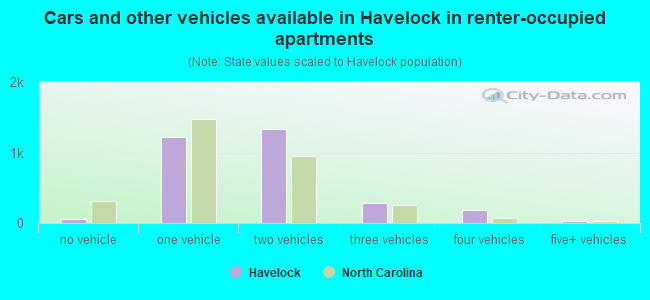
- Cars and other vehicles available in Havelock in renter-occupied apartments
- 56no vehicle
- 1,2191 vehicle
- 1,3292 vehicles
- 2793 vehicles
- 1814 vehicles
- 275+ vehicles
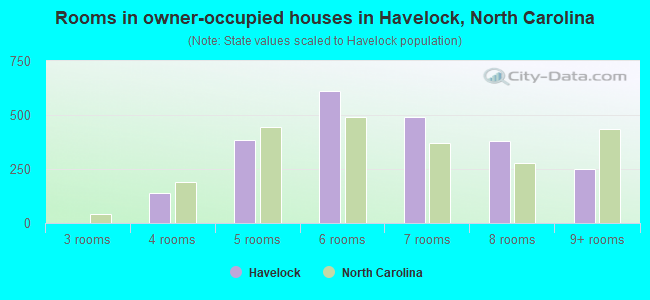
- Rooms in owner-occupied houses in Havelock, North Carolina
- 01 room
- 02 rooms
- 03 rooms
- 1394 rooms
- 3855 rooms
- 6126 rooms
- 4917 rooms
- 3818 rooms
- 2519+ rooms
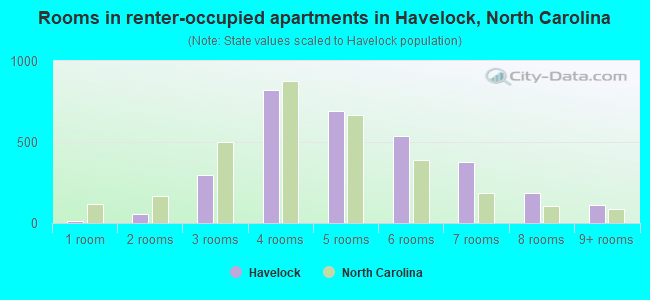
- Rooms in renter-occupied apartments in Havelock, North Carolina
- 151 room
- 552 rooms
- 2943 rooms
- 8224 rooms
- 6905 rooms
- 5406 rooms
- 3767 rooms
- 1868 rooms
- 1139+ rooms
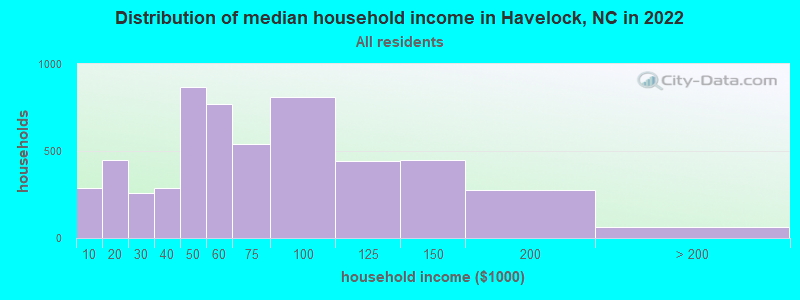
Havelock, NC household income distribution

- 287Less than $10,000
- 450$10,000 to $19,999
- 257$20,000 to $29,999
- 288$30,000 to $39,999
- 866$40,000 to $49,999
- 768$50,000 to $59,999
- 539$60,000 to $74,999
- 813$75,000 to $99,999
- 442$100,000 to $124,999
- 450$125,000 to $149,999
- 273$150,000 to $199,999
- 62$200,000 or more
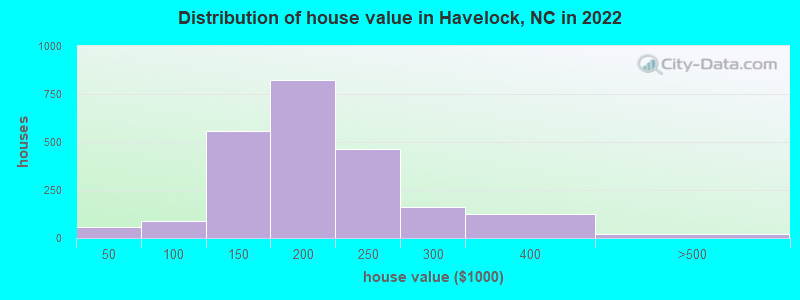
Home value of owner - occupied houses in 2022 in Havelock, NC
-
- 18$10,000 to $14,999
- 38$15,000 to $19,999
- 1$30,000 to $34,999
- 32$50,000 to $59,999
- 24$70,000 to $79,999
- 12$80,000 to $89,999
- 19$90,000 to $99,999
- 244$100,000 to $124,999
- 310$125,000 to $149,999
- 478$150,000 to $174,999
- 345$175,000 to $199,999
- 465$200,000 to $249,999
- 159$250,000 to $299,999
- 123$300,000 to $399,999
- 18$400,000 to $499,999
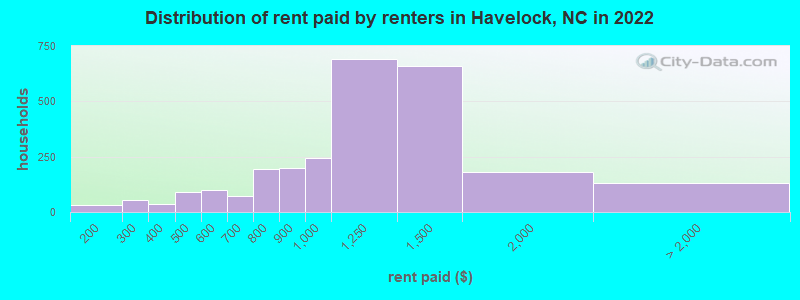
Rent paid by renters in 2022 in Havelock, NC
-
- 32$100 to $149
- 27$200 to $249
- 28$250 to $299
- 19$300 to $349
- 16$350 to $399
- 67$400 to $449
- 23$450 to $499
- 70$500 to $549
- 28$550 to $599
- 29$600 to $649
- 42$650 to $699
- 60$700 to $749
- 132$750 to $799
- 196$800 to $899
- 243$900 to $999
- 692$1,000 to $1,249
- 661$1,250 to $1,499
- 178$1,500 to $1,999
- 2$2,000 to $2,499
- 130No cash rent
Percentage of workers working in this county: 76.4%
Number of people working at home: 580 (6.0% of all workers)
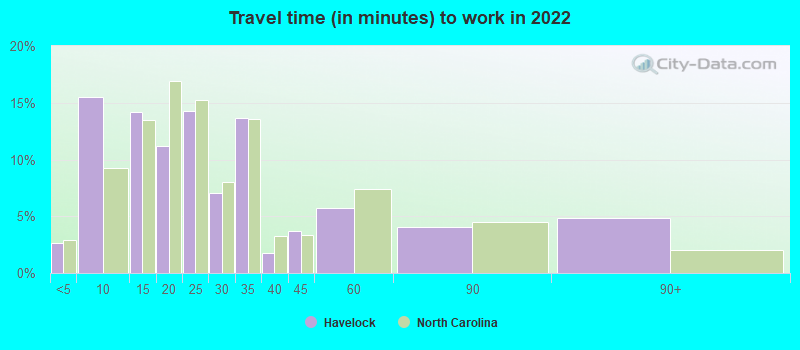
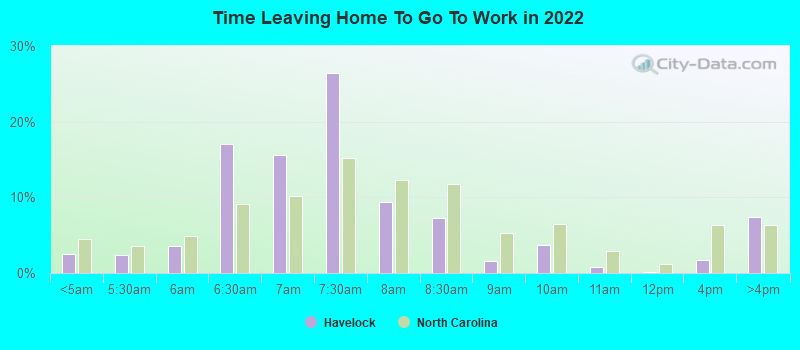
Travel time to work (commute)
- Less than 5 minutes: 700
- 5 to 9 minutes: 2,525
- 10 to 14 minutes: 1,990
- 15 to 19 minutes: 1,104
- 20 to 24 minutes: 994
- 25 to 29 minutes: 172
- 30 to 34 minutes: 920
- 35 to 39 minutes: 35
- 40 to 44 minutes: 57
- 45 to 59 minutes: 164
- 60 to 89 minutes: 113
- 90 or more minutes: 50
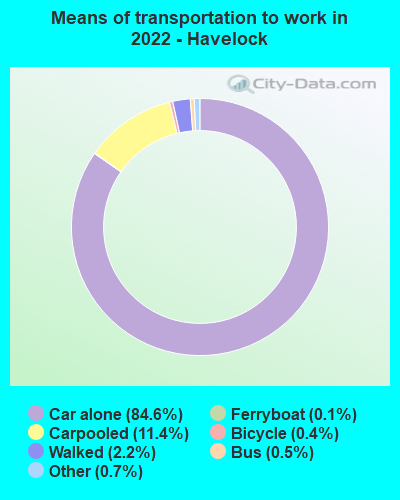
Means of transportation to work:
- Drove a car alone: 7,879 (76.7%)
- Carpooled: 1,112 (10.8%)
- Bus: 32 (0.3%)
- Ferryboat: 10 (0.1%)
- Taxi: 69 (0.7%)
- Bicycle: 41 (0.4%)
- Walked: 221 (2.2%)
- Worked at home: 580 (5.6%)
- Unemployment by race in 2022
- Unemployment rate for White non-Hispanic residents
- 2.7%Males
- 5.8%Females
- Unemployment rate for Black residents
- 1.3%Males
- 3.0%Females
- Unemployment rate for American Indian and Alaska Native residents
- 2.2%Males
- Unemployment rate for Asian residents
- 6.7%Females
- Unemployment rate for two or more race residents
- 8.9%Males
- 2.1%Females
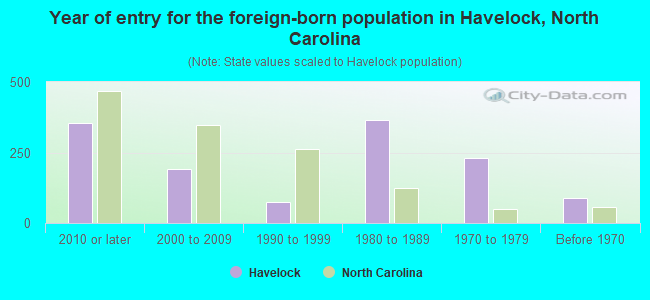
- Year of entry for the foreign-born population in Havelock, North Carolina
- 3552010 or later
- 1912000 to 2009
- 741990 to 1999
- 3671980 to 1989
- 2301970 to 1979
- 90Before 1970
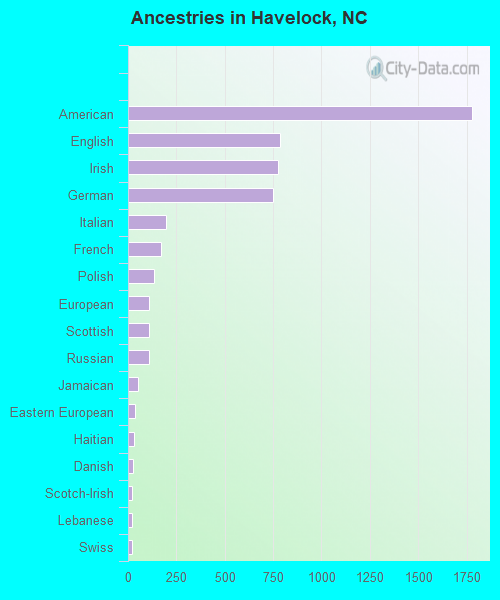
First ancestries reported:
- American: 1,777 (17.0%)
- English: 785 (7.5%)
- Irish: 775 (7.4%)
- German: 750 (7.2%)
- Italian: 194 (1.9%)
- French: 171 (1.6%)
- Polish: 135 (1.3%)
- European: 111 (1.1%)
- Scottish: 111 (1.1%)
- Russian: 108 (1.0%)
- Jamaican: 51 (0.5%)
- Eastern European: 35 (0.3%)
- Haitian: 30 (0.3%)
- Danish: 26 (0.2%)
- Scotch-Irish: 23 (0.2%)
- Lebanese: 21 (0.2%)
- Swiss: 19 (0.2%)
- Swedish: 15 (0.1%)
- Serbian: 14 (0.1%)
- Portuguese: 13 (0.1%)
- Czech: 9 (0.09%)
- Scandinavian: 9 (0.09%)
- Welsh: 8 (0.08%)
- African: 6 (0.06%)
- French Canadian: 5 (0.05%)
- Syrian: 2 (0.02%)
Most common places of birth for foreign-born residents (%):
| Havelock: | 16.0% (122) |
| North Carolina: | 2.4% (20,695) |
| Havelock: | 14.7% (112) |
| North Carolina: | 1.0% (9,005) |
| Havelock: | 12.4% (95) |
| North Carolina: | 0.7% (6,226) |
| Havelock: | 5.8% (44) |
| North Carolina: | 1.8% (15,988) |
| Havelock: | 5.2% (40) |
| North Carolina: | 0.1% (713) |
| Havelock: | 4.5% (34) |
| North Carolina: | 0.4% (3,066) |
| Havelock: | 4.1% (31) |
| North Carolina: | 1.3% (11,419) |
| Havelock: | 3.9% (30) |
| North Carolina: | 2.9% (24,965) |
| Havelock: | 3.9% (30) |
| North Carolina: | 0.1% (537) |
| Havelock: | 3.9% (30) |
| North Carolina: | 2.1% (18,105) |
| Havelock: | 3.8% (29) |
| North Carolina: | 1.8% (15,534) |
| Havelock: | 3.8% (29) |
| North Carolina: | 1.0% (8,426) |
| Havelock: | 3.4% (26) |
| North Carolina: | 0.9% (7,765) |
| Havelock: | 2.1% (16) |
| North Carolina: | 0.7% (5,941) |
| Havelock: | 1.6% (12) |
| North Carolina: | 0.6% (5,018) |
| Havelock: | 1.6% (12) |
| North Carolina: | 24.7% (214,776) |
Place of birth for U.S.-born residents:
- This state: 4,386
- Other state: 11,813
- Northeast: 2,199
- Midwest: 2,381
- South: 4,562
- West: 3,005
79.3% of Havelock residents lived in the same house 1 years ago.
Out of people who lived in different houses, 24.0% lived in this county.
Out of people who lived in different counties, 33.7% lived in North Carolina.
| Havelock: | 79.3% |
| State average: | 87.3% |
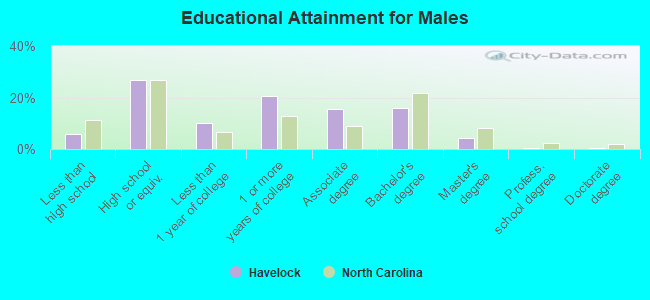
Education attainment for males 25 years and older:
- No schooling: 16
- Nursery to 4th grade: 0
- 5th and 6th grade: 49
- 7th and 8th grade: 12
- 9th grade: 11
- 10th grade: 49
- 11th grade: 13
- 12th grade, no diploma: 64
- High school graduate (or equivalency): 1,009
- Less than 1 year of college: 385
- Some college more than 1 year, no degree: 783
- Associate degree: 589
- Bachelor's degree: 604
- Master's degree: 165
- Professional school degree: 22
- Doctorate degree: 9
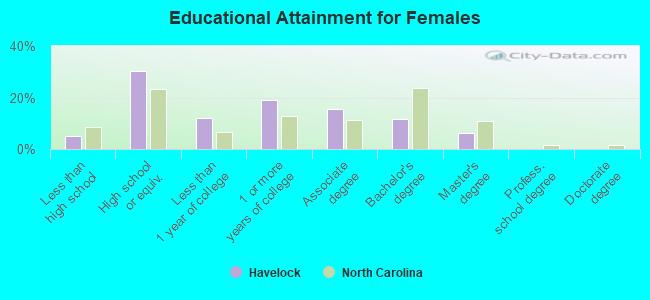
Education attainment for females 25 years and older:
- No schooling: 53
- Nursery to 4th grade: 12
- 5th and 6th grade: 2
- 7th and 8th grade: 38
- 9th grade: 28
- 10th grade: 0
- 11th grade: 23
- 12th grade, no diploma: 25
- High school graduate (or equivalency): 1,132
- Less than 1 year of college: 444
- Some college more than 1 year, no degree: 714
- Associate degree: 572
- Bachelor's degree: 436
- Master's degree: 234
- Professional school degree: 3
- Doctorate degree: 0
Housing units in structures:
- One, detached: 3,697
- One, attached: 1,130
- Two: 102
- 3 or 4: 355
- 5 to 9: 74
- 10 to 19: 98
- 20 to 49: 92
- 50 or more: 24
- Mobile homes: 369
Housing units lacking complete kitchen facilities in 2022: 0.1%
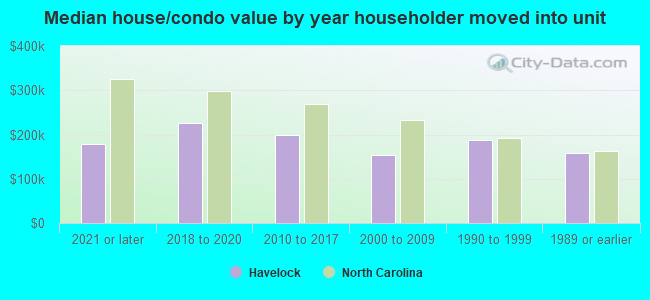
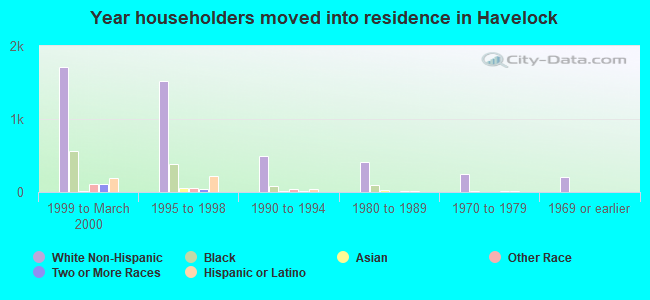
House/condo owner moved in on average 10 years ago
Renter moved in on average 3 years ago
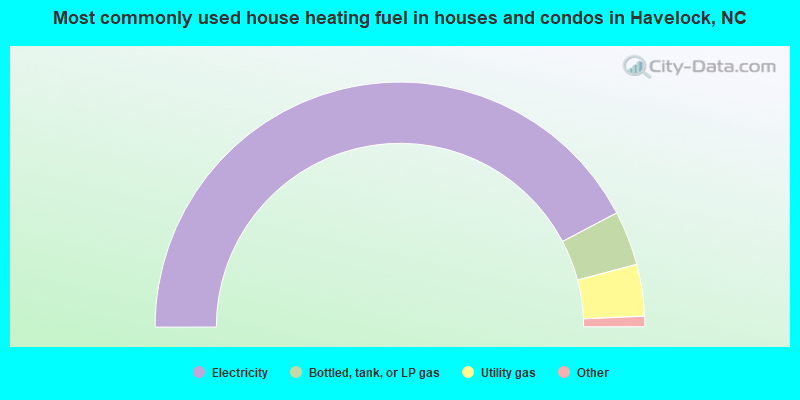
- 84.6%Electricity
- 7.2%Bottled, tank, or LP gas
- 6.8%Utility gas
- 0.6%No fuel used
- 0.4%Fuel oil, kerosene, etc.
- 0.4%Wood
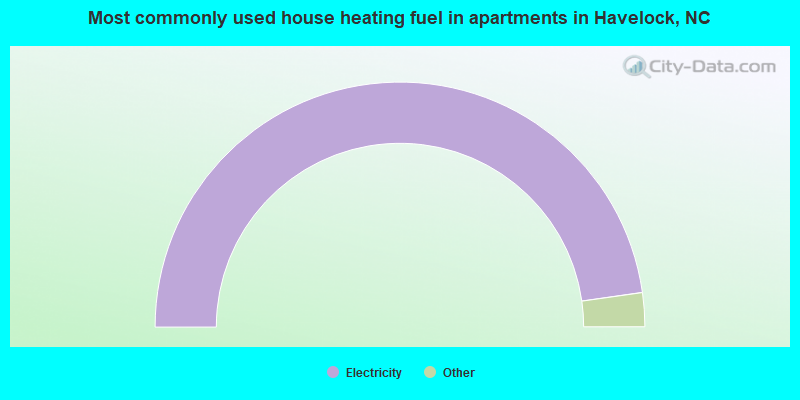
- 95.5%Electricity
- 1.6%Bottled, tank, or LP gas
- 1.2%Utility gas
- 0.9%No fuel used
- 0.7%Fuel oil, kerosene, etc.
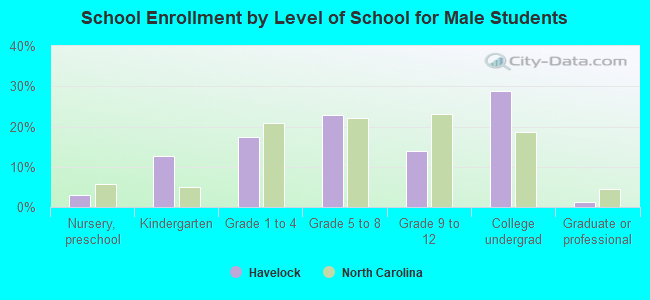
Private vs. public school enrollment:
| Here: | 12.3% |
| North Carolina: | 13.8% |
| Here: | 8.6% |
| North Carolina: | 11.9% |
| Here: | 28.4% |
| North Carolina: | 19.3% |