Races in Havelock, North Carolina (NC) Detailed Stats
Data:
Races - White alone (%)
Races - White alone (% change since 2000)
Races - Black alone (%)
Races - Black alone (% change since 2000)
Races - American Indian alone (%)
Races - American Indian alone (% change since 2000)
Races - Asian alone (%)
Races - Asian alone (% change since 2000)
Races - Hispanic (%)
Races - Hispanic (% change since 2000)
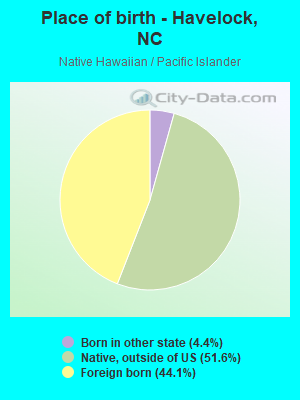
Races - Native Hawaiian and Other Pacific Islander alone (%)
Races - Native Hawaiian and Other Pacific Islander alone (% change since 2000)
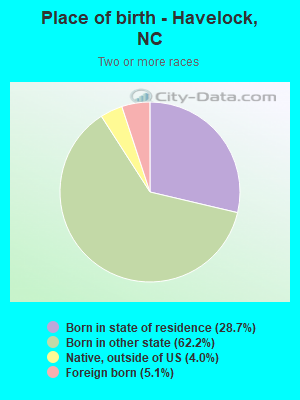
Races - Two or more races(%)
Races - Two or more races(% change since 2000)
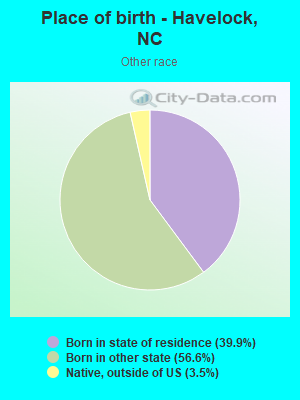
Races - Other race alone (%)
Races - Other race alone (% change since 2000)
Racial diversity
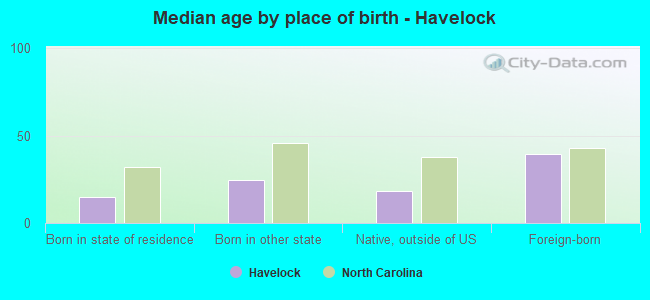
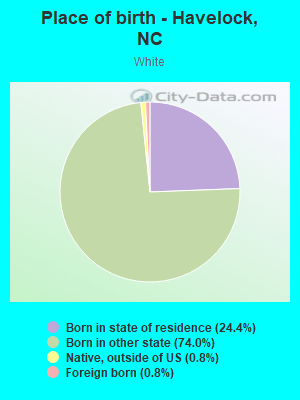
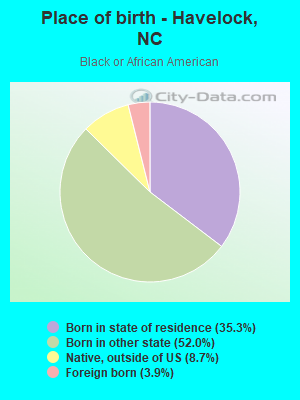
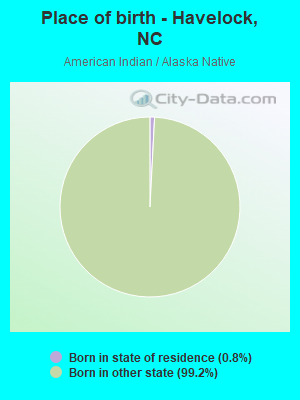
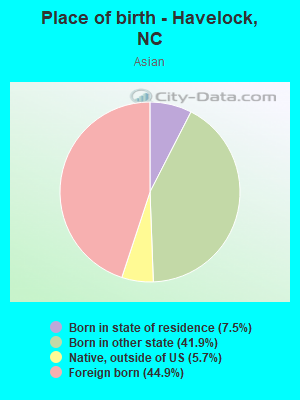
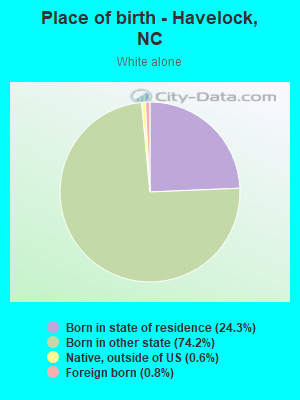
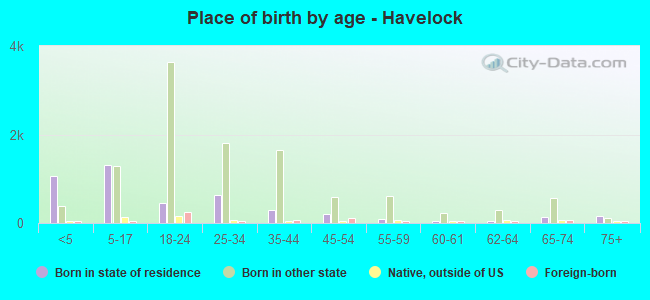
Place of birth - Born in state of residence (%)
Place of birth - Born in state of residence (%) - White
Place of birth - Born in state of residence (%) - Black or African American
Place of birth - Born in state of residence (%) - Asian
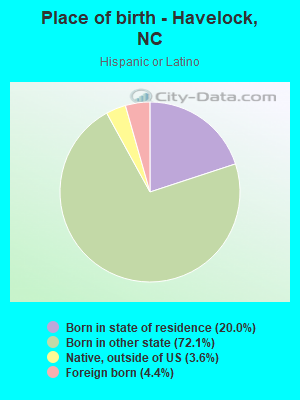
Place of birth - Born in state of residence (%) - Hispanic or Latino
Place of birth - Born in state of residence (%) - American Indian and Alaska Native
Place of birth - Born in state of residence (%) - Multirace
Place of birth - Born in state of residence (%) - Other Race
Place of birth - Born in other state (%)
Place of birth - Born in other state (%) - White
Place of birth - Born in other state (%) - Black or African American
Place of birth - Born in other state (%) - Asian
Place of birth - Born in other state (%) - Hispanic or Latino
Place of birth - Born in other state (%) - American Indian and Alaska Native
Place of birth - Born in other state (%) - Multirace
Place of birth - Born in other state (%) - Other Race
Place of birth - Native, outside of US (%)
Place of birth - Native, outside of US (%) - White
Place of birth - Native, outside of US (%) - Black or African American
Place of birth - Native, outside of US (%) - Asian
Place of birth - Native, outside of US (%) - Hispanic or Latino
Place of birth - Native, outside of US (%) - American Indian and Alaska Native
Place of birth - Native, outside of US (%) - Multirace
Place of birth - Native, outside of US (%) - Other Race
Place of birth - Foreign born (%)
Place of birth - Foreign born (%) - White
Place of birth - Foreign born (%) - Black or African American
Place of birth - Foreign born (%) - Asian
Place of birth - Foreign born (%) - Hispanic or Latino
Place of birth - Foreign born (%) - American Indian and Alaska Native
Place of birth - Foreign born (%) - Multirace
Place of birth - Foreign born (%) - Other Race
Residents speaking English at home (%)
Residents speaking English at home - Born in the United States (%)
Residents speaking English at home - Native, born elsewhere (%)
Residents speaking English at home - Foreign born (%)
Residents speaking Spanish at home (%)
Residents speaking Spanish at home - Born in the United States (%)
Residents speaking Spanish at home - Native, born elsewhere (%)
Residents speaking Spanish at home - Foreign born (%)
Residents speaking other language at home (%)
Residents speaking other language at home - Born in the United States (%)
Residents speaking other language at home - Native, born elsewhere (%)
Residents speaking other language at home - Foreign born (%)
Marital status - Never married (%)
Marital status - Now married (%)
Marital status - Separated (%)
Marital status - Widowed (%)
Marital status - Divorced (%)
Ancestries Reported - Arab (%)
Ancestries Reported - Czech (%)
Ancestries Reported - Danish (%)
Ancestries Reported - Dutch (%)
Ancestries Reported - English (%)
Ancestries Reported - French (%)
Ancestries Reported - French Canadian (%)
Ancestries Reported - German (%)
Ancestries Reported - Greek (%)
Ancestries Reported - Hungarian (%)
Ancestries Reported - Irish (%)
Ancestries Reported - Italian (%)
Ancestries Reported - Lithuanian (%)
Ancestries Reported - Norwegian (%)
Ancestries Reported - Polish (%)
Ancestries Reported - Portuguese (%)
Ancestries Reported - Russian (%)
Ancestries Reported - Scotch-Irish (%)
Ancestries Reported - Scottish (%)
Ancestries Reported - Slovak (%)
Ancestries Reported - Subsaharan African (%)
Ancestries Reported - Swedish (%)
Ancestries Reported - Swiss (%)
Ancestries Reported - Ukrainian (%)
Ancestries Reported - United States (%)
Ancestries Reported - Welsh (%)
Ancestries Reported - West Indian (%)
Ancestries Reported - Other (%)
Geographical mobility - Same house 1 year ago (%)
Geographical mobility - Same house 1 year ago (%) - White
Geographical mobility - Same house 1 year ago (%) - Black or African American
Geographical mobility - Same house 1 year ago (%) - Asian
Geographical mobility - Same house 1 year ago (%) - Hispanic or Latino
Geographical mobility - Same house 1 year ago (%) - American Indian and Alaska Native
Geographical mobility - Same house 1 year ago (%) - Multirace
Geographical mobility - Same house 1 year ago (%) - Other Race
Geographical mobility - Moved within same county (%)
Geographical mobility - Moved within same county (%) - White
Geographical mobility - Moved within same county (%) - Black or African American
Geographical mobility - Moved within same county (%) - Asian
Geographical mobility - Moved within same county (%) - Hispanic or Latino
Geographical mobility - Moved within same county (%) - American Indian and Alaska Native
Geographical mobility - Moved within same county (%) - Multirace
Geographical mobility - Moved within same county (%) - Other Race
Geographical mobility - Moved from different county within same state (%)
Geographical mobility - Moved from different county within same state (%) - White
Geographical mobility - Moved from different county within same state (%) - Black or African American
Geographical mobility - Moved from different county within same state (%) - Asian
Geographical mobility - Moved from different county within same state (%) - Hispanic or Latino
Geographical mobility - Moved from different county within same state (%) - American Indian and Alaska Native
Geographical mobility - Moved from different county within same state (%) - Multirace
Geographical mobility - Moved from different county within same state (%) - Other Race
Geographical mobility - Moved from different state (%)
Geographical mobility - Moved from different state (%) - White
Geographical mobility - Moved from different state (%) - Black or African American
Geographical mobility - Moved from different state (%) - Asian
Geographical mobility - Moved from different state (%) - Hispanic or Latino
Geographical mobility - Moved from different state (%) - American Indian and Alaska Native
Geographical mobility - Moved from different state (%) - Multirace
Geographical mobility - Moved from different state (%) - Other Race
Geographical mobility - Moved from abroad (%)
Geographical mobility - Moved from abroad (%) - White
Geographical mobility - Moved from abroad (%) - Black or African American
Geographical mobility - Moved from abroad (%) - Asian
Geographical mobility - Moved from abroad (%) - Hispanic or Latino
Geographical mobility - Moved from abroad (%) - American Indian and Alaska Native
Geographical mobility - Moved from abroad (%) - Multirace
Geographical mobility - Moved from abroad (%) - Other Race
Place of birth for the foreign-born population - Ireland (%)
Place of birth for the foreign-born population - Denmark (%)
Place of birth for the foreign-born population - Norway (%)
Place of birth for the foreign-born population - Sweden (%)
Place of birth for the foreign-born population - United Kingdom (%)
Place of birth for the foreign-born population - England (%)
Place of birth for the foreign-born population - Scotland (%)
Place of birth for the foreign-born population - Other Northern Europe (%)
Place of birth for the foreign-born population - Austria (%)
Place of birth for the foreign-born population - Belgium (%)
Place of birth for the foreign-born population - France (%)
Place of birth for the foreign-born population - Germany (%)
Place of birth for the foreign-born population - Netherlands (%)
Place of birth for the foreign-born population - Switzerland (%)
Place of birth for the foreign-born population - Other Western Europe (%)
Place of birth for the foreign-born population - Greece (%)
Place of birth for the foreign-born population - Italy (%)
Place of birth for the foreign-born population - Portugal (%)
Place of birth for the foreign-born population - Spain (%)
Place of birth for the foreign-born population - Other Southern Europe (%)
Place of birth for the foreign-born population - Albania (%)
Place of birth for the foreign-born population - Belarus (%)
Place of birth for the foreign-born population - Bosnia and Herzegovina (%)
Place of birth for the foreign-born population - Bulgaria (%)
Place of birth for the foreign-born population - Croatia (%)
Place of birth for the foreign-born population - Czechoslovakia (%)
Place of birth for the foreign-born population - Hungary (%)
Place of birth for the foreign-born population - Latvia (%)
Place of birth for the foreign-born population - Lithuania (%)
Place of birth for the foreign-born population - North Macedonia (Macedonia) (%)
Place of birth for the foreign-born population - Moldova (%)
Place of birth for the foreign-born population - Poland (%)
Place of birth for the foreign-born population - Romania (%)
Place of birth for the foreign-born population - Russia (%)
Place of birth for the foreign-born population - Serbia (%)
Place of birth for the foreign-born population - Ukraine (%)
Place of birth for the foreign-born population - Other Eastern Europe (%)
Place of birth for the foreign-born population - China (%)
Place of birth for the foreign-born population - Hong Kong (%)
Place of birth for the foreign-born population - Taiwan (%)
Place of birth for the foreign-born population - Japan (%)
Place of birth for the foreign-born population - Korea (%)
Place of birth for the foreign-born population - Other Eastern Asia (%)
Place of birth for the foreign-born population - Afghanistan (%)
Place of birth for the foreign-born population - Bangladesh (%)
Place of birth for the foreign-born population - India (%)
Place of birth for the foreign-born population - Iran (%)
Place of birth for the foreign-born population - Kazakhstan (%)
Place of birth for the foreign-born population - Nepal (%)
Place of birth for the foreign-born population - Pakistan (%)
Place of birth for the foreign-born population - Sri Lanka (%)
Place of birth for the foreign-born population - Uzbekistan (%)
Place of birth for the foreign-born population - Other South Central Asia (%)
Place of birth for the foreign-born population - Burma (%)
Place of birth for the foreign-born population - Cambodia (%)
Place of birth for the foreign-born population - Indonesia (%)
Place of birth for the foreign-born population - Laos (%)
Place of birth for the foreign-born population - Malaysia (%)
Place of birth for the foreign-born population - Philippines (%)
Place of birth for the foreign-born population - Singapore (%)
Place of birth for the foreign-born population - Thailand (%)
Place of birth for the foreign-born population - Vietnam (%)
Place of birth for the foreign-born population - Other South Eastern Asia (%)
Place of birth for the foreign-born population - Armenia (%)
Place of birth for the foreign-born population - Iraq (%)
Place of birth for the foreign-born population - Israel (%)
Place of birth for the foreign-born population - Jordan (%)
Place of birth for the foreign-born population - Kuwait (%)
Place of birth for the foreign-born population - Lebanon (%)
Place of birth for the foreign-born population - Saudi Arabia (%)
Place of birth for the foreign-born population - Syria (%)
Place of birth for the foreign-born population - Turkey (%)
Place of birth for the foreign-born population - Yemen (%)
Place of birth for the foreign-born population - Other Western Asia (%)
Place of birth for the foreign-born population - Eritrea (%)
Place of birth for the foreign-born population - Ethiopia (%)
Place of birth for the foreign-born population - Kenya (%)
Place of birth for the foreign-born population - Somalia (%)
Place of birth for the foreign-born population - Uganda (%)
Place of birth for the foreign-born population - Zimbabwe (%)
Place of birth for the foreign-born population - Other Eastern Africa (%)
Place of birth for the foreign-born population - Cameroon (%)
Place of birth for the foreign-born population - Congo (%)
Place of birth for the foreign-born population - Democratic Republic of Congo (Zaire) (%)
Place of birth for the foreign-born population - Other Middle Africa (%)
Place of birth for the foreign-born population - Egypt (%)
Place of birth for the foreign-born population - Morocco (%)
Place of birth for the foreign-born population - Sudan (%)
Place of birth for the foreign-born population - Other Northern Africa (%)
Place of birth for the foreign-born population - South Africa (%)
Place of birth for the foreign-born population - Other Southern Africa (%)
Place of birth for the foreign-born population - Cabo Verde (%)
Place of birth for the foreign-born population - Ghana (%)
Place of birth for the foreign-born population - Liberia (%)
Place of birth for the foreign-born population - Nigeria (%)
Place of birth for the foreign-born population - Senegal (%)
Place of birth for the foreign-born population - Sierra Leone (%)
Place of birth for the foreign-born population - Other Western Africa (%)
Place of birth for the foreign-born population - Australia (%)
Place of birth for the foreign-born population - New Zealand (%)
Place of birth for the foreign-born population - Fiji (%)
Place of birth for the foreign-born population - Micronesia (%)
Place of birth for the foreign-born population - Bahamas (%)
Place of birth for the foreign-born population - Barbados (%)
Place of birth for the foreign-born population - Cuba (%)
Place of birth for the foreign-born population - Dominica (%)
Place of birth for the foreign-born population - Dominican Republic (%)
Place of birth for the foreign-born population - Grenada (%)
Place of birth for the foreign-born population - Haiti (%)
Place of birth for the foreign-born population - Jamaica (%)
Place of birth for the foreign-born population - St. Vincent and the Grenadines (%)
Place of birth for the foreign-born population - Trinidad and Tobago (%)
Place of birth for the foreign-born population - West Indies (%)
Place of birth for the foreign-born population - Other Caribbean (%)
Place of birth for the foreign-born population - Belize (%)
Place of birth for the foreign-born population - Costa Rica (%)
Place of birth for the foreign-born population - El Salvador (%)
Place of birth for the foreign-born population - Guatemala (%)
Place of birth for the foreign-born population - Honduras (%)
Place of birth for the foreign-born population - Mexico (%)
Place of birth for the foreign-born population - Nicaragua (%)
Place of birth for the foreign-born population - Panama (%)
Place of birth for the foreign-born population - Other Central America (%)
Place of birth for the foreign-born population - Argentina (%)
Place of birth for the foreign-born population - Bolivia (%)
Place of birth for the foreign-born population - Brazil (%)
Place of birth for the foreign-born population - Chile (%)
Place of birth for the foreign-born population - Colombia (%)
Place of birth for the foreign-born population - Ecuador (%)
Place of birth for the foreign-born population - Guyana (%)
Place of birth for the foreign-born population - Peru (%)
Place of birth for the foreign-born population - Uruguay (%)
Place of birth for the foreign-born population - Venezuela (%)
Place of birth for the foreign-born population - Other South America (%)
Place of birth for the foreign-born population - Canada (%)
Place of birth for the foreign-born population - Other Northern America (%)
Place of birth for the foreign-born population - Other (%)
Latest news about races in Havelock, NC collected exclusively by city-data.com from local newspapers, TV, and radio stations
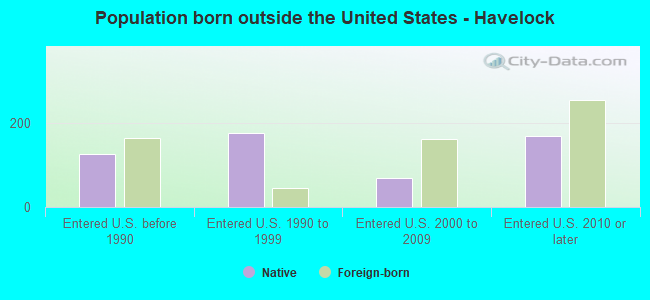
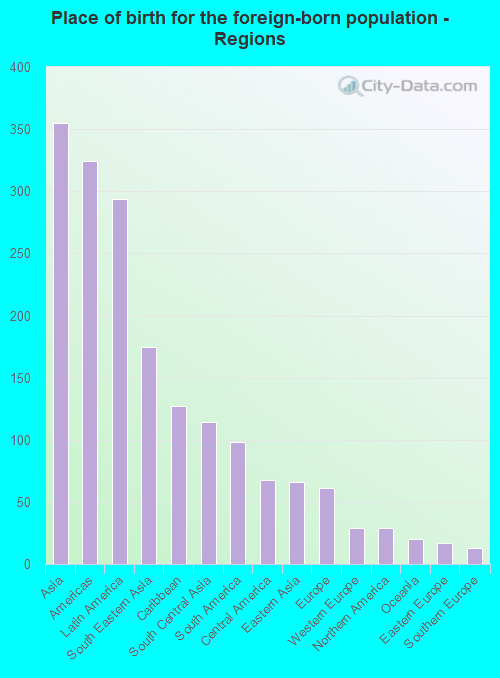
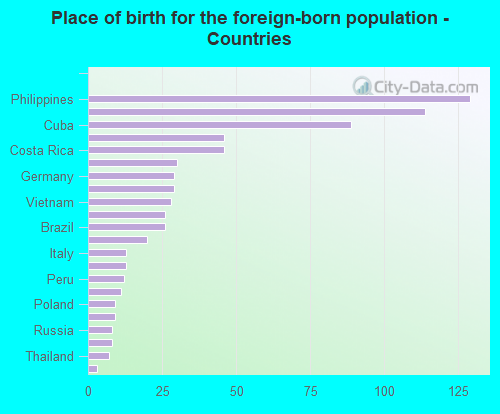
According to 2022 data, the most numerous races in Havelock, NC are White alone (9,644 residents), Black alone (2,183 residents), and Hispanic (2,854 residents). 88.0% of Havelock residents speak English at home. 4.6% of Havelock, NC residents are foreign-born (2.0% born in Asia, 1.7% born in Latin America), which is 75.1% less than the foreign-born rate of 8.0% across the entire state of North Carolina.
Race distribution in Havelock
2000 2022
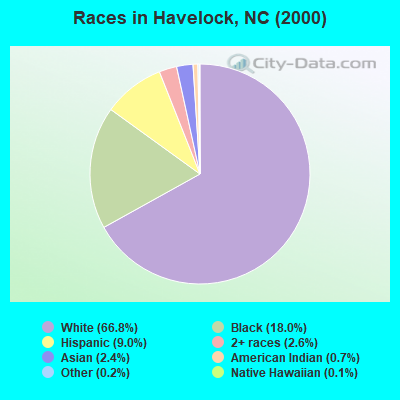
5,647,155 70.2% White alone 1,723,301 21.4% Black alone 378,963 4.7% Hispanic 112,416 1.4% Asian alone 95,333 1.2% American Indian alone 79,965 1.0% Two or more races 9,015 0.1% Other race alone 3,165 0.04% Native Hawaiian and Other
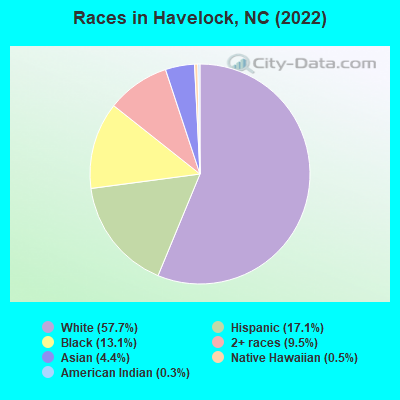
6,497,519 60.7% White alone 2,155,650 20.1% Black alone 1,114,799 10.4% Hispanic 438,061 4.1% Two or more races 341,052 3.2% Asian alone 91,758 0.9% American Indian alone 50,180 0.5% Other race alone 9,954 0.09% Native Hawaiian and Other
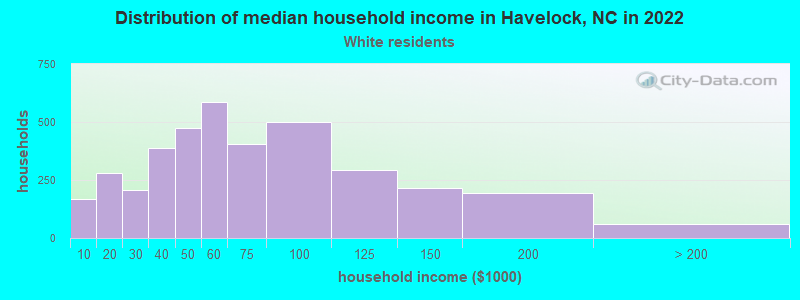
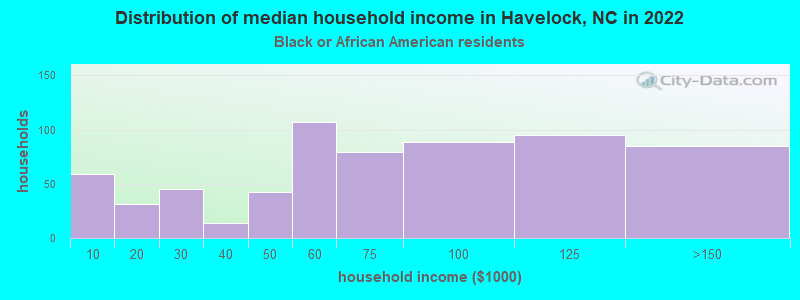
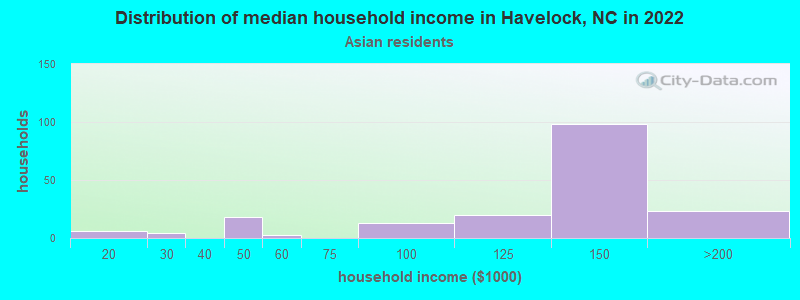
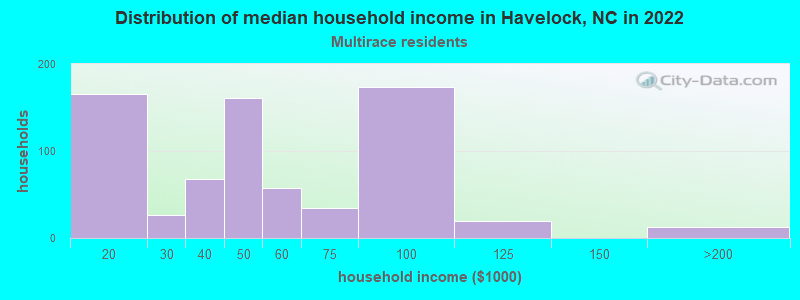
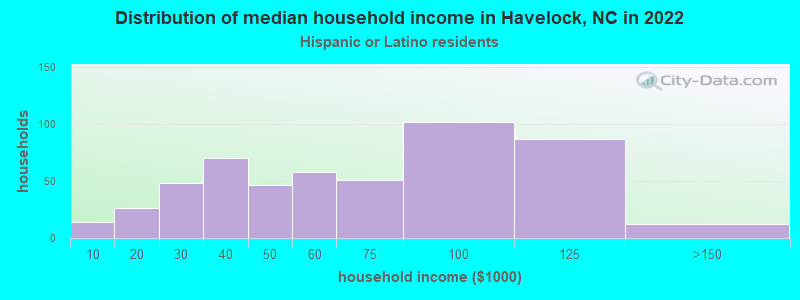
Income and house value in Havelock Median household income in 2022 $59,205 White non-Hispanic householders$67,043 Black householders$69,433 Asian householders$120,976 Native Hawaiian and other Pacific Islander householders$55,976 Two or more races householders$69,177 Hispanic or Latino race householdersMedian 2022 house value $188,862 White Non-Hispanic householders$194,083 Black or African American householders$312,122 American Indian or Alaska Native householders $192,948 Asian householders$368,872 Native Hawaiian and other Pacific Islander householders$193,402 Some other race householders$256,961 Two or more races householders$194,991 Hispanic or Latino householders
Median age by race in Havelock
26.1 Median age for White residents25.4 27.5 33.6 Median age for Black or African American residents30.9 37.8 29.3 Median age for American Indian / Alaska Native residents15.1 -669,910,786.0 22.0 Median age for Asian residents21.7 23.7 19.1 Median age for Native Hawaiian / Pacific Islander residents19.1 -612,403,100.2 23.2 Median age for Other race residents20.2 24.1 19.4 Median age for Two or more races residents19.3 23.4 25.0 Median age for White alone residents25.1 26.8 21.8 Median age for Hispanic or Latino residents19.3 26.1
Owner/renter occupied households by race in Havelock
House owners and renters - White residents 1,669 49.1% Owner occupied1,733 50.9% Renter occupiedHouse owners and renters - Black or African American residents 338 47.1% Owner occupied379 52.9% Renter occupiedHouse owners and renters - American Indian / Alaska Native residents 28 100.0% Owner occupiedHouse owners and renters - Asian residents 154 82.2% Owner occupied33 17.8% Renter occupiedHouse owners and renters - Native Hawaiian / Pacific Islander residents 20 100.0% Renter occupiedHouse owners and renters - Other race residents 114 100.0% Renter occupiedHouse owners and renters - Two or more races residents 267 25.3% Owner occupied788 74.7% Renter occupiedHouse owners and renters - White alone residents 1,556 49.0% Owner occupied1,623 51.0% Renter occupiedHouse owners and renters - Hispanic or Latino residents 203 44.0% Owner occupied258 56.0% Renter occupied
Language usage in Havelock
English speakers - Total 88.0% of residents of Havelock speak English at home.
8.2% of residents speak Spanish at home 1,096 87.8% Speak English very well153 12.2% Speak English less than very well4.2% of residents speak other language at home 505 78.5% Speak English very well138 21.5% Speak English less than very well
English speakers - Born in the United States 88.9% of residents of Havelock speak English at home.
10.2% of residents speak Spanish at home 1,115 96.4% Speak English very well42 3.6% Speak English less than very well1.2% of residents speak other language at home 124 91.2% Speak English very well12 8.8% Speak English less than very well
English speakers - Native, born elsewhere 59.8% of residents of Havelock speak English at home.
34.8% of residents speak Spanish at home 143 76.9% Speak English very well43 23.1% Speak English less than very well
English speakers - Foreign-born 40.1% of residents of Havelock speak English at home.
18.5% of residents speak Spanish at home 44 38.3% Speak English very well71 61.7% Speak English less than very well47.3% of residents speak other language at home 189 64.3% Speak English very well105 35.7% Speak English less than very well
White (Caucasian) - Speak only English Native:
95.8% (9,068)Foreign-born:
37.3% (32)
White (Caucasian) - Speak another language Native:
4.5% (424)Foreign-born:
100.0% (85)
Black or African American - Speak only English Native:
93.5% (1,922)Foreign-born:
34.4% (36)
Black or African American - Speak another language Native:
7.8% (160)Foreign-born:
30.7% (32)
Asian - Speak only English Native:
55.3% (245)Foreign-born:
48.1% (166)
Asian - Speak another language Native:
32.4% (144)Foreign-born:
65.8% (227)
Two or more races - Speak only English Native:
74.0% (1,418)Foreign-born:
29.8% (37)
Two or more races - Speak another language Native:
26.5% (508)Foreign-born:
68.4% (84)
White alone - Speak only English Native:
98.1% (8,543)Foreign-born:
39.5% (32)
White alone - Speak another language Native:
1.7% (145)Foreign-born:
66.2% (53)
Hispanic or Latino - Speak only English Native:
59.8% (1,562)Foreign-born:
20.7% (28)
Hispanic or Latino - Speak another language Native:
40.5% (1,058)Foreign-born:
74.8% (103)
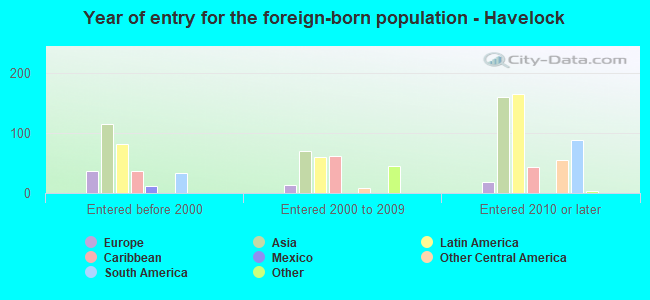
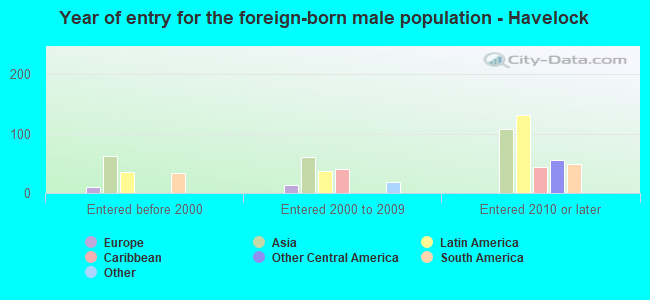
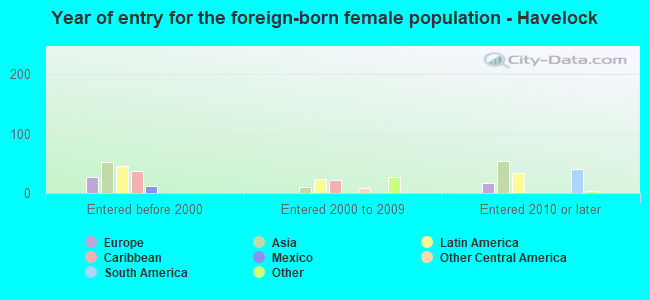
Foreign-born residents in Havelock 764 residents are foreign born (2.0% Asia , 1.7% Latin America ).
This city:
4.6%North Carolina:
8.3%
Marital status for residents in Havelock Marital status - White (Caucasian) population 15 years and over
Males 45.6% Never married47.6% Now married1.7% Separated1.6% Widowed3.5% DivorcedFemales 14.5% Never married68.0% Now married4.4% Separated7.2% Widowed5.8% DivorcedWomen who gave birth in the past 12 months Now married:
97.6% (307)Unmarried:
2.4% (7)
Women who did not give birth in the past 12 months Now married:
72.4% (1,430)Unmarried:
27.6% (546)
Marital status - Black or African American population 15 years and over
Males 46.7% Never married51.1% Now married1.0% Separated0.0% Widowed1.2% DivorcedFemales 39.6% Never married42.0% Now married3.7% Separated2.0% Widowed12.7% DivorcedWomen who gave birth in the past 12 months Now married:
100.0% (54)Unmarried:
0.0% (0)
Women who did not give birth in the past 12 months Now married:
30.9% (162)Unmarried:
69.1% (362)
Marital status - Asian population 15 years and over
Males 68.7% Never married29.4% Now married0.0% Separated0.0% Widowed1.9% DivorcedFemales 14.0% Never married77.4% Now married0.0% Separated8.5% Widowed0.0% DivorcedWomen who did not give birth in the past 12 months Now married:
78.7% (89)Unmarried:
21.3% (24)
Marital status - Native Hawaiian / Pacific Islander population 15 years and over
Males 55.9% Never married44.1% Now married0.0% Separated0.0% Widowed0.0% DivorcedFemales 0.0% Never married100.0% Now married0.0% Separated0.0% Widowed0.0% DivorcedWomen who gave birth in the past 12 months Now married:
100.0% (7)Unmarried:
0.0% (0)
Marital status - Other race population 15 years and over
Males 73.3% Never married26.7% Now married0.0% Separated0.0% Widowed0.0% DivorcedFemales 9.4% Never married75.4% Now married6.4% Separated0.0% Widowed8.8% DivorcedWomen who gave birth in the past 12 months Now married:
100.0% (5)Unmarried:
0.0% (0)
Women who did not give birth in the past 12 months Now married:
81.4% (187)Unmarried:
18.6% (43)
Marital status - Two or more races population 15 years and over
Males 56.8% Never married20.0% Now married0.0% Separated0.0% Widowed23.2% DivorcedFemales 33.6% Never married52.6% Now married2.8% Separated11.0% Widowed0.0% DivorcedWomen who gave birth in the past 12 months Now married:
100.0% (29)Unmarried:
0.0% (0)
Women who did not give birth in the past 12 months Now married:
55.8% (197)Unmarried:
44.2% (156)
Marital status - White alone, not Hispanic / Latino population 15 years and over
Males 43.0% Never married49.8% Now married1.9% Separated1.3% Widowed4.0% DivorcedFemales 13.3% Never married67.9% Now married4.8% Separated7.8% Widowed6.3% DivorcedWomen who gave birth in the past 12 months Now married:
97.4% (296)Unmarried:
2.6% (8)
Women who did not give birth in the past 12 months Now married:
73.6% (1,389)Unmarried:
26.4% (498)
Marital status - Hispanic or Latino population 15 years and over
Males 66.7% Never married25.1% Now married0.4% Separated2.0% Widowed5.9% DivorcedFemales 30.7% Never married65.3% Now married1.7% Separated0.0% Widowed2.3% DivorcedWomen who gave birth in the past 12 months Now married:
100.0% (31)Unmarried:
0.0% (0)
Women who did not give birth in the past 12 months Now married:
58.6% (325)Unmarried:
41.4% (230)
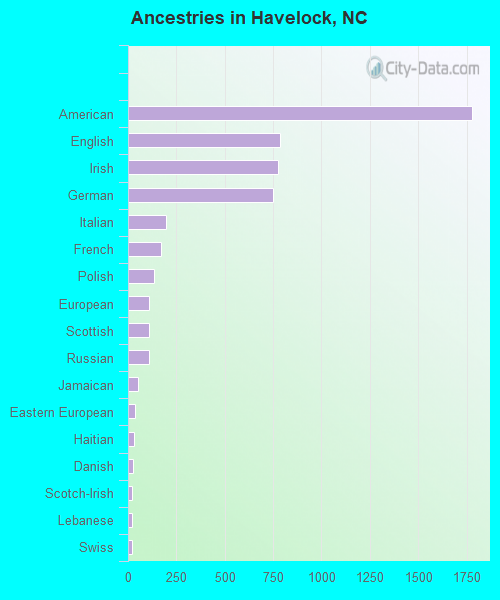
Ancestries in Havelock
1,777 17.0% American785 7.5% English775 7.4% Irish750 7.2% German194 1.9% Italian171 1.6% French135 1.3% Polish111 1.1% European111 1.1% Scottish108 1.0% Russian51 0.5% Jamaican35 0.3% Eastern European30 0.3% Haitian26 0.2% Danish23 0.2% Scotch-Irish21 0.2% Lebanese19 0.2% Swiss15 0.1% Swedish14 0.1% Serbian13 0.1% Portuguese9 0.09% Czech9 0.09% Scandinavian8 0.08% Welsh6 0.06% African5 0.05% French Canadian2 0.02% Syrian
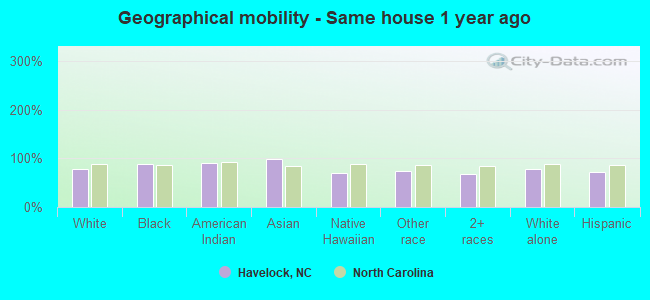
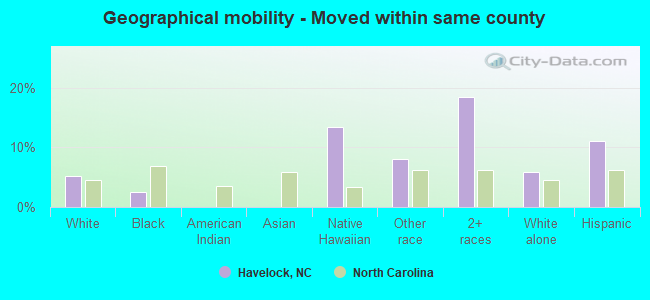
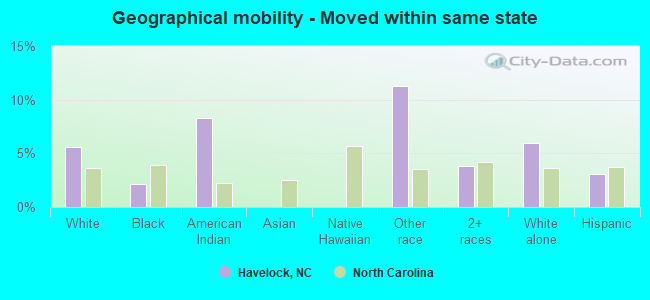
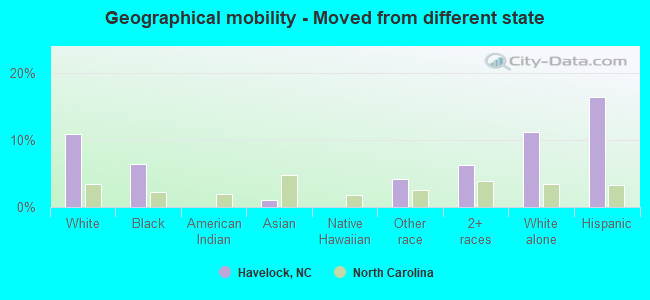
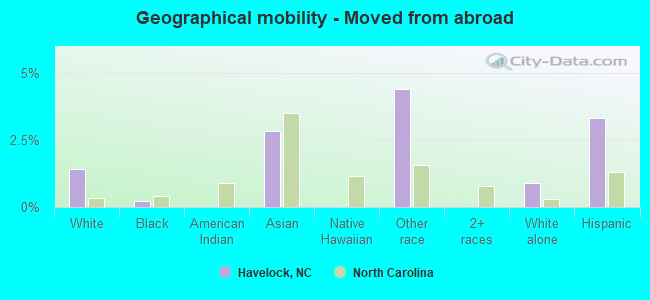
Geographical mobility in Havelock Same house 1 year ago 8,057 78.2% White (Caucasian)2,028 88.8% Black or African American102 91.1% American Indian / Alaska Native722 98.3% Asian46 69.0% Native Hawaiian / Pacific Islander445 73.1% Other race2,246 68.3% Two or more races7,317 77.4% White alone, not Hispanic / Latino2,007 71.2% Hispanic or LatinoMoved within same county 532 5.2% White / Caucasian56 2.5% Black or African American9 13.4% Native Hawaiian / Pacific Islander49 8.1% Other race607 18.5% Two or more races548 5.8% White alone, not Hispanic / Latino312 11.1% Hispanic or LatinoMoved within same state 575 5.6% White / Caucasian50 2.2% Black or African American9 8.3% American Indian / Alaska Native69 11.3% Other race125 3.8% Two or more races567 6.0% White alone, not Hispanic / Latino87 3.1% Hispanic or LatinoMoved from different state 1,124 10.9% White / Caucasian146 6.4% Black or African American8 1.1% Asian25 4.1% Other race204 6.2% Two or more races1,053 11.1% White alone, not Hispanic / Latino462 16.4% Hispanic or LatinoMoved from abroad 147 1.4% White5 0.2% Black or African American21 2.8% Asian27 4.4% Other race85 0.9% White alone, not Hispanic / Latino94 3.3% Hispanic or Latino
Children Nativity (place of birth) in Havelock
Children under 6 years - Living with two parents Both parents native 1,332 100.0% NativeBoth parents foreign-born 104 100.0% NativeOne native, one foreign-born parent 29 100.0% NativeChildren under 6 years - Living with one parent Native parent 230 100.0% NativeChildren 6 to 17 years - Living with two parents Both parents native 1,433 100.0% NativeBoth parents foreign-born 36 69.2% Native16 30.8% Foreign-bornOne native, one foreign-born parent 58 74.6% Native20 25.4% Foreign-bornChildren 6 to 17 years - Living with one parent Native parent 617 100.0% Native
Grandparents responsible for own grandchildren in Havelock
Grandparents (30 to 59 years) White / Caucasian 44 100.0% Responsible for grandchildrenWhite alone, not Hispanic / Latino 47 100.0% Responsible for grandchildrenGrandparents (60 years and over) White / Caucasian 15 71.1% Responsible for grandchildren6 28.9% Not responsible for grandchildrenWhite alone, not Hispanic / Latino 16 71.2% Responsible for grandchildren6 28.8% Not responsible for grandchildren