Hastings, NE (Nebraska) Houses and Residents
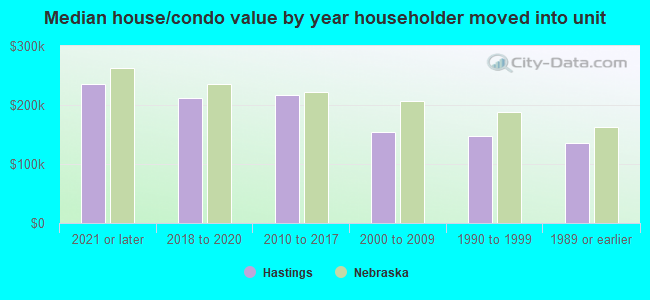
| Hastings: | $176,787 |
| Nebraska: | $232,400 |
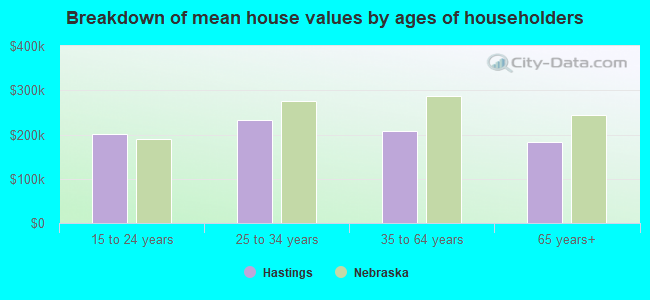
Mean price in 2022:
Detached houses: $207,385
Here: $207,385 State: $274,677 Townhouses or other attached units: $246,995
Here: $246,995 State: $245,619 In 5-or-more-unit structures: $965,646
Here: $965,646 State: $476,911 Mobile homes: $36,917
Here: $36,917 State: $67,339
Total population: 24,915 (Urban population: 23,851 (all inside urban clusters), Rural population: 220 (all nonfarm))
Houses: 11,460 (10,540 occupied: 6,807 owner occupied, 3,896 renter occupied)
| % of renters here: | 36% |
| State: | 34% |
Housing density: 1,166 houses/condos per square mile
Median price asked for vacant for-sale houses and condos in 2022: $87,460.
Median contract rent in 2022: $679 (lower quartile is $521, upper quartile is $823)
Median rent asked for vacant for-rent units in 2022: $670
Median gross rent in Hastings, NE in 2022: $810
Housing units in Hastings with a mortgage: 3,724 (244 second mortgage, 5 home equity loan, 163 both second mortgage and home equity loan)
Houses without a mortgage: 59
Median household income for houses/condos with a mortgage: $87,218
Median household income for apartments without a mortgage: $57,828
Median monthly housing costs: $853
Compare current foreclosures near Hastings, NE:
| Photo | Address | Area | Beds / Baths | Price | Details |
|---|---|---|---|---|---|

|
#1
W 5th St
Hastings, NE 68901
|
2,191 sq. feet
|
2 baths 3 beds |
show details | |

|
#2
Shoreside Cv
Hastings, NE 68901
|
1,358 sq. feet
|
3 baths 3 beds |
show details | |

|
#3
W 5th St
Hastings, NE 68901
|
888 sq. feet
|
2 baths 2 beds |
show details | |

|
#4
W 7th St
Hastings, NE 68901
|
864 sq. feet
|
1 baths 3 beds |
show details | |

|
#5
N Briggs Ave
Hastings, NE 68901
|
2,200 sq. feet
|
2 baths 4 beds |
show details | |

|
#6
S Rhode Island Ave
Hastings, NE 68901
|
1,020 sq. feet
|
1 baths 2 beds |
show details | |

|
#7
S Minnesota Ave
Hastings, NE 68901
|
1,554 sq. feet
|
1 baths 2 beds |
show details | |

|
#8
W 5th St
Hastings, NE 68901
|
976 sq. feet
|
1 baths 2 beds |
show details | |

|
#9
S Garfield Ave
Hastings, NE 68901
|
689 sq. feet
|
1 baths 1 beds |
show details | |

|
#10
N California Ave
Hastings, NE 68901
|
846 sq. feet
|
1 baths 2 beds |
show details |
| Photo | Address | Area | Beds / Baths | Price | Details |
|---|---|---|---|---|---|

|
#11
N Colorado Ave
Hastings, NE 68901
|
1,428 sq. feet
|
1 baths 3 beds |
show details | |

|
#12
W 5th St
Hastings, NE 68901
|
2,191 sq. feet
|
2 baths 3 beds |
show details | |

|
#13
S Denver Ave
Hastings, NE 68901
|
1,172 sq. feet
|
1 baths 3 beds |
show details | |

|
#14
University St
Hastings, NE 68901
|
1,025 sq. feet
|
2 baths 3 beds |
show details | |

|
#15
N Saunders Ave
Hastings, NE 68901
|
- sq. feet
|
- baths - beds |
show details | |

|
#16
S Pine Ave, Trlr 154
Hastings, NE 68901
|
- sq. feet
|
- baths - beds |
show details | |

|
#17
E 2nd St Apt 4
Hastings, NE 68901
|
- sq. feet
|
- baths - beds |
show details | |

|
#18
Mcdonald Ave
Hastings, NE 68901
|
- sq. feet
|
- baths - beds |
show details | |

|
#19
E 31st St, Apt 34
Hastings, NE 68901
|
- sq. feet
|
- baths - beds |
show details | |

|
#20
Lane A
Hastings, NE 68901
|
- sq. feet
|
- baths - beds |
show details |
| Photo | Address | Area | Beds / Baths | Price | Details |
|---|---|---|---|---|---|

|
#21
Park Lane Dr Apt 12
Hastings, NE 68901
|
- sq. feet
|
- baths - beds |
show details | |

|
#22
W E St
Hastings, NE 68901
|
- sq. feet
|
- baths - beds |
show details | |

|
#23
Cranbrook Ln
Hastings, NE 68901
|
- sq. feet
|
- baths - beds |
show details | |

|
#24
W 6th St
Hastings, NE 68901
|
- sq. feet
|
- baths - beds |
show details | |

|
#25
S Wabash Ave Apt 217
Hastings, NE 68901
|
- sq. feet
|
- baths - beds |
show details | |

|
#26
S Emerson Ave
Hastings, NE 68901
|
- sq. feet
|
- baths - beds |
show details | |

|
#27
N Burlington Ave
Hastings, NE 68901
|
- sq. feet
|
- baths - beds |
show details | |

|
#28
E 31st St, Apt 44
Hastings, NE 68901
|
- sq. feet
|
- baths - beds |
show details | |

|
#29
N Harlan Ave
Harvard, NE 68944
|
868 sq. feet
|
1 baths 2 beds |
show details | |

|
#30
W 5th St
Juniata, NE 68955
|
- sq. feet
|
- baths - beds |
show details |
| Photo | Address | Area | Beds / Baths | Price | Details |
|---|---|---|---|---|---|

|
#31
Courtland St
Trumbull, NE 68980
|
- sq. feet
|
- baths - beds |
show details | |

|
Check over 1 million property listings on Foreclosure.com!
|
browse all offers | |||

Latest news about housing in Hastings, NE collected exclusively by city-data.com from local newspapers, TV, and radio stations

 | Moving to Hastings Nebraska (3 replies) |
| The major differences between people in Texas and Nebraska (109 replies) |
| Differences between NE, IA and KS (46 replies) |
| Short-term housing near Grand Island/Hastings NE (5 replies) |
| and someone please give me some information on Hastings? (7 replies) |
| Hastings, worth the move? Need advice (24 replies) |
Median year apartment built: 1967
Household type by relationship:
Households: 25,213- Male householders: 4,881 (1,589 living alone), Female householders: 5,514 (1,862 living alone)
4,450 spouses (4,410 opposite-sex spouses), 789 unmarried partners, (773 opposite-sex unmarried partners), 6,351 children (5,630 natural, 320 adopted, 400 stepchildren), 667 grandchildren, 185 brothers or sisters, 132 parents, 227 foster children, 175 other relatives, 573 non-relatives
- In group quarters: 1,263
Size of family households: 3,197 2-persons, 1,183 3-persons, 986 4-persons, 658 5-persons, 199 6-persons, 89 7-or-more-persons.
Size of nonfamily households: 3,642 1-person, 644 2-persons, 76 3-persons, 20 4-persons, 11 5-persons.
3,573 married couples with children.
1,521 single-parent households (313 men, 1,208 women).
89.2% of residents of Hastings speak English at home.
8.5% of residents speak Spanish at home (50% speak English very well, 27% speak English well, 16% speak English not well, 7% don't speak English at all).
0.3% of residents speak other Indo-European language at home (100% speak English very well).
1.2% of residents speak Asian or Pacific Island language at home (18% speak English very well, 51% speak English well, 21% speak English not well, 10% don't speak English at all).
0.3% of residents speak other language at home (82% speak English very well, 14% speak English well, 4% speak English not well).
Foreign born population: 1,801 (7.1%)
(31.3% of them are naturalized citizens)
| Here: | 7.0 |
| State: | 7.1 |
| Here: | 4.2 |
| State: | 4.2 |
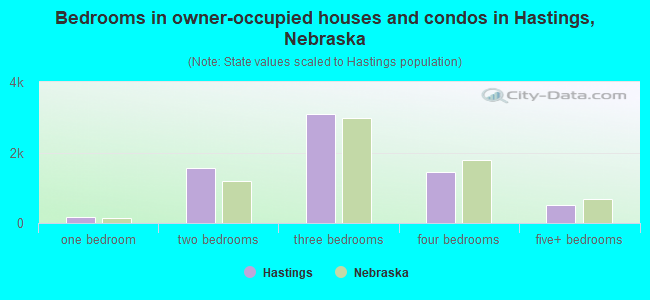
- Bedrooms in owner-occupied houses and condos in Hastings, Nebraska
- 16no bedroom
- 1841 bedroom
- 1,5632 bedrooms
- 3,0953 bedrooms
- 1,4474 bedrooms
- 5035+ bedrooms
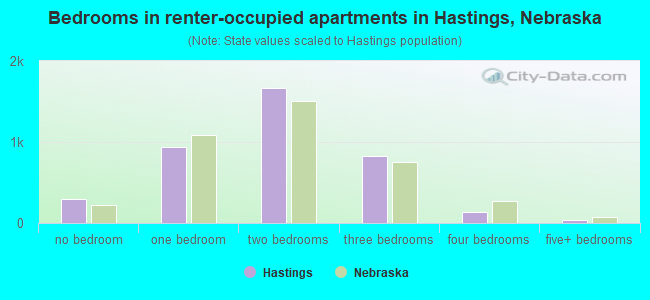
- Bedrooms in renter-occupied apartments in Hastings, Nebraska
- 292no bedroom
- 9351 bedroom
- 1,6662 bedrooms
- 8293 bedrooms
- 1404 bedrooms
- 365+ bedrooms
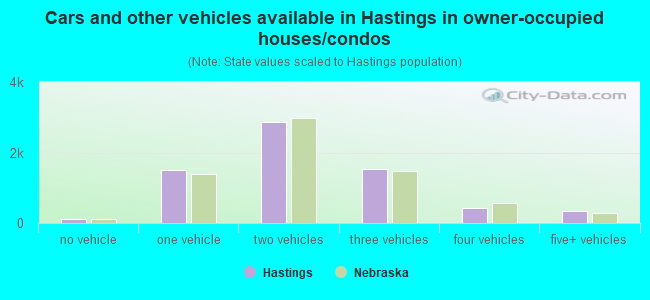
- Cars and other vehicles available in Hastings in owner-occupied houses/condos
- 120no vehicle
- 1,5051 vehicle
- 2,8622 vehicles
- 1,5383 vehicles
- 4364 vehicles
- 3475+ vehicles
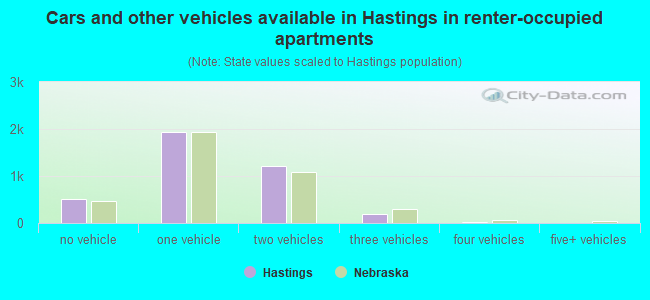
- Cars and other vehicles available in Hastings in renter-occupied apartments
- 507no vehicle
- 1,9441 vehicle
- 1,2212 vehicles
- 1893 vehicles
- 314 vehicles
- 55+ vehicles
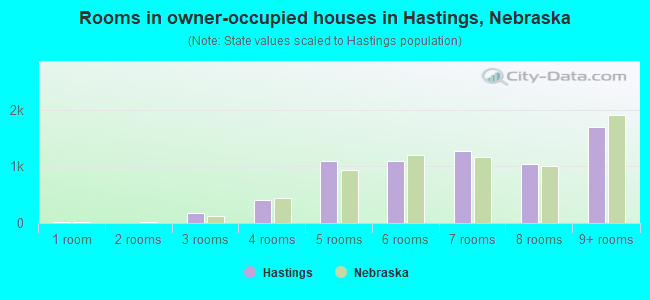
- Rooms in owner-occupied houses in Hastings, Nebraska
- 161 room
- 02 rooms
- 1813 rooms
- 4124 rooms
- 1,0915 rooms
- 1,0976 rooms
- 1,2777 rooms
- 1,0428 rooms
- 1,6939+ rooms
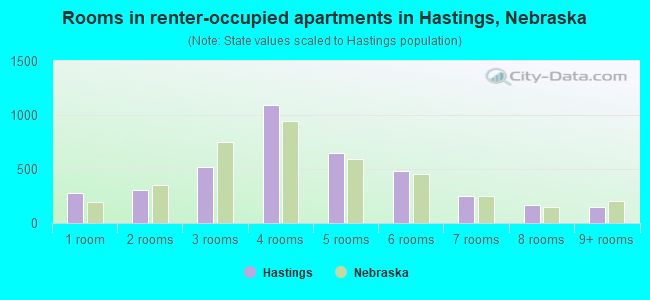
- Rooms in renter-occupied apartments in Hastings, Nebraska
- 2821 room
- 3032 rooms
- 5203 rooms
- 1,0914 rooms
- 6515 rooms
- 4826 rooms
- 2477 rooms
- 1708 rooms
- 1509+ rooms
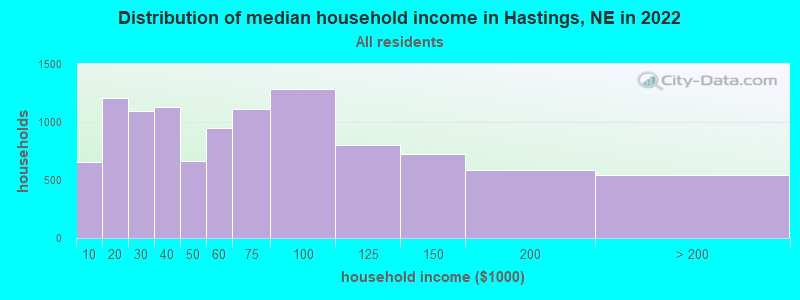
Hastings, NE household income distribution

- 651Less than $10,000
- 1,203$10,000 to $19,999
- 1,093$20,000 to $29,999
- 1,130$30,000 to $39,999
- 666$40,000 to $49,999
- 950$50,000 to $59,999
- 1,108$60,000 to $74,999
- 1,283$75,000 to $99,999
- 805$100,000 to $124,999
- 727$125,000 to $149,999
- 586$150,000 to $199,999
- 540$200,000 or more
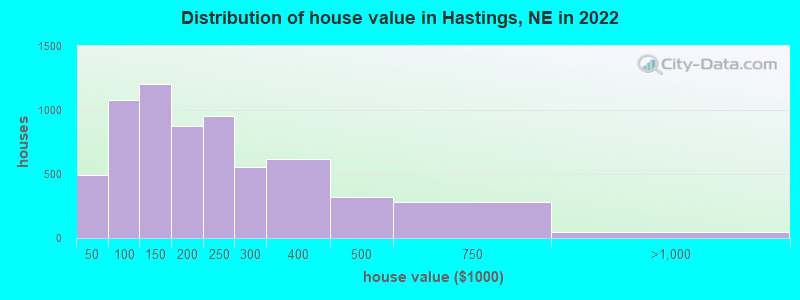
Home value of owner - occupied houses in 2022 in Hastings, NE
-
- 91Less than $10,000
- 61$10,000 to $14,999
- 70$15,000 to $19,999
- 36$20,000 to $24,999
- 130$25,000 to $29,999
- 7$30,000 to $34,999
- 10$35,000 to $39,999
- 81$40,000 to $49,999
- 75$50,000 to $59,999
- 169$60,000 to $69,999
- 240$70,000 to $79,999
- 236$80,000 to $89,999
- 273$90,000 to $99,999
- 651$100,000 to $124,999
- 549$125,000 to $149,999
- 444$150,000 to $174,999
- 432$175,000 to $199,999
- 953$200,000 to $249,999
- 553$250,000 to $299,999
- 615$300,000 to $399,999
- 319$400,000 to $499,999
- 284$500,000 to $749,999
- 34$750,000 to $999,999
- 12$1,000,000 to $1,499,999
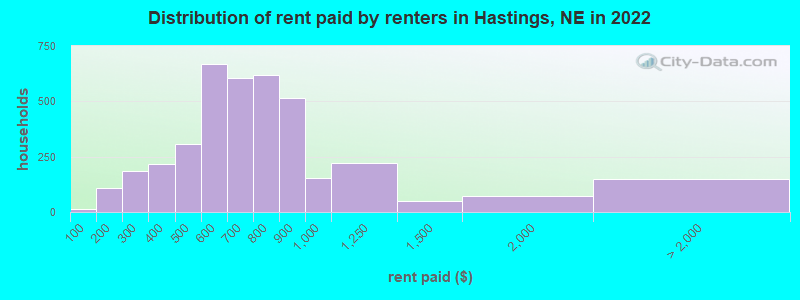
Rent paid by renters in 2022 in Hastings, NE
-
- 14Less than $100
- 32$100 to $149
- 77$150 to $199
- 88$200 to $249
- 96$250 to $299
- 114$300 to $349
- 102$350 to $399
- 201$400 to $449
- 107$450 to $499
- 289$500 to $549
- 378$550 to $599
- 240$600 to $649
- 367$650 to $699
- 347$700 to $749
- 270$750 to $799
- 516$800 to $899
- 153$900 to $999
- 223$1,000 to $1,249
- 49$1,250 to $1,499
- 72$1,500 to $1,999
- 37$2,000 to $2,499
- 9$3,500 or more
- 101No cash rent
Percentage of workers working in this county: 82.6%
Number of people working at home: 575 (4.6% of all workers)
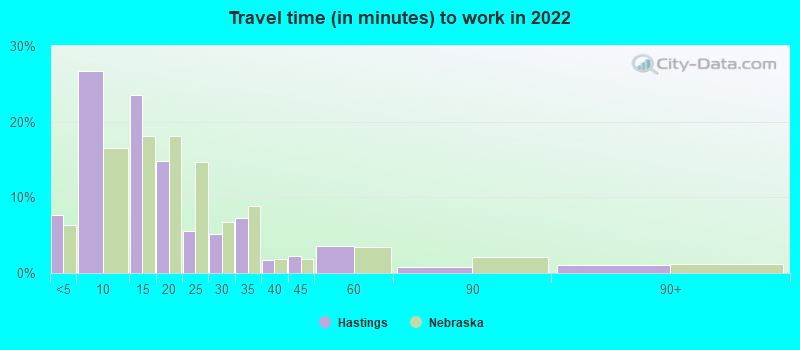
Travel time to work (commute)
- Less than 5 minutes: 1,052
- 5 to 9 minutes: 3,559
- 10 to 14 minutes: 2,843
- 15 to 19 minutes: 1,666
- 20 to 24 minutes: 396
- 25 to 29 minutes: 510
- 30 to 34 minutes: 872
- 35 to 39 minutes: 135
- 40 to 44 minutes: 90
- 45 to 59 minutes: 135
- 60 to 89 minutes: 218
- 90 or more minutes: 214
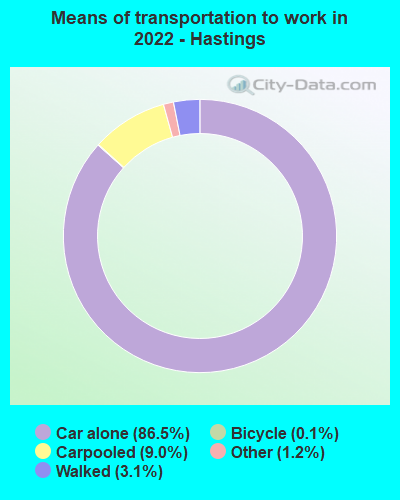
Means of transportation to work:
- Drove a car alone: 10,333 (81.4%)
- Carpooled: 1,125 (8.9%)
- Bus: 2 (0.0%)
- Taxi: 148 (1.2%)
- Bicycle: 16 (0.1%)
- Walked: 353 (2.8%)
- Worked at home: 575 (4.5%)
- Unemployment by race in 2022
- Unemployment rate for White non-Hispanic residents
- 2.8%Males
- 2.0%Females
- Unemployment rate for other race residents
- 1.4%Males
- 0.7%Females
- Unemployment rate for Hispanic or Latino residents
- 0.6%Males
- 0.4%Females
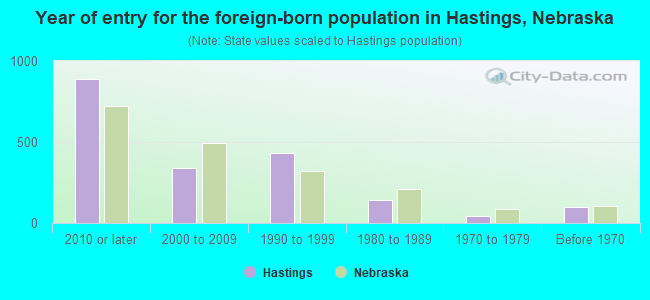
- Year of entry for the foreign-born population in Hastings, Nebraska
- 8882010 or later
- 3402000 to 2009
- 4351990 to 1999
- 1401980 to 1989
- 411970 to 1979
- 101Before 1970
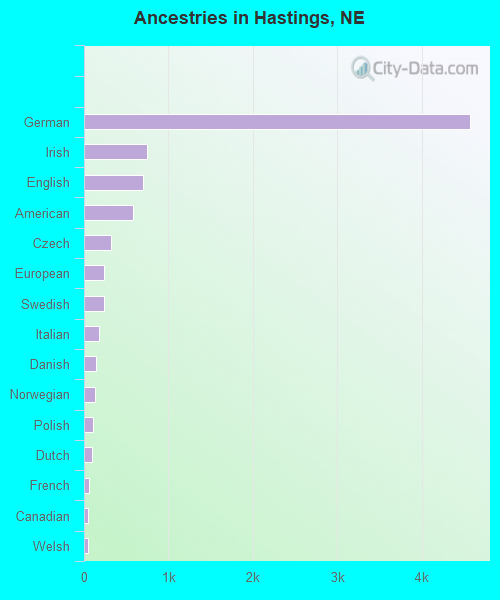
First ancestries reported:
- German: 4,571 (38.0%)
- Irish: 751 (6.2%)
- English: 695 (5.8%)
- American: 583 (4.8%)
- Czech: 318 (2.6%)
- European: 242 (2.0%)
- Swedish: 232 (1.9%)
- Italian: 172 (1.4%)
- Danish: 139 (1.2%)
- Norwegian: 127 (1.1%)
- Polish: 105 (0.9%)
- Dutch: 100 (0.8%)
- French: 59 (0.5%)
- Canadian: 45 (0.4%)
- Welsh: 45 (0.4%)
- Iranian: 34 (0.3%)
- Czechoslovakian: 25 (0.2%)
- Scotch-Irish: 25 (0.2%)
- Scottish: 25 (0.2%)
- French Canadian: 24 (0.2%)
- Portuguese: 22 (0.2%)
- Israeli: 20 (0.2%)
- Austrian: 18 (0.1%)
- Russian: 17 (0.1%)
- Scandinavian: 15 (0.1%)
- Northern European: 11 (0.09%)
- Armenian: 7 (0.06%)
- Jamaican: 7 (0.06%)
- Syrian: 5 (0.04%)
- Eastern European: 4 (0.03%)
- Romanian: 2 (0.02%)
Most common places of birth for foreign-born residents (%):
| Hastings: | 35.1% (664) |
| Nebraska: | 31.7% (46,610) |
| Hastings: | 18.9% (357) |
| Nebraska: | 2.4% (3,517) |
| Hastings: | 13.1% (248) |
| Nebraska: | 4.0% (5,832) |
| Hastings: | 10.1% (191) |
| Nebraska: | 1.9% (2,763) |
| Hastings: | 7.9% (150) |
| Nebraska: | 7.2% (10,604) |
| Hastings: | 3.4% (64) |
| Nebraska: | 2.2% (3,173) |
| Hastings: | 2.9% (54) |
| Nebraska: | 3.7% (5,421) |
Place of birth for U.S.-born residents:
- This state: 18,427
- Other state: 4,860
- Northeast: 331
- Midwest: 1,786
- South: 966
- West: 1,820
85.6% of Hastings residents lived in the same house 1 years ago.
Out of people who lived in different houses, 33.4% lived in this county.
Out of people who lived in different counties, 73.1% lived in Nebraska.
| Hastings: | 85.6% |
| State average: | 87.4% |
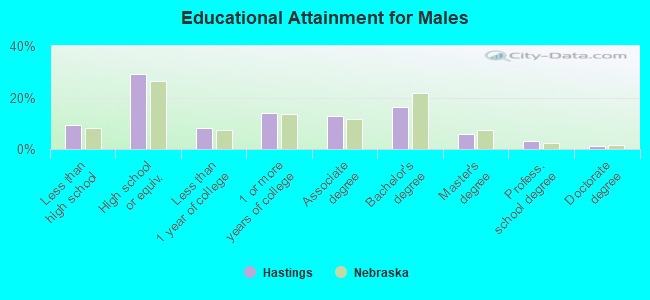
Education attainment for males 25 years and older:
- No schooling: 72
- Nursery to 4th grade: 25
- 5th and 6th grade: 138
- 7th and 8th grade: 52
- 9th grade: 99
- 10th grade: 112
- 11th grade: 127
- 12th grade, no diploma: 116
- High school graduate (or equivalency): 2,292
- Less than 1 year of college: 653
- Some college more than 1 year, no degree: 1,112
- Associate degree: 1,008
- Bachelor's degree: 1,281
- Master's degree: 468
- Professional school degree: 250
- Doctorate degree: 95
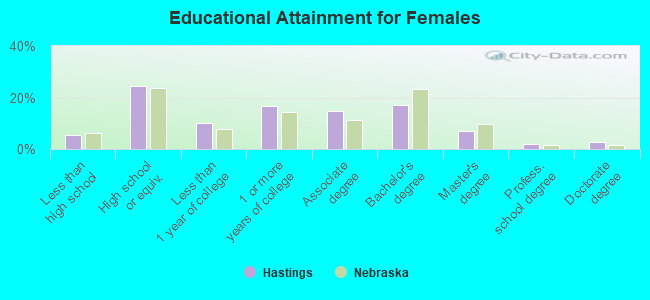
Education attainment for females 25 years and older:
- No schooling: 64
- Nursery to 4th grade: 45
- 5th and 6th grade: 33
- 7th and 8th grade: 36
- 9th grade: 34
- 10th grade: 131
- 11th grade: 19
- 12th grade, no diploma: 86
- High school graduate (or equivalency): 2,064
- Less than 1 year of college: 858
- Some college more than 1 year, no degree: 1,402
- Associate degree: 1,253
- Bachelor's degree: 1,444
- Master's degree: 583
- Professional school degree: 162
- Doctorate degree: 218
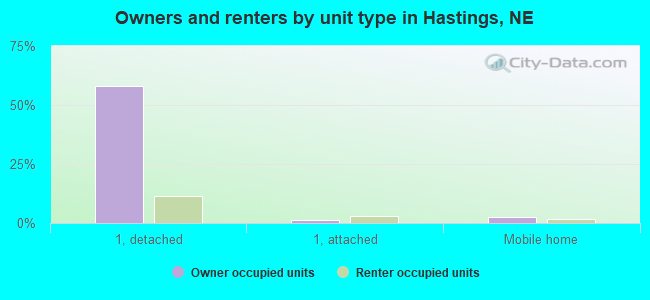
Housing units in structures:
- One, detached: 7,770
- One, attached: 428
- Two: 544
- 3 or 4: 953
- 5 to 9: 406
- 10 to 19: 114
- 20 to 49: 345
- 50 or more: 354
- Mobile homes: 542
Median worth of mobile homes: $21,101
Housing units lacking complete kitchen facilities in 2022: 2.7%
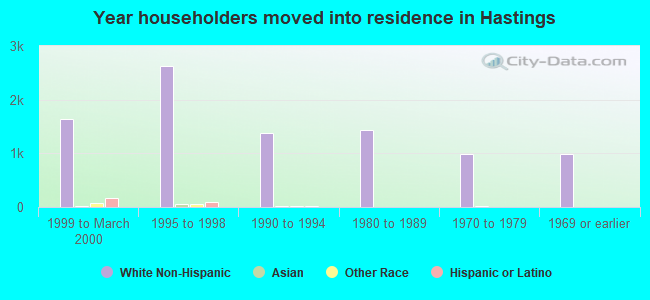
House/condo owner moved in on average 11 years ago
Renter moved in on average 4 years ago
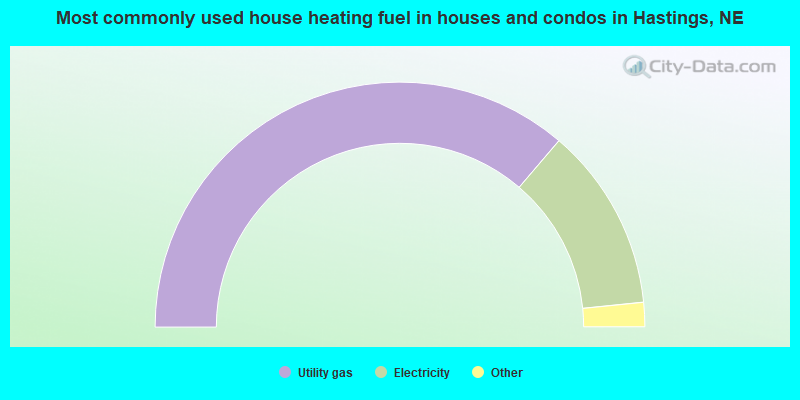
- 72.5%Utility gas
- 24.3%Electricity
- 1.8%Wood
- 0.8%Bottled, tank, or LP gas
- 0.5%No fuel used
- 0.1%Other fuel
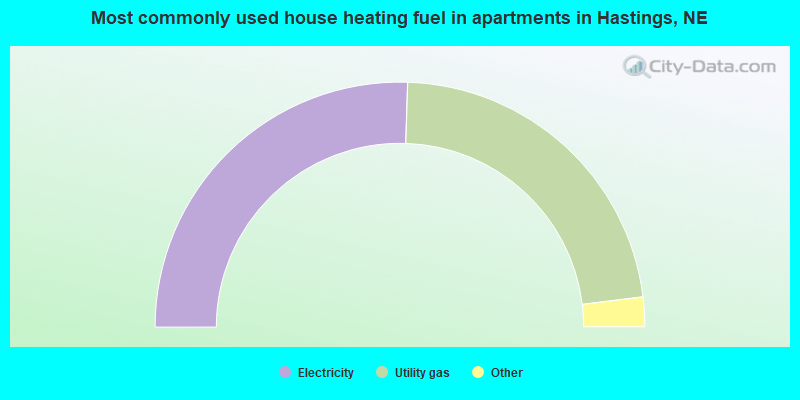
- 51.0%Electricity
- 45.1%Utility gas
- 2.7%Bottled, tank, or LP gas
- 1.0%No fuel used
- 0.2%Coal or coke
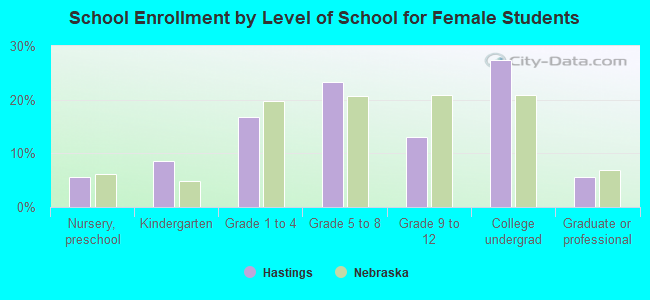
Private vs. public school enrollment:
| Here: | 14.0% |
| Nebraska: | 14.1% |
| Here: | 14.0% |
| Nebraska: | 12.5% |
| Here: | 58.8% |
| Nebraska: | 18.0% |