Races in Hastings, Nebraska (NE) Detailed Stats
Data:
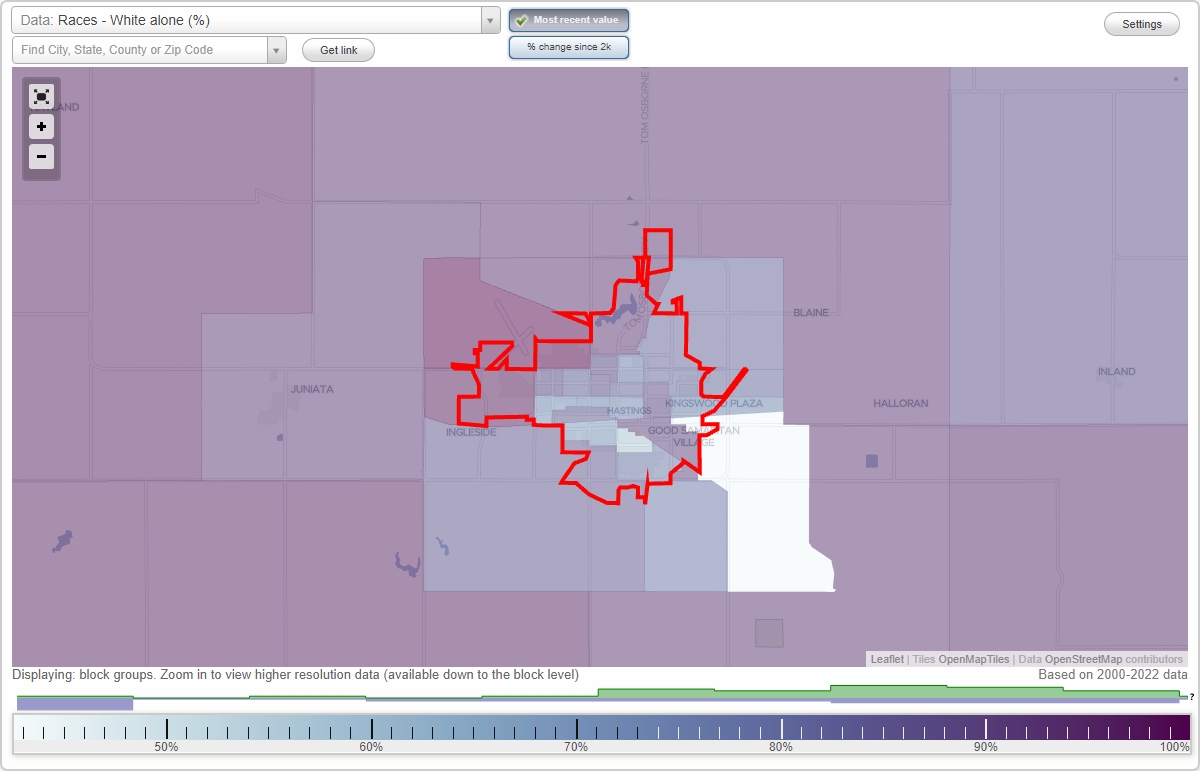
Races - White alone (%)
Races - White alone (% change since 2000)
Races - Black alone (%)
Races - Black alone (% change since 2000)
Races - American Indian alone (%)
Races - American Indian alone (% change since 2000)
Races - Asian alone (%)
Races - Asian alone (% change since 2000)
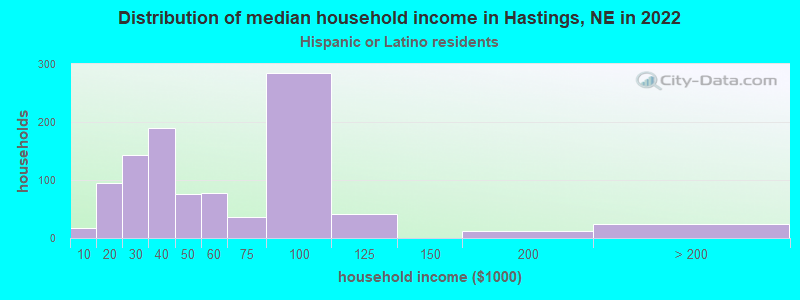
Races - Hispanic (%)
Races - Hispanic (% change since 2000)
Races - Native Hawaiian and Other Pacific Islander alone (%)
Races - Native Hawaiian and Other Pacific Islander alone (% change since 2000)
Races - Two or more races(%)
Races - Two or more races(% change since 2000)
Races - Other race alone (%)
Races - Other race alone (% change since 2000)
Racial diversity
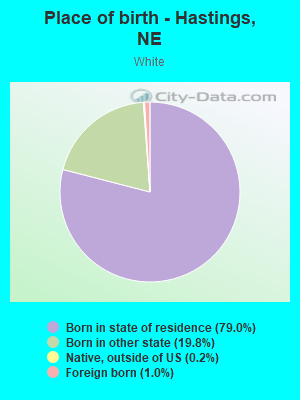
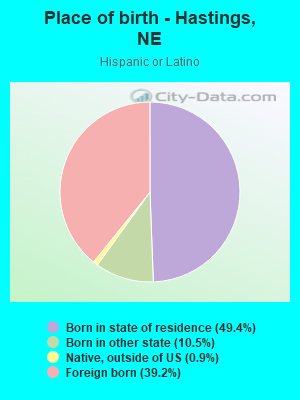
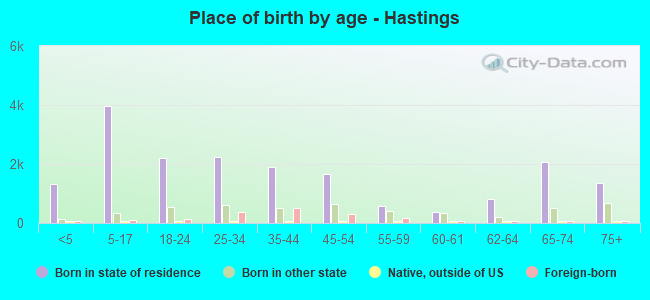
Place of birth - Born in state of residence (%)
Place of birth - Born in state of residence (%) - White
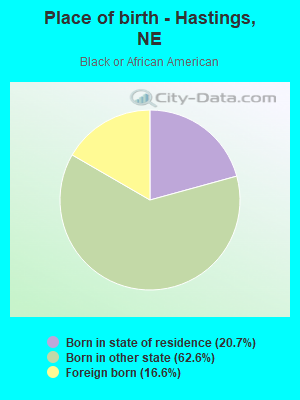
Place of birth - Born in state of residence (%) - Black or African American
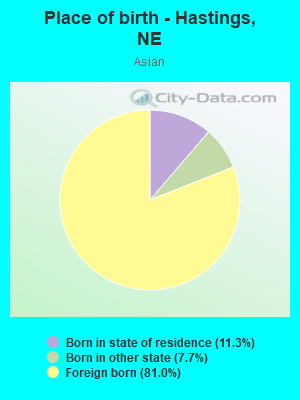
Place of birth - Born in state of residence (%) - Asian
Place of birth - Born in state of residence (%) - Hispanic or Latino
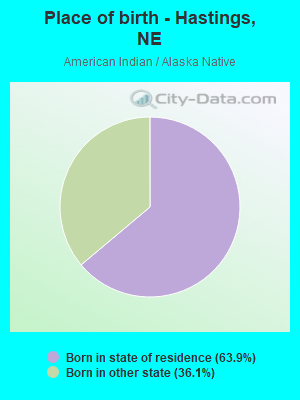
Place of birth - Born in state of residence (%) - American Indian and Alaska Native
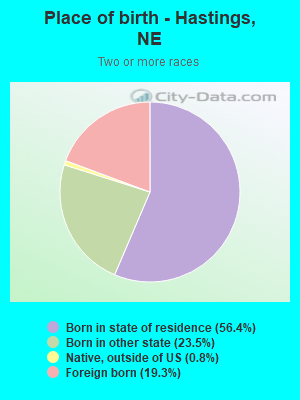
Place of birth - Born in state of residence (%) - Multirace
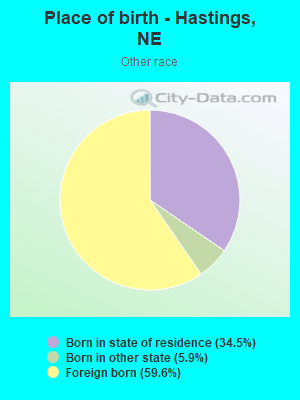
Place of birth - Born in state of residence (%) - Other Race
Place of birth - Born in other state (%)
Place of birth - Born in other state (%) - White
Place of birth - Born in other state (%) - Black or African American
Place of birth - Born in other state (%) - Asian
Place of birth - Born in other state (%) - Hispanic or Latino
Place of birth - Born in other state (%) - American Indian and Alaska Native
Place of birth - Born in other state (%) - Multirace
Place of birth - Born in other state (%) - Other Race
Place of birth - Native, outside of US (%)
Place of birth - Native, outside of US (%) - White
Place of birth - Native, outside of US (%) - Black or African American
Place of birth - Native, outside of US (%) - Asian
Place of birth - Native, outside of US (%) - Hispanic or Latino
Place of birth - Native, outside of US (%) - American Indian and Alaska Native
Place of birth - Native, outside of US (%) - Multirace
Place of birth - Native, outside of US (%) - Other Race
Place of birth - Foreign born (%)
Place of birth - Foreign born (%) - White
Place of birth - Foreign born (%) - Black or African American
Place of birth - Foreign born (%) - Asian
Place of birth - Foreign born (%) - Hispanic or Latino
Place of birth - Foreign born (%) - American Indian and Alaska Native
Place of birth - Foreign born (%) - Multirace
Place of birth - Foreign born (%) - Other Race
Residents speaking English at home (%)
Residents speaking English at home - Born in the United States (%)
Residents speaking English at home - Native, born elsewhere (%)
Residents speaking English at home - Foreign born (%)
Residents speaking Spanish at home (%)
Residents speaking Spanish at home - Born in the United States (%)
Residents speaking Spanish at home - Native, born elsewhere (%)
Residents speaking Spanish at home - Foreign born (%)
Residents speaking other language at home (%)
Residents speaking other language at home - Born in the United States (%)
Residents speaking other language at home - Native, born elsewhere (%)
Residents speaking other language at home - Foreign born (%)
Marital status - Never married (%)
Marital status - Now married (%)
Marital status - Separated (%)
Marital status - Widowed (%)
Marital status - Divorced (%)
Ancestries Reported - Arab (%)
Ancestries Reported - Czech (%)
Ancestries Reported - Danish (%)
Ancestries Reported - Dutch (%)
Ancestries Reported - English (%)
Ancestries Reported - French (%)
Ancestries Reported - French Canadian (%)
Ancestries Reported - German (%)
Ancestries Reported - Greek (%)
Ancestries Reported - Hungarian (%)
Ancestries Reported - Irish (%)
Ancestries Reported - Italian (%)
Ancestries Reported - Lithuanian (%)
Ancestries Reported - Norwegian (%)
Ancestries Reported - Polish (%)
Ancestries Reported - Portuguese (%)
Ancestries Reported - Russian (%)
Ancestries Reported - Scotch-Irish (%)
Ancestries Reported - Scottish (%)
Ancestries Reported - Slovak (%)
Ancestries Reported - Subsaharan African (%)
Ancestries Reported - Swedish (%)
Ancestries Reported - Swiss (%)
Ancestries Reported - Ukrainian (%)
Ancestries Reported - United States (%)
Ancestries Reported - Welsh (%)
Ancestries Reported - West Indian (%)
Ancestries Reported - Other (%)
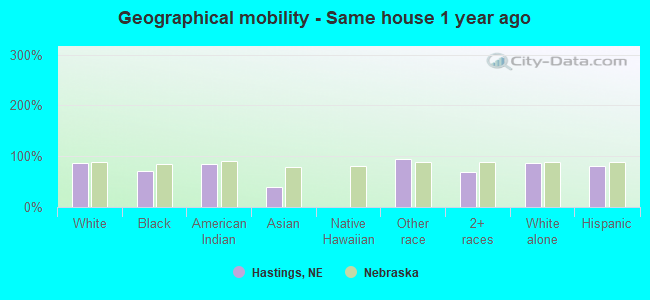
Geographical mobility - Same house 1 year ago (%)
Geographical mobility - Same house 1 year ago (%) - White
Geographical mobility - Same house 1 year ago (%) - Black or African American
Geographical mobility - Same house 1 year ago (%) - Asian
Geographical mobility - Same house 1 year ago (%) - Hispanic or Latino
Geographical mobility - Same house 1 year ago (%) - American Indian and Alaska Native
Geographical mobility - Same house 1 year ago (%) - Multirace
Geographical mobility - Same house 1 year ago (%) - Other Race
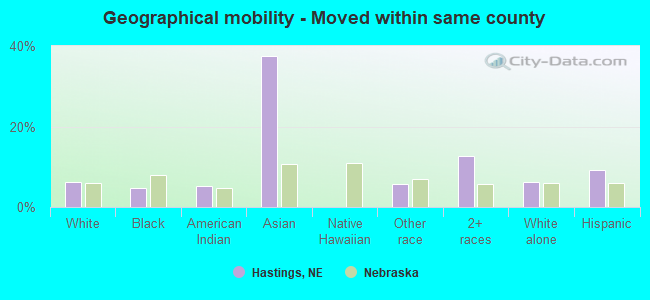
Geographical mobility - Moved within same county (%)
Geographical mobility - Moved within same county (%) - White
Geographical mobility - Moved within same county (%) - Black or African American
Geographical mobility - Moved within same county (%) - Asian
Geographical mobility - Moved within same county (%) - Hispanic or Latino
Geographical mobility - Moved within same county (%) - American Indian and Alaska Native
Geographical mobility - Moved within same county (%) - Multirace
Geographical mobility - Moved within same county (%) - Other Race
Geographical mobility - Moved from different county within same state (%)
Geographical mobility - Moved from different county within same state (%) - White
Geographical mobility - Moved from different county within same state (%) - Black or African American
Geographical mobility - Moved from different county within same state (%) - Asian
Geographical mobility - Moved from different county within same state (%) - Hispanic or Latino
Geographical mobility - Moved from different county within same state (%) - American Indian and Alaska Native
Geographical mobility - Moved from different county within same state (%) - Multirace
Geographical mobility - Moved from different county within same state (%) - Other Race
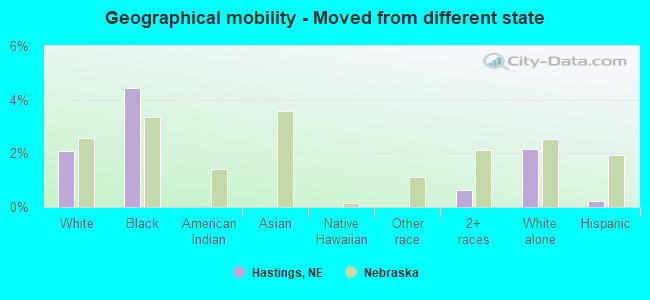
Geographical mobility - Moved from different state (%)
Geographical mobility - Moved from different state (%) - White
Geographical mobility - Moved from different state (%) - Black or African American
Geographical mobility - Moved from different state (%) - Asian
Geographical mobility - Moved from different state (%) - Hispanic or Latino
Geographical mobility - Moved from different state (%) - American Indian and Alaska Native
Geographical mobility - Moved from different state (%) - Multirace
Geographical mobility - Moved from different state (%) - Other Race
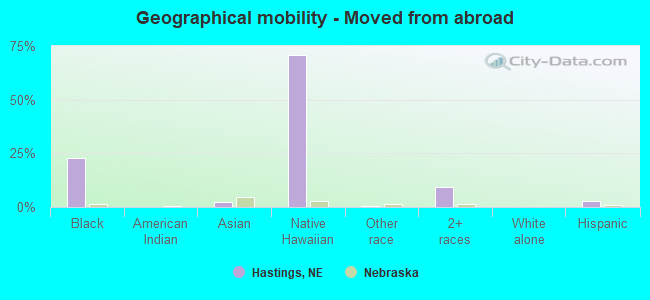
Geographical mobility - Moved from abroad (%)
Geographical mobility - Moved from abroad (%) - White
Geographical mobility - Moved from abroad (%) - Black or African American
Geographical mobility - Moved from abroad (%) - Asian
Geographical mobility - Moved from abroad (%) - Hispanic or Latino
Geographical mobility - Moved from abroad (%) - American Indian and Alaska Native
Geographical mobility - Moved from abroad (%) - Multirace
Geographical mobility - Moved from abroad (%) - Other Race
Place of birth for the foreign-born population - Ireland (%)
Place of birth for the foreign-born population - Denmark (%)
Place of birth for the foreign-born population - Norway (%)
Place of birth for the foreign-born population - Sweden (%)
Place of birth for the foreign-born population - United Kingdom (%)
Place of birth for the foreign-born population - England (%)
Place of birth for the foreign-born population - Scotland (%)
Place of birth for the foreign-born population - Other Northern Europe (%)
Place of birth for the foreign-born population - Austria (%)
Place of birth for the foreign-born population - Belgium (%)
Place of birth for the foreign-born population - France (%)
Place of birth for the foreign-born population - Germany (%)
Place of birth for the foreign-born population - Netherlands (%)
Place of birth for the foreign-born population - Switzerland (%)
Place of birth for the foreign-born population - Other Western Europe (%)
Place of birth for the foreign-born population - Greece (%)
Place of birth for the foreign-born population - Italy (%)
Place of birth for the foreign-born population - Portugal (%)
Place of birth for the foreign-born population - Spain (%)
Place of birth for the foreign-born population - Other Southern Europe (%)
Place of birth for the foreign-born population - Albania (%)
Place of birth for the foreign-born population - Belarus (%)
Place of birth for the foreign-born population - Bosnia and Herzegovina (%)
Place of birth for the foreign-born population - Bulgaria (%)
Place of birth for the foreign-born population - Croatia (%)
Place of birth for the foreign-born population - Czechoslovakia (%)
Place of birth for the foreign-born population - Hungary (%)
Place of birth for the foreign-born population - Latvia (%)
Place of birth for the foreign-born population - Lithuania (%)
Place of birth for the foreign-born population - North Macedonia (Macedonia) (%)
Place of birth for the foreign-born population - Moldova (%)
Place of birth for the foreign-born population - Poland (%)
Place of birth for the foreign-born population - Romania (%)
Place of birth for the foreign-born population - Russia (%)
Place of birth for the foreign-born population - Serbia (%)
Place of birth for the foreign-born population - Ukraine (%)
Place of birth for the foreign-born population - Other Eastern Europe (%)
Place of birth for the foreign-born population - China (%)
Place of birth for the foreign-born population - Hong Kong (%)
Place of birth for the foreign-born population - Taiwan (%)
Place of birth for the foreign-born population - Japan (%)
Place of birth for the foreign-born population - Korea (%)
Place of birth for the foreign-born population - Other Eastern Asia (%)
Place of birth for the foreign-born population - Afghanistan (%)
Place of birth for the foreign-born population - Bangladesh (%)
Place of birth for the foreign-born population - India (%)
Place of birth for the foreign-born population - Iran (%)
Place of birth for the foreign-born population - Kazakhstan (%)
Place of birth for the foreign-born population - Nepal (%)
Place of birth for the foreign-born population - Pakistan (%)
Place of birth for the foreign-born population - Sri Lanka (%)
Place of birth for the foreign-born population - Uzbekistan (%)
Place of birth for the foreign-born population - Other South Central Asia (%)
Place of birth for the foreign-born population - Burma (%)
Place of birth for the foreign-born population - Cambodia (%)
Place of birth for the foreign-born population - Indonesia (%)
Place of birth for the foreign-born population - Laos (%)
Place of birth for the foreign-born population - Malaysia (%)
Place of birth for the foreign-born population - Philippines (%)
Place of birth for the foreign-born population - Singapore (%)
Place of birth for the foreign-born population - Thailand (%)
Place of birth for the foreign-born population - Vietnam (%)
Place of birth for the foreign-born population - Other South Eastern Asia (%)
Place of birth for the foreign-born population - Armenia (%)
Place of birth for the foreign-born population - Iraq (%)
Place of birth for the foreign-born population - Israel (%)
Place of birth for the foreign-born population - Jordan (%)
Place of birth for the foreign-born population - Kuwait (%)
Place of birth for the foreign-born population - Lebanon (%)
Place of birth for the foreign-born population - Saudi Arabia (%)
Place of birth for the foreign-born population - Syria (%)
Place of birth for the foreign-born population - Turkey (%)
Place of birth for the foreign-born population - Yemen (%)
Place of birth for the foreign-born population - Other Western Asia (%)
Place of birth for the foreign-born population - Eritrea (%)
Place of birth for the foreign-born population - Ethiopia (%)
Place of birth for the foreign-born population - Kenya (%)
Place of birth for the foreign-born population - Somalia (%)
Place of birth for the foreign-born population - Uganda (%)
Place of birth for the foreign-born population - Zimbabwe (%)
Place of birth for the foreign-born population - Other Eastern Africa (%)
Place of birth for the foreign-born population - Cameroon (%)
Place of birth for the foreign-born population - Congo (%)
Place of birth for the foreign-born population - Democratic Republic of Congo (Zaire) (%)
Place of birth for the foreign-born population - Other Middle Africa (%)
Place of birth for the foreign-born population - Egypt (%)
Place of birth for the foreign-born population - Morocco (%)
Place of birth for the foreign-born population - Sudan (%)
Place of birth for the foreign-born population - Other Northern Africa (%)
Place of birth for the foreign-born population - South Africa (%)
Place of birth for the foreign-born population - Other Southern Africa (%)
Place of birth for the foreign-born population - Cabo Verde (%)
Place of birth for the foreign-born population - Ghana (%)
Place of birth for the foreign-born population - Liberia (%)
Place of birth for the foreign-born population - Nigeria (%)
Place of birth for the foreign-born population - Senegal (%)
Place of birth for the foreign-born population - Sierra Leone (%)
Place of birth for the foreign-born population - Other Western Africa (%)
Place of birth for the foreign-born population - Australia (%)
Place of birth for the foreign-born population - New Zealand (%)
Place of birth for the foreign-born population - Fiji (%)
Place of birth for the foreign-born population - Micronesia (%)
Place of birth for the foreign-born population - Bahamas (%)
Place of birth for the foreign-born population - Barbados (%)
Place of birth for the foreign-born population - Cuba (%)
Place of birth for the foreign-born population - Dominica (%)
Place of birth for the foreign-born population - Dominican Republic (%)
Place of birth for the foreign-born population - Grenada (%)
Place of birth for the foreign-born population - Haiti (%)
Place of birth for the foreign-born population - Jamaica (%)
Place of birth for the foreign-born population - St. Vincent and the Grenadines (%)
Place of birth for the foreign-born population - Trinidad and Tobago (%)
Place of birth for the foreign-born population - West Indies (%)
Place of birth for the foreign-born population - Other Caribbean (%)
Place of birth for the foreign-born population - Belize (%)
Place of birth for the foreign-born population - Costa Rica (%)
Place of birth for the foreign-born population - El Salvador (%)
Place of birth for the foreign-born population - Guatemala (%)
Place of birth for the foreign-born population - Honduras (%)
Place of birth for the foreign-born population - Mexico (%)
Place of birth for the foreign-born population - Nicaragua (%)
Place of birth for the foreign-born population - Panama (%)
Place of birth for the foreign-born population - Other Central America (%)
Place of birth for the foreign-born population - Argentina (%)
Place of birth for the foreign-born population - Bolivia (%)
Place of birth for the foreign-born population - Brazil (%)
Place of birth for the foreign-born population - Chile (%)
Place of birth for the foreign-born population - Colombia (%)
Place of birth for the foreign-born population - Ecuador (%)
Place of birth for the foreign-born population - Guyana (%)
Place of birth for the foreign-born population - Peru (%)
Place of birth for the foreign-born population - Uruguay (%)
Place of birth for the foreign-born population - Venezuela (%)
Place of birth for the foreign-born population - Other South America (%)
Place of birth for the foreign-born population - Canada (%)
Place of birth for the foreign-born population - Other Northern America (%)
Place of birth for the foreign-born population - Other (%)
Latest news about races in Hastings, NE collected exclusively by city-data.com from local newspapers, TV, and radio stations
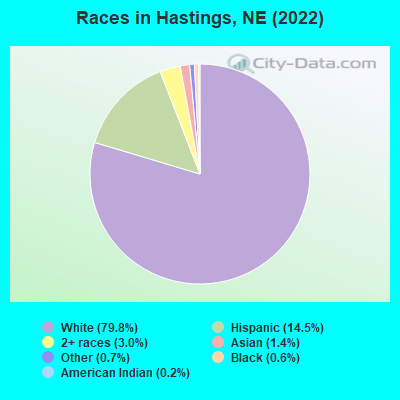
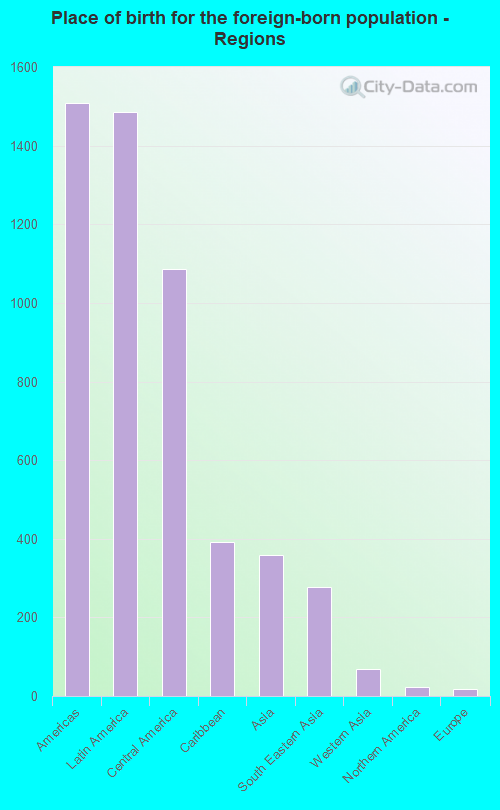
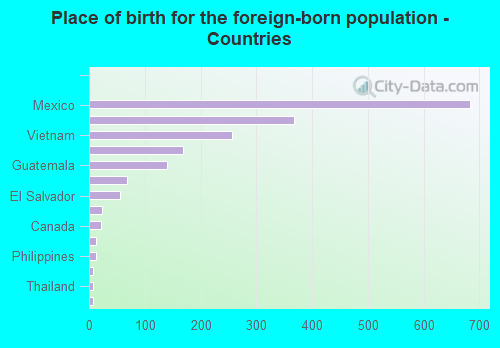
According to 2022 data, the most numerous races in Hastings, NE are White alone (20,109 residents), Hispanic (3,662 residents), and Black alone (139 residents). 89.1% of Hastings residents speak English at home. 7.5% of Hastings, NE residents are foreign-born (5.8% born in Latin America, 1.4% born in Asia), which is 6.8% greater than the foreign-born rate of 7.0% across the entire state of Nebraska.
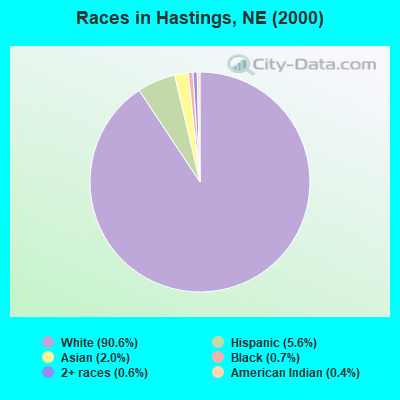
Race distribution in Hastings
2000 2022
1,494,494 87.3% White alone 94,425 5.5% Hispanic 67,537 3.9% Black alone 21,677 1.3% Asian alone 17,696 1.0% Two or more races 13,460 0.8% American Indian alone 1,327 0.08% Other race alone 647 0.04% Native Hawaiian and Other
1,492,005 75.8% White alone 241,898 12.3% Hispanic 89,520 4.5% Black alone 76,499 3.9% Two or more races 49,261 2.5% Asian alone 10,249 0.5% American Indian alone 7,425 0.4% Other race alone 1,066 0.05% Native Hawaiian and Other
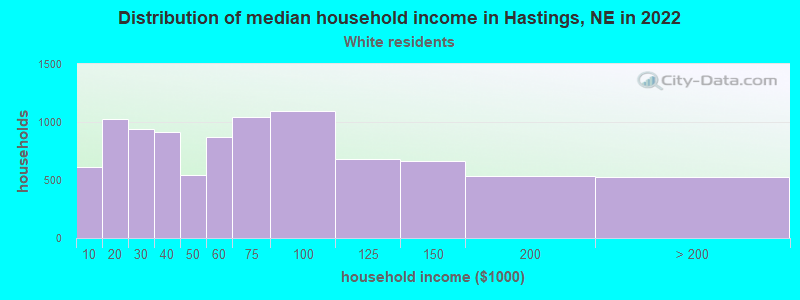
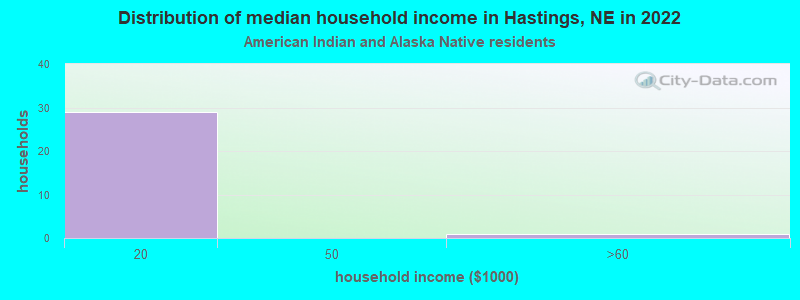
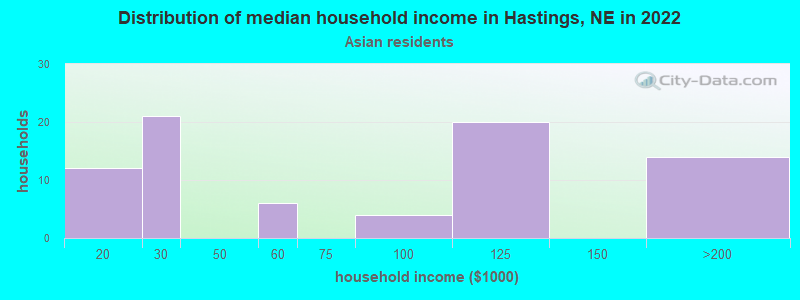
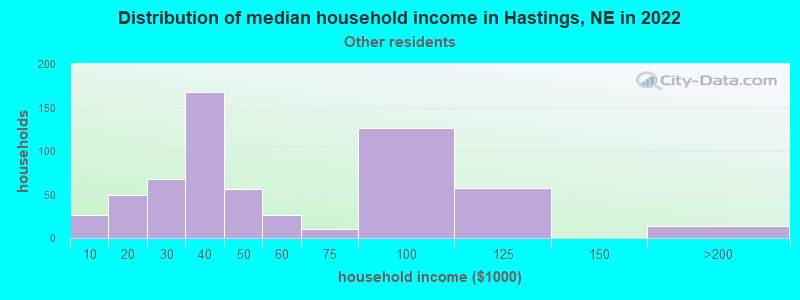
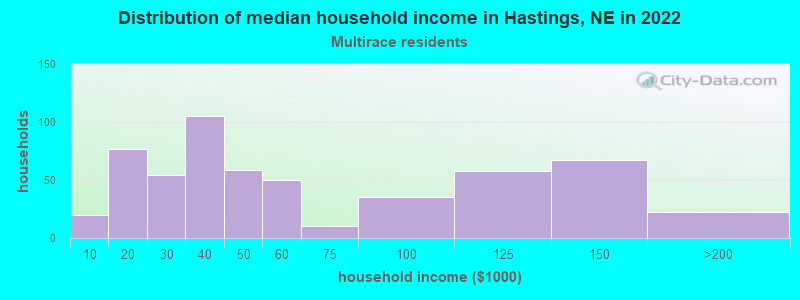
Income and house value in Hastings Median household income in 2022 $56,947 White non-Hispanic householders$11,207 American Indian and Alaska Native householders$39,994 Some other race householders$43,459 Two or more races householders$43,378 Hispanic or Latino race householdersMedian 2022 house value $183,887 White Non-Hispanic householders$550,928 Black or African American householders $174,093 Asian householders$144,220 Some other race householders$210,087 Two or more races householders$137,854 Hispanic or Latino householders
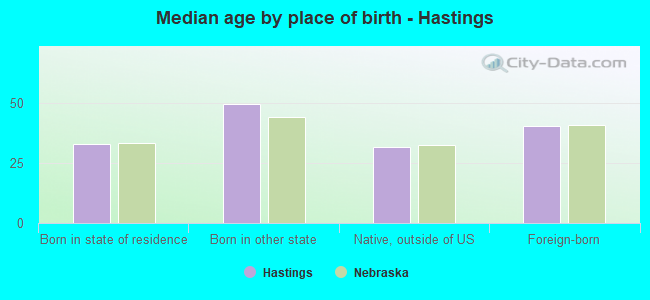
Median age by race in Hastings
39.6 Median age for White residents38.9 40.3 17.4 Median age for Black or African American residents17.6 17.5 70.3 Median age for American Indian / Alaska Native residents60.9 75.2 40.1 Median age for Asian residents49.5 26.2 -699,999,999.3 Median age for Native Hawaiian / Pacific Islander residents-672,108,842.9 -689,223,057.0 28.5 Median age for Other race residents27.4 31.0 20.0 Median age for Two or more races residents21.1 15.3 40.2 Median age for White alone residents39.2 41.6 23.2 Median age for Hispanic or Latino residents27.2 21.0
Owner/renter occupied households by race in Hastings
House owners and renters - White residents 6,009 63.9% Owner occupied3,395 36.1% Renter occupiedHouse owners and renters - American Indian / Alaska Native residents 48 100.0% Renter occupiedHouse owners and renters - Asian residents 112 98.2% Owner occupied2 1.8% Renter occupiedHouse owners and renters - Other race residents 325 56.2% Owner occupied253 43.8% Renter occupiedHouse owners and renters - Two or more races residents 292 49.7% Owner occupied296 50.3% Renter occupiedHouse owners and renters - White alone residents 5,946 64.4% Owner occupied3,288 35.6% Renter occupiedHouse owners and renters - Hispanic or Latino residents 453 44.8% Owner occupied559 55.2% Renter occupied
Language usage in Hastings
English speakers - Total 89.1% of residents of Hastings speak English at home.
8.8% of residents speak Spanish at home 1,022 48.8% Speak English very well1,071 51.2% Speak English less than very well1.9% of residents speak other language at home 190 42.8% Speak English very well254 57.2% Speak English less than very well
English speakers - Born in the United States 96.8% of residents of Hastings speak English at home.
2.9% of residents speak Spanish at home 124 89.2% Speak English very well15 10.8% Speak English less than very well0.3% of residents speak other language at home 13 100.0% Speak English less than very well
English speakers - Native, born elsewhere 78.4% of residents of Hastings speak English at home.
23.0% of residents speak Spanish at home 17 100.0% Speak English very well
English speakers - Foreign-born 5.6% of residents of Hastings speak English at home.
75.5% of residents speak Spanish at home 314 23.4% Speak English very well1,028 76.6% Speak English less than very well19.1% of residents speak other language at home 106 31.2% Speak English very well234 68.8% Speak English less than very well
White (Caucasian) - Speak only English Native:
98.6% (19,176)Foreign-born:
27.5% (55)
White (Caucasian) - Speak another language Native:
1.6% (313)Foreign-born:
73.4% (148)
Black or African American - Speak only English Native:
98.7% (54)Foreign-born:
100.0% (23)
Asian - Speak only English Native:
21.0% (15)Foreign-born:
3.2% (9)
Asian - Speak another language Native:
73.6% (52)Foreign-born:
98.0% (270)
Other race - Speak only English Native:
48.3% (302)Foreign-born:
1.0% (11)
Other race - Speak another language Native:
51.6% (323)Foreign-born:
100.0% (1,039)
Two or more races - Speak another language Native:
11.5% (194)Foreign-born:
100.0% (467)
White alone - Speak only English Native:
99.3% (18,901)Foreign-born:
20.3% (24)
White alone - Speak another language Native:
0.6% (120)Foreign-born:
82.4% (97)
Hispanic or Latino - Speak only English Native:
61.5% (1,114)Foreign-born:
3.1% (42)
Hispanic or Latino - Speak another language Native:
38.8% (704)Foreign-born:
97.3% (1,351)
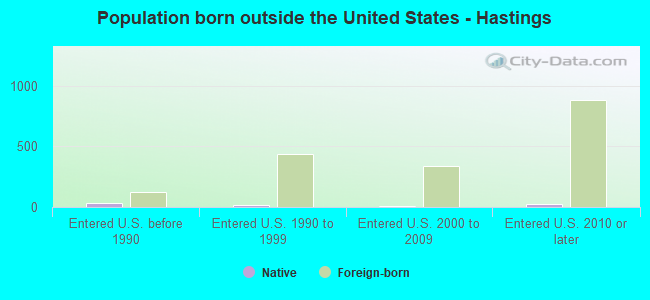
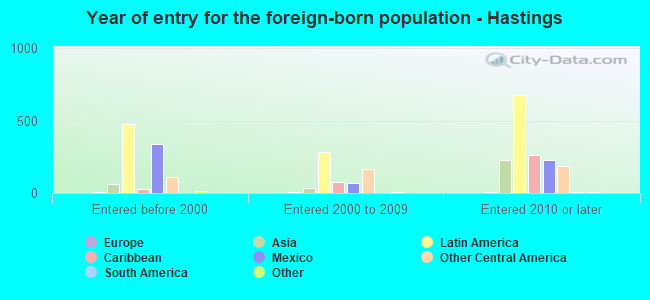
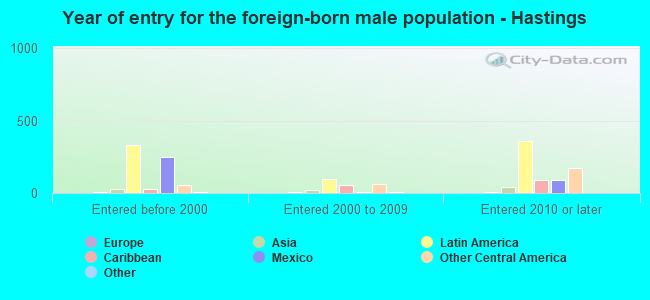
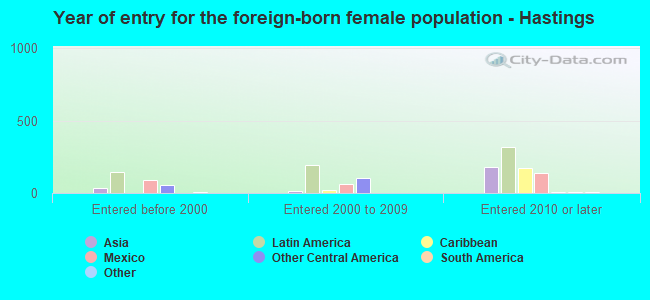
Foreign-born residents in Hastings 1,893 residents are foreign born (5.8% Latin America , 1.4% Asia ).
This city:
7.5%Nebraska:
7.5%
Marital status for residents in Hastings Marital status - White (Caucasian) population 15 years and over
Males 34.5% Never married49.2% Now married1.1% Separated3.3% Widowed11.9% DivorcedFemales 29.3% Never married44.6% Now married1.1% Separated12.1% Widowed12.8% DivorcedWomen who gave birth in the past 12 months Now married:
73.9% (186)Unmarried:
26.1% (66)
Women who did not give birth in the past 12 months Now married:
39.7% (1,722)Unmarried:
60.3% (2,616)
Marital status - Black or African American population 15 years and over
Males 98.5% Never married0.0% Now married0.0% Separated0.0% Widowed1.5% DivorcedFemales 100.0% Never married0.0% Now married0.0% Separated0.0% Widowed0.0% DivorcedWomen who did not give birth in the past 12 months Now married:
0.0% (0)Unmarried:
100.0% (9)
Marital status - American Indian / Alaska Native population 15 years and over
Males 5.9% Never married0.0% Now married0.0% Separated0.0% Widowed94.1% DivorcedFemales 28.6% Never married0.0% Now married55.1% Separated16.3% Widowed0.0% DivorcedWomen who gave birth in the past 12 months Now married:
0.0% (0)Unmarried:
100.0% (9)
Women who did not give birth in the past 12 months Now married:
0.0% (0)Unmarried:
100.0% (7)
Marital status - Asian population 15 years and over
Males 23.5% Never married32.7% Now married0.0% Separated0.0% Widowed43.9% DivorcedFemales 53.7% Never married36.6% Now married0.0% Separated9.7% Widowed0.0% DivorcedWomen who gave birth in the past 12 months Now married:
100.0% (26)Unmarried:
0.0% (0)
Women who did not give birth in the past 12 months Now married:
32.4% (48)Unmarried:
67.6% (99)
Marital status - Other race population 15 years and over
Males 46.3% Never married42.7% Now married1.9% Separated1.2% Widowed8.0% DivorcedFemales 43.4% Never married52.7% Now married0.0% Separated3.5% Widowed0.5% DivorcedWomen who gave birth in the past 12 months Now married:
100.0% (8)Unmarried:
0.0% (0)
Women who did not give birth in the past 12 months Now married:
42.9% (173)Unmarried:
57.1% (229)
Marital status - Two or more races population 15 years and over
Males 31.5% Never married60.2% Now married0.0% Separated6.4% Widowed1.9% DivorcedFemales 47.9% Never married51.1% Now married0.0% Separated0.0% Widowed1.0% DivorcedWomen who did not give birth in the past 12 months Now married:
35.1% (185)Unmarried:
64.9% (343)
Marital status - White alone, not Hispanic / Latino population 15 years and over
Males 34.1% Never married49.1% Now married1.2% Separated3.4% Widowed12.2% DivorcedFemales 29.0% Never married44.4% Now married1.1% Separated12.4% Widowed13.1% DivorcedWomen who gave birth in the past 12 months Now married:
64.4% (122)Unmarried:
35.6% (67)
Women who did not give birth in the past 12 months Now married:
39.7% (1,691)Unmarried:
60.3% (2,567)
Marital status - Hispanic or Latino population 15 years and over
Males 41.0% Never married51.8% Now married0.9% Separated0.6% Widowed5.7% DivorcedFemales 43.3% Never married52.7% Now married0.0% Separated1.8% Widowed2.2% DivorcedWomen who gave birth in the past 12 months Now married:
90.6% (81)Unmarried:
9.4% (8)
Women who did not give birth in the past 12 months Now married:
40.0% (302)Unmarried:
60.0% (452)
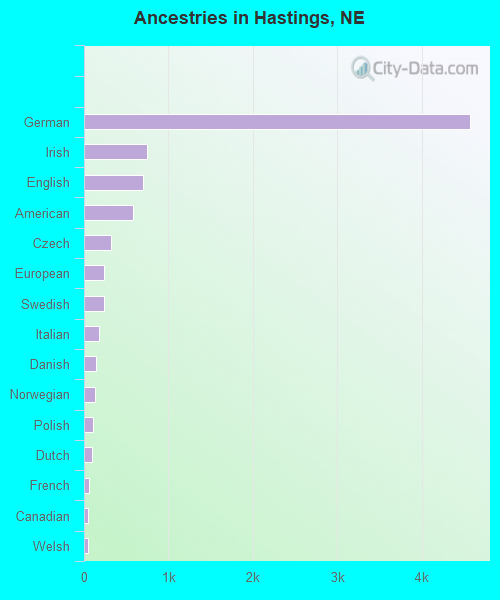
Ancestries in Hastings
4,571 38.0% German751 6.2% Irish695 5.8% English583 4.8% American318 2.6% Czech242 2.0% European232 1.9% Swedish172 1.4% Italian139 1.2% Danish127 1.1% Norwegian105 0.9% Polish100 0.8% Dutch59 0.5% French45 0.4% Canadian45 0.4% Welsh34 0.3% Iranian25 0.2% Czechoslovakian25 0.2% Scotch-Irish25 0.2% Scottish24 0.2% French Canadian22 0.2% Portuguese20 0.2% Israeli18 0.1% Austrian17 0.1% Russian15 0.1% Scandinavian11 0.09% Northern European7 0.06% Armenian7 0.06% Jamaican5 0.04% Syrian4 0.03% Eastern European2 0.02% Romanian
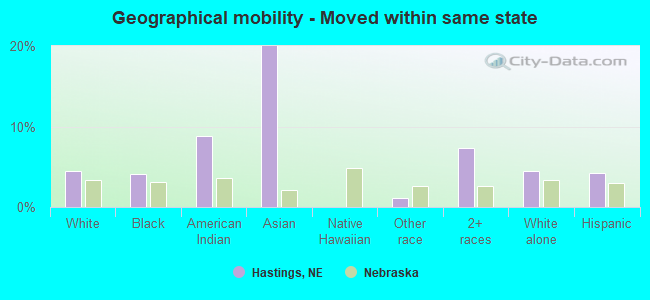
Geographical mobility in Hastings Same house 1 year ago 17,700 87.0% White (Caucasian)100 71.2% Black or African American59 84.3% American Indian / Alaska Native140 39.9% Asian1,697 94.4% Other race1,532 68.4% Two or more races17,327 87.1% White alone, not Hispanic / Latino2,840 81.7% Hispanic or LatinoMoved within same county 1,253 6.2% White / Caucasian6 4.6% Black or African American4 5.1% American Indian / Alaska Native131 37.6% Asian102 5.7% Other race281 12.6% Two or more races1,211 6.1% White alone, not Hispanic / Latino323 9.3% Hispanic or LatinoMoved within same state 920 4.5% White / Caucasian6 4.1% Black or African American6 8.8% American Indian / Alaska Native70 20.0% Asian19 1.1% Other race164 7.3% Two or more races880 4.4% White alone, not Hispanic / Latino145 4.2% Hispanic or LatinoMoved from different state 425 2.1% White / Caucasian6 4.4% Black or African American14 0.6% Two or more races426 2.1% White alone, not Hispanic / Latino8 0.2% Hispanic or LatinoMoved from abroad 18 0.1% White32 23.0% Black or African American9 2.5% Asian2 70.6% Native Hawaiian / Pacific Islander12 0.6% Other race204 9.1% Two or more races22 0.1% White alone, not Hispanic / Latino101 2.9% Hispanic or Latino
Children Nativity (place of birth) in Hastings
Children under 6 years - Living with two parents Both parents native 894 100.0% NativeBoth parents foreign-born 21 100.0% Foreign-bornOne native, one foreign-born parent 170 100.0% NativeChildren under 6 years - Living with one parent Native parent 340 100.0% NativeForeign-born parent 178 100.0% NativeChildren 6 to 17 years - Living with two parents Both parents native 2,029 100.0% Native0 0.0% Foreign-bornBoth parents foreign-born 374 87.1% Native55 12.9% Foreign-bornOne native, one foreign-born parent 30 100.0% NativeChildren 6 to 17 years - Living with one parent Native parent 1,062 100.0% NativeForeign-born parent 238 53.8% Native204 46.2% Foreign-born
Grandparents responsible for own grandchildren in Hastings
Grandparents (30 to 59 years) White / Caucasian 142 79.4% Responsible for grandchildren37 20.6% Not responsible for grandchildrenWhite alone, not Hispanic / Latino 142 86.8% Responsible for grandchildren22 13.2% Not responsible for grandchildrenGrandparents (60 years and over) White / Caucasian 19 18.5% Responsible for grandchildren82 81.5% Not responsible for grandchildrenWhite alone, not Hispanic / Latino 19 17.9% Responsible for grandchildren86 82.1% Not responsible for grandchildren