Harrisville, RI (Rhode Island) Houses and Residents
| Harrisville: | $394,279 |
| Rhode Island: | $383,900 |
Total population: 1,605 (Urban population: 1,523, Rural population: 0)
Houses: 838 (790 occupied: 476 owner occupied, 340 renter occupied)
| % of renters here: | 42% |
| State: | 37% |
Housing density: 1,033 houses/condos per square mile
Median price asked for vacant for-sale houses and condos in 2022 in this county: $275,451.
Median contract rent in 2022: $803
Median rent asked for vacant for-rent units in 2022: $688
Median gross rent in Harrisville, RI in 2022: $796
Housing units in Harrisville with a mortgage: 336 (108 second mortgage, 0 home equity loan, 51 both second mortgage and home equity loan)
Houses without a mortgage: 0
Median household income for houses/condos with a mortgage: $96,515
Median household income for apartments without a mortgage: $51,962
Median monthly housing costs: $1,159
Compare current foreclosures near Harrisville, RI:
| Photo | Address | Area | Beds / Baths | Price | Details |
|---|---|---|---|---|---|

|
#1
Mount Pleasant Rd
Harrisville, RI 02830
|
1,232 sq. feet
|
1 baths 3 beds |
$449,900
|
show details |

|
#2
East Ave
Harrisville, RI 02830
|
1,008 sq. feet
|
2 baths 2 beds |
show details | |

|
#3
Fox Run Dr
Harrisville, RI 02830
|
1,720 sq. feet
|
2 baths 3 beds |
show details | |

|
#4
Slater Dr
Harrisville, RI 02830
|
- sq. feet
|
- baths - beds |
show details | |

|
#5
Whittier Ave
Providence, RI 02909
|
3 sq. feet
|
3 baths 6 beds |
$109,900
|
show details |

|
#6
Cook Rd
Cumberland, RI 02864
|
2,050 sq. feet
|
2 baths 4 beds |
$724,900
|
show details |

|
#7
Clarence Dr
Oxford, MA 01540
|
3,010 sq. feet
|
3 baths 5 beds |
$569,900
|
show details |

|
#8
Loomis St
North Attleboro, MA 02760
|
2,294 sq. feet
|
2 baths 4 beds |
$700,000
|
show details |

|
#9
Ruskin Ave
Woonsocket, RI 02895
|
1,344 sq. feet
|
1 baths 2 beds |
show details | |

|
#10
Breault St
Putnam, CT 06260
|
1,544 sq. feet
|
1 baths 3 beds |
show details |
| Photo | Address | Area | Beds / Baths | Price | Details |
|---|---|---|---|---|---|

|
#11
Hartford Pike
Dayville, CT 06241
|
1,484 sq. feet
|
2 baths 3 beds |
show details | |

|
#12
Griffiths Rd
Danielson, CT 06239
|
1,056 sq. feet
|
1 baths 3 beds |
show details | |

|
#13
S Main St
Hopedale, MA 01747
|
1,411 sq. feet
|
3 baths 1 beds |
show details | |

|
#14
Fabyan Rd
North Grosvenordale, CT 06255
|
1,203 sq. feet
|
1 baths 2 beds |
show details | |

|
#15
Senexet Rd
Putnam, CT 06260
|
1,260 sq. feet
|
2 baths 3 beds |
show details | |

|
#16
Alton Dr
Dudley, MA 01571
|
942 sq. feet
|
1 baths 3 beds |
show details | |

|
#17
S Main St
Bellingham, MA 02019
|
2,105 sq. feet
|
2 baths 3 beds |
show details | |

|
#18
Sabin St Unit 1
Putnam, CT 06260
|
1,348 sq. feet
|
2 baths 2 beds |
show details | |

|
#19
Mount Pleasant St
Oxford, MA 01540
|
1,295 sq. feet
|
2 baths 3 beds |
show details | |

|
#20
Elizabeth St
Dudley, MA 01571
|
1,326 sq. feet
|
1 baths 3 beds |
show details |
| Photo | Address | Area | Beds / Baths | Price | Details |
|---|---|---|---|---|---|

|
#21
Maynard St
Putnam, CT 06260
|
1,510 sq. feet
|
2 baths 5 beds |
show details | |

|
#22
Viens St
Putnam, CT 06260
|
1,510 sq. feet
|
1 baths 2 beds |
show details | |

|
#23
Pine St
Dudley, MA 01571
|
1,414 sq. feet
|
2 baths 4 beds |
show details | |

|
#24
Prospect St
Putnam, CT 06260
|
2,252 sq. feet
|
3 baths 3 beds |
show details | |

|
#25
Westside Dr Apt 109
North Grosvenordale, CT 06255
|
1,288 sq. feet
|
2 baths 2 beds |
show details | |

|
#26
-42 N Main St
Whitinsville, MA 01588
|
2,318 sq. feet
|
4 baths 6 beds |
show details | |

|
#27
Church St
Whitinsville, MA 01588
|
1,872 sq. feet
|
3 baths 3 beds |
show details | |

|
#28
Riverside Dr
North Grosvenordale, CT 06255
|
1,554 sq. feet
|
2 baths 4 beds |
show details | |

|
#29
Goldthwaite Rd
Whitinsville, MA 01588
|
1,930 sq. feet
|
1 baths 2 beds |
show details | |

|
#30
Buckley Hill Rd
North Grosvenordale, CT 06255
|
2,094 sq. feet
|
2 baths 5 beds |
show details |
| Photo | Address | Area | Beds / Baths | Price | Details |
|---|---|---|---|---|---|

|
#31
Mason Hill Rd
Dayville, CT 06241
|
1,512 sq. feet
|
2 baths 3 beds |
show details | |

|
#32
Lake St
Webster, MA 01570
|
2,400 sq. feet
|
2 baths 6 beds |
show details | |

|
#33
Penny Ln
Bellingham, MA 02019
|
1,994 sq. feet
|
3 baths 4 beds |
show details | |

|
#34
Tatem St
Putnam, CT 06260
|
912 sq. feet
|
1 baths 2 beds |
show details | |

|
#35
Heritage Rd
Putnam, CT 06260
|
2,482 sq. feet
|
3 baths 4 beds |
show details | |

|
#36
Lincoln St
Webster, MA 01570
|
1,505 sq. feet
|
2 baths 3 beds |
show details | |

|
#37
Bishop Hill Rd
Johnston, RI 02919
|
1,648 sq. feet
|
1 baths 3 beds |
show details | |

|
#38
Ivy Ln
Whitinsville, MA 01588
|
1,868 sq. feet
|
2 baths 3 beds |
show details | |

|
#39
Hannah Dr
Whitinsville, MA 01588
|
2,563 sq. feet
|
3 baths 4 beds |
show details | |

|
#40
Breakneck Hill Rd
Dayville, CT 06241
|
960 sq. feet
|
3 baths 3 beds |
show details |
| Photo | Address | Area | Beds / Baths | Price | Details |
|---|---|---|---|---|---|

|
#41
Bishop Hill Rd
Johnston, RI 02919
|
1,248 sq. feet
|
1 baths 3 beds |
show details | |

|
#42
Valley Green Court
Providence, RI 02904
|
1,440 sq. feet
|
3 baths 2 beds |
show details | |

|
#43
Orleans Ave
Danielson, CT 06239
|
1,056 sq. feet
|
1 baths 3 beds |
show details | |

|
#44
Oxford St S
Auburn, MA 01501
|
2,857 sq. feet
|
4 baths 4 beds |
show details | |

|
#45
Atwood Ave
Johnston, RI 02919
|
1,792 sq. feet
|
1 baths 4 beds |
show details | |

|
#46
Maple St
Danielson, CT 06239
|
960 sq. feet
|
1 baths 3 beds |
show details | |

|
#47
Elm Ct
Millbury, MA 01527
|
1,064 sq. feet
|
2 baths 3 beds |
show details | |

|
#48
Day St
Brooklyn, CT 06234
|
1,250 sq. feet
|
3 baths 3 beds |
show details | |

|
#49
What Cheer Ave
Providence, RI 02909
|
2,280 sq. feet
|
2 baths 3 beds |
show details | |

|
Check over 1 million property listings on Foreclosure.com!
|
browse all offers | |||

Latest news about housing in Harrisville, RI collected exclusively by city-data.com from local newspapers, TV, and radio stations

 | Is now a good time to buy in RI? (107 replies) |
| "The Conjuring" set in RI (39 replies) |
| Relocating to Rhode Island. Town/village suggestions? (90 replies) |
| Do all providence suburbs feel the same (53 replies) |
| Thoughts on North Smithfield (7 replies) |
| Are there any affordable places to live in Rhode Island anymore? (14 replies) |

Median year apartment built: 1959
Household type by relationship:
Households: 1,513- Male householders: 191 (37 living alone), Female householders: 594 (374 living alone)
263 spouses (263 opposite-sex spouses), 30 unmarried partners, (30 opposite-sex unmarried partners), 191 children (191 natural, 0 adopted, 0 stepchildren), 169 grandchildren, 0 brothers or sisters, 17 parents, 0 foster children, 0 other relatives, 52 non-relatives
Size of family households: 157 2-persons, 77 3-persons, 27 4-persons, 35 7-or-more-persons.
Size of nonfamily households: 441 1-person, 89 2-persons.
130 married couples with children.
28 single-parent households (28 men, 0 women).
78.5% of residents of Harrisville speak English at home.
19.3% of residents speak other Indo-European language at home (66% speak English very well, 34% speak English well).
Foreign born population: 82 (5.4%)
(48.8% of them are naturalized citizens)
| Here: | 7.0 |
| State: | 6.2 |
| Here: | 3.2 |
| State: | 4.1 |

- Bedrooms in owner-occupied houses and condos in Harrisville, Rhode Island
- 0no bedroom
- 01 bedroom
- 762 bedrooms
- 3033 bedrooms
- 984 bedrooms
- 05+ bedrooms

- Bedrooms in renter-occupied apartments in Harrisville, Rhode Island
- 47no bedroom
- 1701 bedroom
- 512 bedrooms
- 593 bedrooms
- 144 bedrooms
- 05+ bedrooms

- Cars and other vehicles available in Harrisville in owner-occupied houses/condos
- 0no vehicle
- 1661 vehicle
- 2192 vehicles
- 913 vehicles
- 04 vehicles
- 05+ vehicles

- Cars and other vehicles available in Harrisville in renter-occupied apartments
- 54no vehicle
- 1321 vehicle
- 1552 vehicles
- 03 vehicles
- 04 vehicles
- 05+ vehicles

- Rooms in owner-occupied houses in Harrisville, Rhode Island
- 01 room
- 02 rooms
- 163 rooms
- 284 rooms
- 05 rooms
- 1046 rooms
- 1817 rooms
- 478 rooms
- 1029+ rooms

- Rooms in renter-occupied apartments in Harrisville, Rhode Island
- 471 room
- 202 rooms
- 1513 rooms
- 514 rooms
- 145 rooms
- 466 rooms
- 147 rooms
- 08 rooms
- 09+ rooms


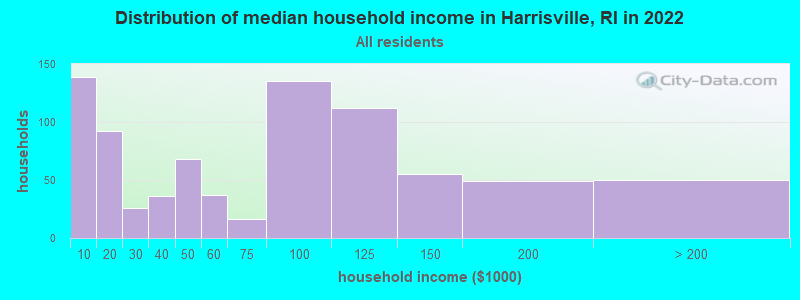
Harrisville, RI household income distribution

- 139Less than $10,000
- 92$10,000 to $19,999
- 26$20,000 to $29,999
- 36$30,000 to $39,999
- 68$40,000 to $49,999
- 37$50,000 to $59,999
- 16$60,000 to $74,999
- 135$75,000 to $99,999
- 112$100,000 to $124,999
- 55$125,000 to $149,999
- 49$150,000 to $199,999
- 50$200,000 or more
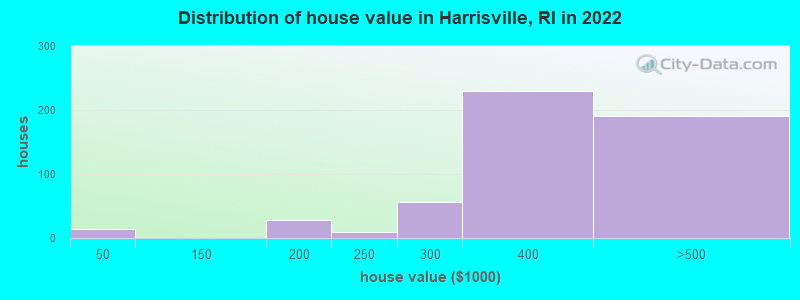
Home value of owner - occupied houses in 2022 in Harrisville, RI
-
- 14$15,000 to $19,999
- 19$150,000 to $174,999
- 8$175,000 to $199,999
- 8$200,000 to $249,999
- 56$250,000 to $299,999
- 228$300,000 to $399,999
- 191$400,000 to $499,999
Rent paid by renters in 2022 in Harrisville, RI
-
- 70$200 to $249
- 58$250 to $299
- 52$700 to $749
- 71$800 to $899
- 9$900 to $999
- 44$1,000 to $1,249
- 17$1,500 to $1,999


Percentage of workers working in this county: 53.9%
Number of people working at home: 27 (3.5% of all workers)
Travel time to work (commute)
- Less than 5 minutes: 17
- 5 to 9 minutes: 51
- 10 to 14 minutes: 0
- 15 to 19 minutes: 63
- 20 to 24 minutes: 75
- 25 to 29 minutes: 56
- 30 to 34 minutes: 130
- 35 to 39 minutes: 11
- 40 to 44 minutes: 72
- 45 to 59 minutes: 210
- 60 to 89 minutes: 0
- 90 or more minutes: 29
Means of transportation to work:
- Drove a car alone: 716 (85.7%)
- Carpooled: 71 (8.5%)
- Bus or trolley bus: 12 (1.4%)
- Walked: 30 (3.6%)
- Worked at home: 6 (0.7%)

- Unemployment by race in 2022
- Unemployment rate for White non-Hispanic residents
- 7.2%Females

- Year of entry for the foreign-born population in Harrisville, Rhode Island
- 02010 or later
- 02000 to 2009
- 01990 to 1999
- 191980 to 1989
- 181970 to 1979
- 10Before 1970

First ancestries reported:
- French: 106 (31.1%)
- French Canadian: 65 (19.1%)
- Irish: 44 (12.9%)
- Greek: 41 (12.0%)
- English: 37 (10.9%)
- Polish: 35 (10.3%)
- Portuguese: 12 (3.5%)
Most common places of birth for foreign-born residents (%):
| Harrisville: | 50.0% (41) |
| Rhode Island: | 0.4% (603) |
| Harrisville: | 42.7% (35) |
| Rhode Island: | 1.4% (2,155) |
Place of birth for U.S.-born residents:
- This state: 959
- Other state: 435
- Northeast: 293
- Midwest: 17
- South: 82
- West: 40
77.3% of Harrisville residents lived in the same house 1 years ago.
Out of people who lived in different houses, 47.3% lived in this county.
Out of people who lived in different counties, 0.0% lived in Rhode Island.
| Harrisville: | 77.3% |
| State average: | 89.3% |
Education attainment for males 25 years and older:
- No schooling: 0
- Nursery to 4th grade: 0
- 5th and 6th grade: 0
- 7th and 8th grade: 0
- 9th grade: 0
- 10th grade: 0
- 11th grade: 11
- 12th grade, no diploma: 0
- High school graduate (or equivalency): 125
- Less than 1 year of college: 46
- Some college more than 1 year, no degree: 54
- Associate degree: 0
- Bachelor's degree: 120
- Master's degree: 8
- Professional school degree: 0
- Doctorate degree: 0

Education attainment for females 25 years and older:
- No schooling: 0
- Nursery to 4th grade: 0
- 5th and 6th grade: 0
- 7th and 8th grade: 0
- 9th grade: 0
- 10th grade: 9
- 11th grade: 0
- 12th grade, no diploma: 0
- High school graduate (or equivalency): 423
- Less than 1 year of college: 174
- Some college more than 1 year, no degree: 28
- Associate degree: 42
- Bachelor's degree: 31
- Master's degree: 55
- Professional school degree: 16
- Doctorate degree: 0


Housing units in structures:
- One, detached: 339
- One, attached: 147
- Two: 73
- 3 or 4: 15
- 5 to 9: 35
- 10 to 19: 97
- 20 to 49: 81
- 50 or more: 48
House/condo owner moved in on average 19 years ago
Renter moved in on average 9 years ago

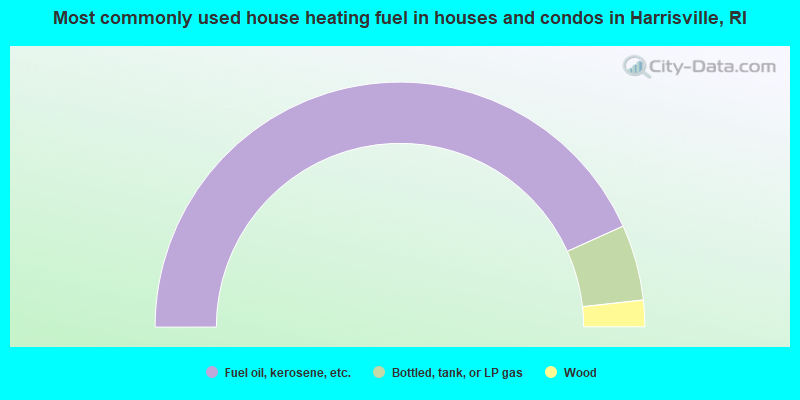
- 86.5%Fuel oil, kerosene, etc.
- 10.0%Bottled, tank, or LP gas
- 3.5%Wood
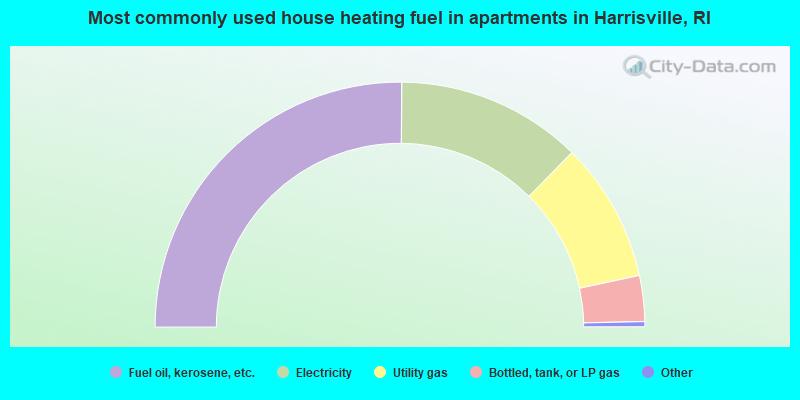
- 50.6%Fuel oil, kerosene, etc.
- 24.7%Electricity
- 18.6%Utility gas
- 6.1%Bottled, tank, or LP gas
Private vs. public school enrollment:
| Here: | 48.1% |
| Rhode Island: | 12.2% |
| Here: | 100.0% |
| Rhode Island: | 11.6% |
| Here: | 0.0% |
| Rhode Island: | 41.1% |


