Hammonville, KY (Kentucky) Houses and Residents
| Hammonville: | $129,417 |
| Kentucky: | $196,300 |
Total population: 2,006 (Urban population: 0, Rural population: 1,973 (386 farm, 1,587 nonfarm))
Houses: 875 (756 occupied: 668 owner occupied, 88 renter occupied)
| % of renters here: | 12% |
| State: | 31% |
Housing density: 11 houses/condos per square mile
Median price asked for vacant for-sale houses and condos in 2022 in this county: $139,509.
Median contract rent in 2022: $663 (lower quartile is $432, upper quartile is $966)
Median rent asked for vacant for-rent units in 2022: $544
Median gross rent in Hammonville, KY in 2022: $829
Housing units in Hammonville with a mortgage: 132 (0 second mortgage, 0 home equity loan, 0 both second mortgage and home equity loan)
Houses without a mortgage: 121
Compare current foreclosures near Hammonville, KY:
| Photo | Address | Area | Beds / Baths | Price | Details |
|---|---|---|---|---|---|

|
#1
Wells Rd
Buffalo, KY 42716
|
1,008 sq. feet
|
1 baths 2 beds |
show details | |

|
#2
Glendale Rd
Hodgenville, KY 42748
|
1,324 sq. feet
|
1 baths 3 beds |
show details | |

|
#3
Hunting Trail Rd
Munfordville, KY 42765
|
2,150 sq. feet
|
2 baths 3 beds |
show details | |

|
#4
Elk St
Munfordville, KY 42765
|
1,120 sq. feet
|
1 baths 3 beds |
show details | |

|
#5
Elk St
Munfordville, KY 42765
|
1,084 sq. feet
|
1 baths 2 beds |
show details | |

|
#6
N Buckner Ave
Munfordville, KY 42765
|
1,352 sq. feet
|
1 baths 3 beds |
show details | |

|
#7
Lone Star Rd
Upton, KY 42784
|
1,792 sq. feet
|
2 baths 3 beds |
show details | |

|
#8
S Dixie Hwy
Munfordville, KY 42765
|
1,590 sq. feet
|
1 baths 4 beds |
show details | |

|
#9
W Western Ave
Sonora, KY 42776
|
1,064 sq. feet
|
1 baths 3 beds |
show details | |

|
#10
Hammonsville Rd
Bonnieville, KY 42713
|
1,512 sq. feet
|
2 baths 3 beds |
show details |
| Photo | Address | Area | Beds / Baths | Price | Details |
|---|---|---|---|---|---|

|
#11
Vaughn Ave
Hodgenville, KY 42748
|
1,092 sq. feet
|
1 baths 3 beds |
show details | |

|
#12
N Jackson Hwy
Magnolia, KY 42757
|
1,334 sq. feet
|
1 baths 3 beds |
show details | |

|
#13
Grayson St
Upton, KY 42784
|
1,125 sq. feet
|
1 baths 3 beds |
show details | |

|
#14
Caple Ave
Hodgenville, KY 42748
|
1,232 sq. feet
|
1 baths 3 beds |
show details | |

|
#15
Flint Hill Rd
Sonora, KY 42776
|
1,498 sq. feet
|
2 baths 3 beds |
show details | |

|
#16
Leafdale Rd
Hodgenville, KY 42748
|
1,176 sq. feet
|
1 baths 3 beds |
show details | |

|
#17
Forestville Rd
Munfordville, KY 42765
|
840 sq. feet
|
1 baths 2 beds |
show details | |

|
#18
New St
Horse Cave, KY 42749
|
1,765 sq. feet
|
2 baths 3 beds |
show details | |

|
#19
Sportsman Lake Rd
Elizabethtown, KY 42701
|
1,680 sq. feet
|
1 baths 3 beds |
show details | |

|
#20
Comer Ave
Horse Cave, KY 42749
|
1,089 sq. feet
|
1 baths 2 beds |
show details |
| Photo | Address | Area | Beds / Baths | Price | Details |
|---|---|---|---|---|---|

|
#21
Railroad Dr
Hodgenville, KY 42748
|
804 sq. feet
|
1 baths 2 beds |
show details | |

|
#22
Center Point Rd
Sonora, KY 42776
|
1,668 sq. feet
|
1 baths 3 beds |
show details | |

|
#23
Main St
Munfordville, KY 42765
|
1,890 sq. feet
|
2 baths 4 beds |
show details | |

|
#24
New Glendale Rd
Glendale, KY 42740
|
2,381 sq. feet
|
2 baths 3 beds |
show details | |

|
#25
N L And N Turnpike Rd
Buffalo, KY 42716
|
988 sq. feet
|
1 baths 2 beds |
show details | |

|
#26
Crissy St
Upton, KY 42784
|
1,490 sq. feet
|
2 baths 3 beds |
show details | |

|
#27
New Jackson Hwy
Hodgenville, KY 42748
|
1,815 sq. feet
|
2 baths 3 beds |
show details | |

|
#28
Campground Rd
Bonnieville, KY 42713
|
1,168 sq. feet
|
1 baths 3 beds |
show details | |

|
#29
Julia Ln
Munfordville, KY 42765
|
1,536 sq. feet
|
2 baths 4 beds |
show details | |

|
#30
Hardyville Rd
Munfordville, KY 42765
|
1,217 sq. feet
|
1 baths 2 beds |
show details |
| Photo | Address | Area | Beds / Baths | Price | Details |
|---|---|---|---|---|---|

|
#31
Mill Rd
Magnolia, KY 42757
|
1,324 sq. feet
|
1 baths 3 beds |
show details | |

|
#32
Jones St
Upton, KY 42784
|
1,232 sq. feet
|
1 baths 3 beds |
show details | |

|
#33
Mount Tabor Rd
Buffalo, KY 42716
|
1,248 sq. feet
|
2 baths 3 beds |
show details | |

|
#34
Sonora Hardin Springs Rd
Sonora, KY 42776
|
- sq. feet
|
2 baths 4 beds |
show details | |

|
#35
College St
Hodgenville, KY 42748
|
1,352 sq. feet
|
1 baths - beds |
show details | |

|
#36
Highway 1464
Greensburg, KY 42743
|
- sq. feet
|
- baths - beds |
show details | |

|
#37
Marshall Ridge Rd
Greensburg, KY 42743
|
- sq. feet
|
- baths - beds |
show details | |

|
#38
Waterloo Rd
Horse Cave, KY 42749
|
- sq. feet
|
- baths - beds |
show details | |

|
#39
W Buckner Hill Rd
Greensburg, KY 42743
|
- sq. feet
|
- baths - beds |
show details | |

|
#40
Hedge Apple Ln
Sonora, KY 42776
|
- sq. feet
|
- baths - beds |
show details |
| Photo | Address | Area | Beds / Baths | Price | Details |
|---|---|---|---|---|---|

|
#41
E Main St
Horse Cave, KY 42749
|
- sq. feet
|
- baths - beds |
show details | |

|
#42
Straley Aly
Mount Sherman, KY 42764
|
- sq. feet
|
- baths - beds |
show details | |

|
#43
Pierce Donansburg Rd
Greensburg, KY 42743
|
- sq. feet
|
- baths - beds |
show details | |

|
#44
Harper Dr Apt 10
Horse Cave, KY 42749
|
- sq. feet
|
- baths - beds |
show details | |

|
#45
Shipp Rd
Magnolia, KY 42757
|
- sq. feet
|
- baths - beds |
show details | |

|
#46
Pierce Donansburg Rd
Greensburg, KY 42743
|
- sq. feet
|
- baths - beds |
show details | |

|
#47
Old Hodgenville Rd
Greensburg, KY 42743
|
- sq. feet
|
- baths - beds |
show details | |

|
#48
Phillips Ln
Hodgenville, KY 42748
|
- sq. feet
|
- baths - beds |
show details | |

|
#49
Highway 218
Greensburg, KY 42743
|
- sq. feet
|
- baths - beds |
show details | |

|
Check over 1 million property listings on Foreclosure.com!
|
browse all offers | |||

Household type by relationship:
Households: 17,972- In family households: 15,416 (3,702 male householders, 1,226 female householders)
3,817 spouses, 5,343 children (4,878 natural, 137 adopted, 328 stepchildren), 499 grandchildren, 100 brothers or sisters, 88 parents, foster children, 168 other relatives, 375 non-relatives
- In nonfamily households: 2,556 (1,063 male householders (855 living alone)), 1,106 female householders (1,005 living alone)), 387 nonrelatives
- In group quarters: 227 (all institutionalized)
3,184 married couples with children.
846 single-parent households (216 men, 630 women).
96.2% of residents of Hammonville speak English at home.
2.4% of residents speak Spanish at home (77% speak English very well, 5% speak English well, 18% speak English not well).
1.4% of residents speak other Indo-European language at home (100% speak English very well).
Foreign born population: 47 (2.3%)
(40.4% of them are naturalized citizens)
| Here: | 6.4 |
| State: | 6.4 |
| Here: | 5.0 |
| State: | 4.4 |

- Bedrooms in owner-occupied houses and condos in Hammonville, Kentucky
- 0no bedroom
- 331 bedroom
- 1982 bedrooms
- 3043 bedrooms
- 1074 bedrooms
- 265+ bedrooms

- Bedrooms in renter-occupied apartments in Hammonville, Kentucky
- 0no bedroom
- 121 bedroom
- 262 bedrooms
- 383 bedrooms
- 124 bedrooms
- 05+ bedrooms

- Cars and other vehicles available in Hammonville in owner-occupied houses/condos
- 7no vehicle
- 1721 vehicle
- 3272 vehicles
- 1083 vehicles
- 314 vehicles
- 235+ vehicles

- Cars and other vehicles available in Hammonville in renter-occupied apartments
- 18no vehicle
- 331 vehicle
- 282 vehicles
- 93 vehicles
- 04 vehicles
- 05+ vehicles

- Rooms in owner-occupied houses in Hammonville, Kentucky
- 01 room
- 72 rooms
- 133 rooms
- 1154 rooms
- 1705 rooms
- 1526 rooms
- 777 rooms
- 518 rooms
- 839+ rooms

- Rooms in renter-occupied apartments in Hammonville, Kentucky
- 01 room
- 02 rooms
- 63 rooms
- 284 rooms
- 245 rooms
- 66 rooms
- 147 rooms
- 48 rooms
- 69+ rooms


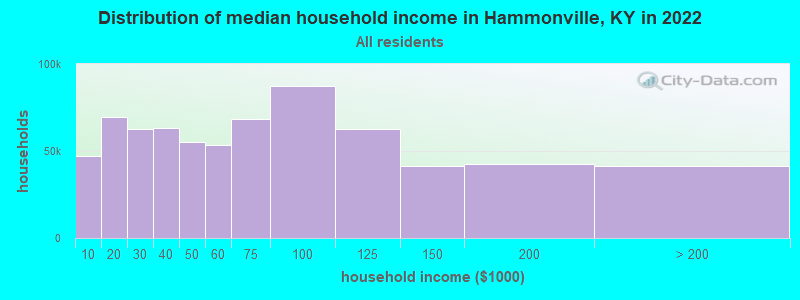
Hammonville, KY household income distribution

- 40,788Less than $10,000
- 66,176$10,000 to $19,999
- 55,762$20,000 to $29,999
- 59,079$30,000 to $39,999
- 45,146$40,000 to $49,999
- 49,600$50,000 to $59,999
- 56,902$60,000 to $74,999
- 78,859$75,000 to $99,999
- 56,353$100,000 to $124,999
- 34,577$125,000 to $149,999
- 34,270$150,000 to $199,999
- 29,460$200,000 or more
Percentage of workers working in this county: 46.8%
Number of people working at home: 72 (8.6% of all workers)
Travel time to work (commute)
- Less than 5 minutes: 38
- 5 to 9 minutes: 25
- 10 to 14 minutes: 37
- 15 to 19 minutes: 48
- 20 to 24 minutes: 141
- 25 to 29 minutes: 26
- 30 to 34 minutes: 140
- 35 to 39 minutes: 38
- 40 to 44 minutes: 65
- 45 to 59 minutes: 50
- 60 to 89 minutes: 68
- 90 or more minutes: 82
Means of transportation to work:
- Drove a car alone: 607 (74.8%)
- Carpooled: 133 (16.4%)
- Walked: 18 (2.2%)
- Worked at home: 53 (6.5%)


- Year of entry for the foreign-born population in Hammonville, Kentucky
- 61995 to March 2000
- 61990 to 1994
- 01985 to 1989
- 01980 to 1984
- 01975 to 1979
- 71970 to 1974
- 01965 to 1969
- 8Before 1965
Most common places of birth for foreign-born residents (%):
| Hammonville: | 55.6% (15) |
| Kentucky: | 8.3% (6,658) |
| Hammonville: | 44.4% (12) |
| Kentucky: | 19.3% (15,511) |
Place of birth for U.S.-born residents:
- This state: 1,569
- Other state: 355
- Northeast: 72
- Midwest: 167
- South: 79
- West: 37
65% of Hammonville residents lived in the same house 5 years ago.
Out of people who lived in different houses, 50% lived in this county.
Out of people who lived in different counties, 71% lived in Kentucky.
Education attainment for males 25 years and older:
- No schooling: 22
- Nursery to 4th grade: 0
- 5th and 6th grade: 21
- 7th and 8th grade: 97
- 9th grade: 23
- 10th grade: 45
- 11th grade: 55
- 12th grade, no diploma: 27
- High school graduate (or equivalency): 173
- Less than 1 year of college: 31
- Some college more than 1 year, no degree: 78
- Associate degree: 42
- Bachelor's degree: 6
- Master's degree: 7
- Professional school degree: 5
- Doctorate degree: 0

Education attainment for females 25 years and older:
- No schooling: 8
- Nursery to 4th grade: 0
- 5th and 6th grade: 12
- 7th and 8th grade: 55
- 9th grade: 46
- 10th grade: 53
- 11th grade: 23
- 12th grade, no diploma: 23
- High school graduate (or equivalency): 238
- Less than 1 year of college: 24
- Some college more than 1 year, no degree: 83
- Associate degree: 31
- Bachelor's degree: 14
- Master's degree: 12
- Professional school degree: 0
- Doctorate degree: 0


Housing units in structures:
- One, detached: 608
- Mobile homes: 267
Median worth of mobile homes: $74,525
Housing units lacking complete kitchen facilities: 0.6%

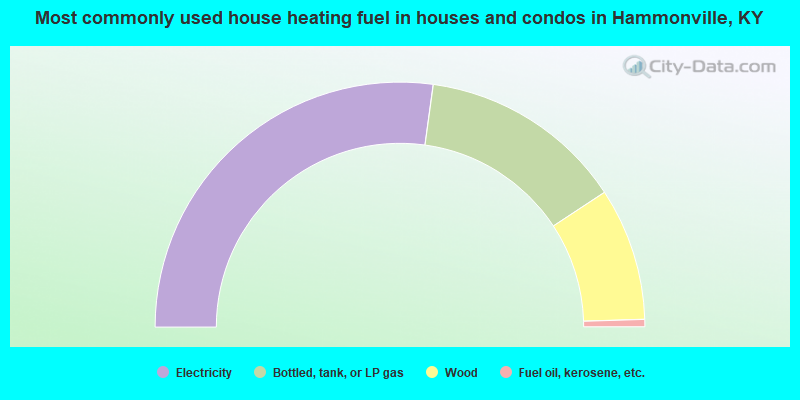
- 54.3%Electricity
- 27.1%Bottled, tank, or LP gas
- 17.5%Wood
- 1.0%Fuel oil, kerosene, etc.
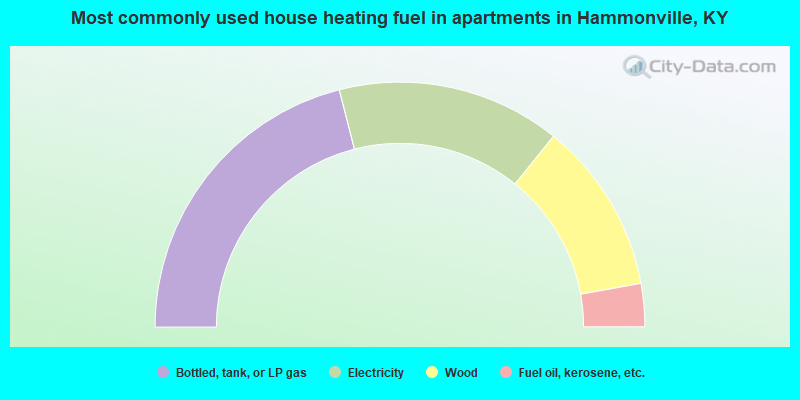
- 42.0%Bottled, tank, or LP gas
- 29.5%Electricity
- 22.7%Wood
- 5.7%Fuel oil, kerosene, etc.
Private vs. public school enrollment:
| Here: | 16.9% |
| Kentucky: | 11.9% |
| Here: | 0.0% |
| Kentucky: | 10.6% |
| Here: | 22.4% |
| Kentucky: | 18.1% |


