Hallandale, FL (Florida) Houses and Residents
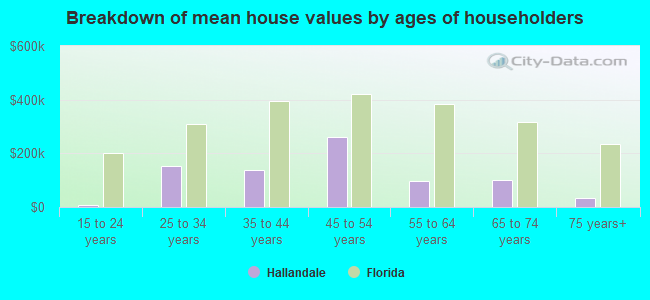
| Hallandale: | $287,762 |
| Florida: | $354,100 |
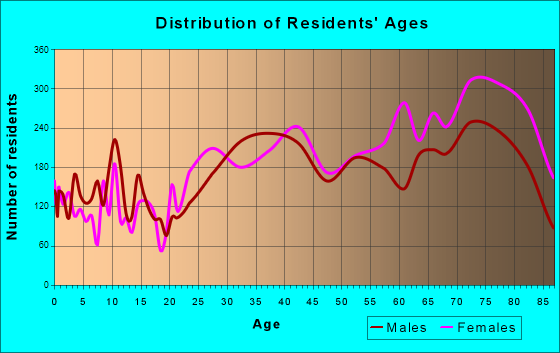
Total population: 36,703 (Urban population: 34,551, Rural population: 0)
Houses: 25,098 (18,110 occupied: 11,957 owner occupied, 6,153 renter occupied)
| % of renters here: | 34% |
| State: | 33% |
Housing density: 5,962 houses/condos per square mile
Median price asked for vacant for-sale houses and condos in 2022 in this county: $504,762.
Median contract rent in 2022: $1,379 (lower quartile is $1,027, upper quartile is $1,782)
Median rent asked for vacant for-rent units in 2022: $1,257
Median gross rent in Hallandale, FL in 2022: $1,532
Housing units in Hallandale with a mortgage: 1,588 (158 second mortgage, 124 home equity loan, 9 both second mortgage and home equity loan)
Houses without a mortgage: 782
Compare current foreclosures in Hallandale, FL:
| Photo | Address | Area | Beds / Baths | Price | Details |
|---|---|---|---|---|---|

|
#1
Parkview Dr Apt 804
Hallandale, FL 33009
|
1,075 sq. feet
|
1 baths 1 beds |
$259,900
|
show details |

|
#2
NE 12th Ave Apt 703
Hallandale, FL 33009
|
847 sq. feet
|
1 baths 1 beds |
show details | |

|
#3
SW 2nd St # 103
Hallandale, FL 33009
|
3,704 sq. feet
|
9 baths 9 beds |
show details | |

|
#4
NE 12th Ave Apt 506
Hallandale, FL 33009
|
847 sq. feet
|
1 baths 1 beds |
show details | |

|
#5
NW 10th St
Hallandale, FL 33009
|
1,825 sq. feet
|
2 baths 3 beds |
show details | |

|
#6
Three Islands Blvd Apt 1012
Hallandale, FL 33009
|
1,780 sq. feet
|
2 baths 3 beds |
show details | |

|
#7
NE 12th Ave Apt 303
Hallandale, FL 33009
|
847 sq. feet
|
1 baths 1 beds |
show details | |

|
#8
S Ocean Dr Apt 724
Hallandale, FL 33009
|
719 sq. feet
|
1 baths 1 beds |
show details | |

|
#9
SE 3rd Avenue Ext # 403
Hallandale, FL 33009
|
1,195 sq. feet
|
2 baths 3 beds |
show details | |

|
#10
S Ocean Dr Apt 303
Hallandale, FL 33009
|
1,020 sq. feet
|
1 baths 1 beds |
show details |
| Photo | Address | Area | Beds / Baths | Price | Details |
|---|---|---|---|---|---|

|
#11
NW 3rd Ct
Hallandale, FL 33009
|
1,476 sq. feet
|
1 baths 3 beds |
show details | |

|
#12
NE 14th Ave Apt 212
Hallandale, FL 33009
|
1,100 sq. feet
|
2 baths 2 beds |
show details | |

|
#13
S Ocean Dr Apt 901
Hallandale, FL 33009
|
1,360 sq. feet
|
2 baths 2 beds |
show details | |

|
#14
SW 7th St # 2
Hallandale, FL 33009
|
2,589 sq. feet
|
4 baths 4 beds |
show details | |

|
#15
SW 9th St # 1
Hallandale, FL 33009
|
2,111 sq. feet
|
2 baths 2 beds |
show details | |

|
#16
Parkview Dr Apt 823
Hallandale, FL 33009
|
1,075 sq. feet
|
2 baths 1 beds |
show details | |

|
#17
NE 7th St Apt 216
Hallandale, FL 33009
|
1,180 sq. feet
|
2 baths 1 beds |
show details | |

|
#18
SE 2nd St Apt 403f
Hallandale, FL 33009
|
755 sq. feet
|
1 baths 1 beds |
show details | |

|
#19
NE 14th Ave Apt 406
Hallandale, FL 33009
|
847 sq. feet
|
1 baths 1 beds |
show details | |

|
#20
SE 3rd Ave Apt 502c
Hallandale, FL 33009
|
1,700 sq. feet
|
2 baths 2 beds |
show details |
| Photo | Address | Area | Beds / Baths | Price | Details |
|---|---|---|---|---|---|

|
#21
SE 3rd St Apt 303t
Hallandale, FL 33009
|
755 sq. feet
|
1 baths 1 beds |
show details | |

|
#22
Diplomat Pkwy Apt 610
Hallandale, FL 33009
|
1,135 sq. feet
|
2 baths 2 beds |
show details | |

|
#23
NE 2nd St Apt 112
Hallandale, FL 33009
|
812 sq. feet
|
2 baths 2 beds |
show details | |

|
#24
Golden Isles Dr Apt 401
Hallandale, FL 33009
|
1,680 sq. feet
|
2 baths 2 beds |
show details | |

|
#25
S Ocean Dr Apt 1502
Hallandale, FL 33009
|
1,315 sq. feet
|
2 baths 2 beds |
show details | |

|
#26
Three Islands Blvd Apt
Hallandale, FL 33009
|
1,140 sq. feet
|
1 baths 1 beds |
show details | |

|
#27
Leslie Dr Apt 402
Hallandale, FL 33009
|
1,075 sq. feet
|
2 baths 1 beds |
show details | |

|
#28
S Ocean Dr Apt 407
Hallandale, FL 33009
|
1,000 sq. feet
|
1 baths 1 beds |
show details | |

|
#29
S Ocean Dr Apt 1802
Hallandale, FL 33009
|
1,841 sq. feet
|
3 baths 3 beds |
show details | |

|
#30
SE 3rd Ave Apt 206b
Hallandale, FL 33009
|
755 sq. feet
|
1 baths 1 beds |
show details |
| Photo | Address | Area | Beds / Baths | Price | Details |
|---|---|---|---|---|---|

|
#31
NE 24th 100
Hallandale, FL 33009
|
2,083 sq. feet
|
2 baths 3 beds |
show details | |

|
#32
Golden Isles Dr Apt
Hallandale, FL 33009
|
825 sq. feet
|
1 baths 1 beds |
show details | |

|
#33
S Ocean Dr Apt 1502
Hallandale, FL 33009
|
1,315 sq. feet
|
2 baths 2 beds |
show details | |

|
#34
NE 5th St
Hallandale, FL 33009
|
1,748 sq. feet
|
- baths 2 beds |
show details | |

|
#35
SW 8th St
Hallandale, FL 33009
|
2,092 sq. feet
|
- baths 3 beds |
show details | |

|
#36
S Ocean Dr Apt 9h
Hallandale, FL 33009
|
- sq. feet
|
- baths - beds |
show details | |

|
#37
SE 3rd Ave
Hallandale, FL 33009
|
- sq. feet
|
- baths - beds |
show details | |

|
#38
S Ocean Dr Apt 905
Hallandale, FL 33009
|
- sq. feet
|
- baths - beds |
show details | |

|
#39
S Ocean Dr Apt 605
Hallandale, FL 33009
|
- sq. feet
|
- baths - beds |
show details | |

|
#40
NE 3rd St
Hallandale, FL 33009
|
- sq. feet
|
- baths - beds |
show details |
| Photo | Address | Area | Beds / Baths | Price | Details |
|---|---|---|---|---|---|

|
#41
Layne Blvd Apt 311
Hallandale, FL 33009
|
- sq. feet
|
- baths - beds |
show details | |

|
#42
Paradise Isle Blvd Apt 303
Hallandale, FL 33009
|
- sq. feet
|
- baths - beds |
show details | |

|
#43
NE 14th Ave Apt 205
Hallandale, FL 33009
|
- sq. feet
|
- baths - beds |
show details | |

|
#44
NE 4th St Apt 7
Hallandale, FL 33009
|
- sq. feet
|
- baths - beds |
show details | |

|
#45
SE 3rd Ave
Hallandale, FL 33009
|
- sq. feet
|
- baths - beds |
show details | |

|
#46
NW 8th Ave Apt 208
Hallandale, FL 33009
|
- sq. feet
|
- baths - beds |
show details | |

|
#47
NE 3rd St Apt 3
Hallandale, FL 33009
|
- sq. feet
|
- baths - beds |
show details | |

|
#48
Lori Ln
Hallandale, FL 33009
|
- sq. feet
|
- baths - beds |
show details | |

|
#49
SW 6th St
Hallandale, FL 33009
|
1,788 sq. feet
|
- baths - beds |
show details | |

|
Check over 1 million property listings on Foreclosure.com!
|
browse all offers | |||
Latest news about housing in Hallandale, FL collected exclusively by city-data.com from local newspapers, TV, and radio stations


Household type by relationship:
Households: 1,731,174- In family households: 1,413,253 (269,141 male householders, 165,347 female householders)
293,617 spouses, 494,558 children (462,215 natural, 9,274 adopted, 23,069 stepchildren), 37,690 grandchildren, 25,833 brothers or sisters, 28,014 parents, foster children, 36,210 other relatives, 47,765 non-relatives
- In nonfamily households: 317,921 (120,559 male householders (88,038 living alone)), 131,000 female householders (109,501 living alone)), 66,362 nonrelatives
- In group quarters: 16,892 (10,931 institutionalized population)
240,332 married couples with children.
100,923 single-parent households (20,481 men, 80,442 women).
58.8% of residents of Hallandale speak English at home.
19.2% of residents speak Spanish at home (51% speak English very well, 27% speak English well, 17% speak English not well, 5% don't speak English at all).
18.8% of residents speak other Indo-European language at home (52% speak English very well, 31% speak English well, 14% speak English not well, 3% don't speak English at all).
0.9% of residents speak Asian or Pacific Island language at home (46% speak English very well, 35% speak English well, 14% speak English not well, 5% don't speak English at all).
2.3% of residents speak other language at home (45% speak English very well, 38% speak English well, 16% speak English not well, 1% don't speak English at all).
Foreign born population: 22,227 (53.6%)
(71.0% of them are naturalized citizens)
| Here: | 3.2 |
| State: | 5.9 |
| Here: | 3.8 |
| State: | 4.2 |
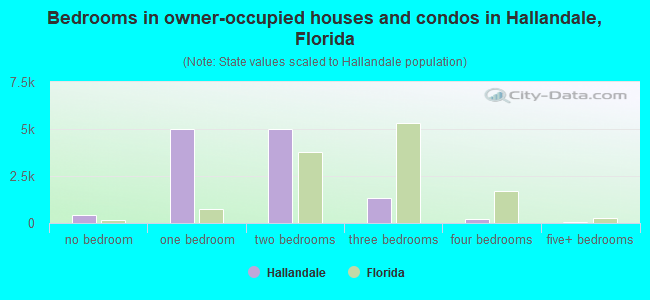
- Bedrooms in owner-occupied houses and condos in Hallandale, Florida
- 407no bedroom
- 4,9851 bedroom
- 4,9752 bedrooms
- 1,3053 bedrooms
- 2234 bedrooms
- 625+ bedrooms
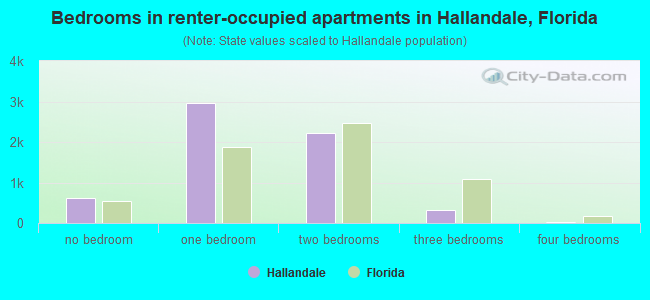
- Bedrooms in renter-occupied apartments in Hallandale, Florida
- 619no bedroom
- 2,9751 bedroom
- 2,2102 bedrooms
- 3283 bedrooms
- 214 bedrooms
- 05+ bedrooms
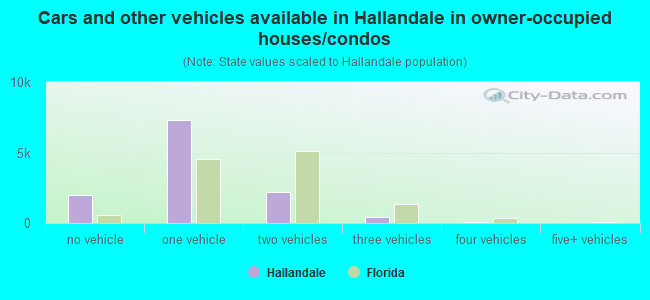
- Cars and other vehicles available in Hallandale in owner-occupied houses/condos
- 1,970no vehicle
- 7,2861 vehicle
- 2,2112 vehicles
- 4103 vehicles
- 604 vehicles
- 205+ vehicles
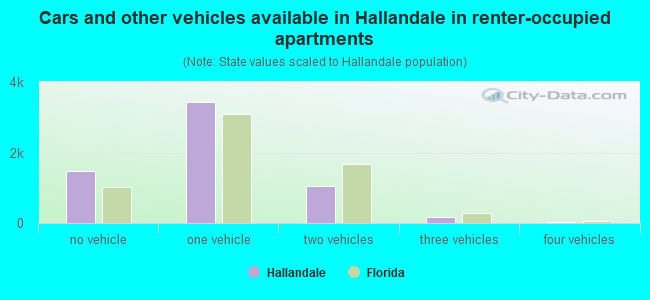
- Cars and other vehicles available in Hallandale in renter-occupied apartments
- 1,470no vehicle
- 3,4401 vehicle
- 1,0442 vehicles
- 1703 vehicles
- 294 vehicles
- 05+ vehicles
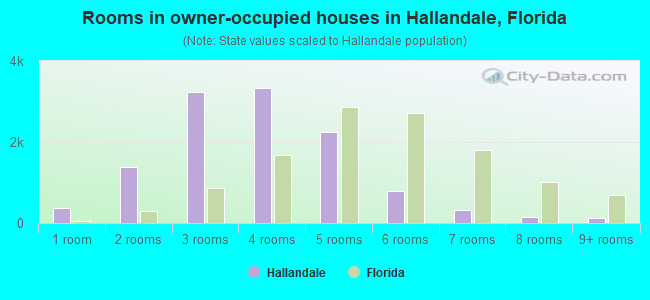
- Rooms in owner-occupied houses in Hallandale, Florida
- 3621 room
- 1,3872 rooms
- 3,2293 rooms
- 3,3344 rooms
- 2,2425 rooms
- 7956 rooms
- 3317 rooms
- 1458 rooms
- 1329+ rooms
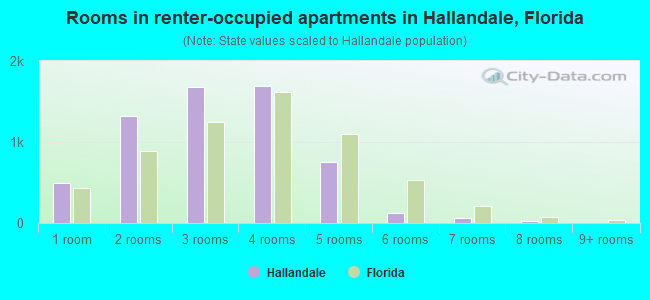
- Rooms in renter-occupied apartments in Hallandale, Florida
- 5001 room
- 1,3202 rooms
- 1,6853 rooms
- 1,6904 rooms
- 7515 rooms
- 1256 rooms
- 587 rooms
- 248 rooms
- 09+ rooms
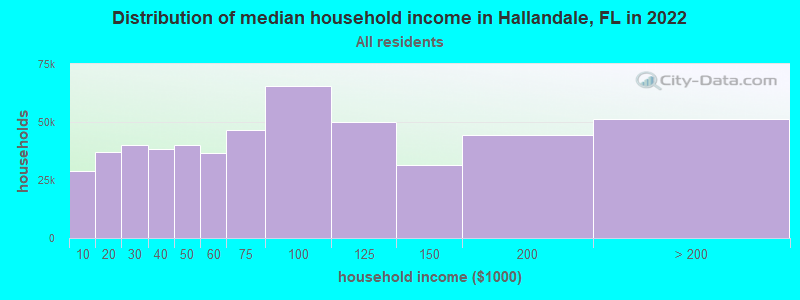
Hallandale, FL household income distribution

- 28,916Less than $10,000
- 37,117$10,000 to $19,999
- 40,227$20,000 to $29,999
- 38,408$30,000 to $39,999
- 39,939$40,000 to $49,999
- 36,584$50,000 to $59,999
- 46,709$60,000 to $74,999
- 65,502$75,000 to $99,999
- 49,947$100,000 to $124,999
- 31,361$125,000 to $149,999
- 44,578$150,000 to $199,999
- 51,293$200,000 or more
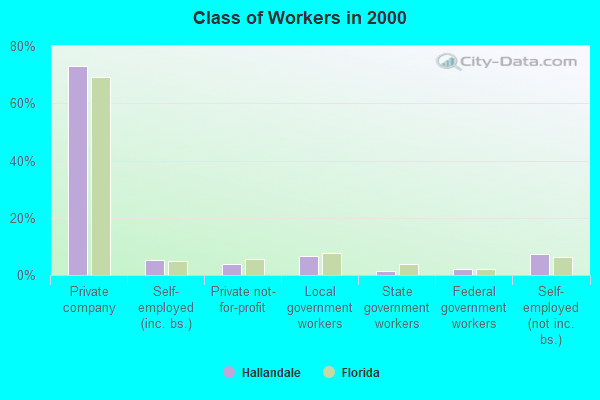
Percentage of workers working in this county: 61.2%
Number of people working at home: 2,475 (14.4% of all workers)
Travel time to work (commute)
- Less than 5 minutes: 100
- 5 to 9 minutes: 1,041
- 10 to 14 minutes: 1,896
- 15 to 19 minutes: 1,938
- 20 to 24 minutes: 1,629
- 25 to 29 minutes: 784
- 30 to 34 minutes: 2,096
- 35 to 39 minutes: 385
- 40 to 44 minutes: 489
- 45 to 59 minutes: 1,105
- 60 to 89 minutes: 765
- 90 or more minutes: 323
Means of transportation to work:
- Drove a car alone: 9,927 (76.6%)
- Carpooled: 1,502 (11.6%)
- Bus or trolley bus: 529 (4.1%)
- Taxi: 22 (0.2%)
- Motorcycle: 17 (0.1%)
- Bicycle: 54 (0.4%)
- Walked: 357 (2.8%)
- Other means: 143 (1.1%)
- Worked at home: 411 (3.2%)
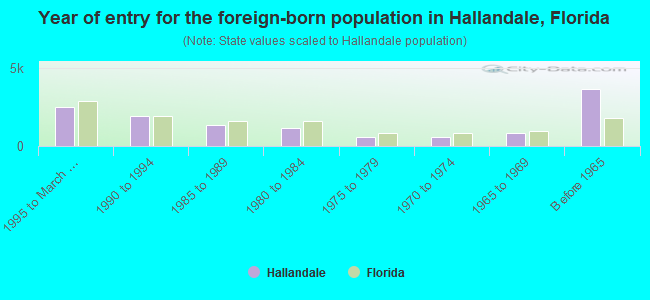
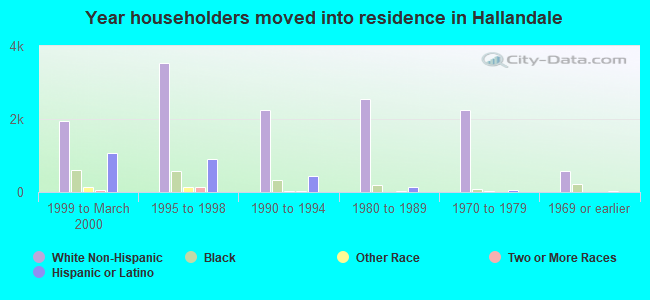
- Year of entry for the foreign-born population in Hallandale, Florida
- 2,4841995 to March 2000
- 1,8951990 to 1994
- 1,3321985 to 1989
- 1,1541980 to 1984
- 5861975 to 1979
- 5621970 to 1974
- 8351965 to 1969
- 3,629Before 1965
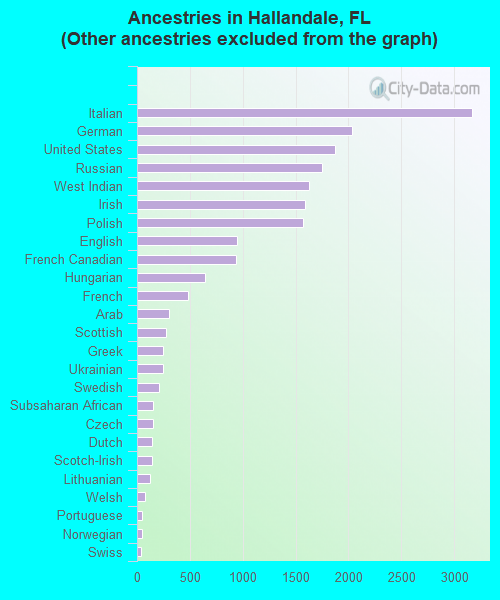
First ancestries reported:
- Other: 14,653 (43.7%)
- Italian: 3,171 (9.5%)
- German: 2,037 (6.1%)
- United States: 1,874 (5.6%)
- Russian: 1,750 (5.2%)
- West Indian: 1,623 (4.8%)
- Irish: 1,589 (4.7%)
- Polish: 1,573 (4.7%)
- English: 948 (2.8%)
- French Canadian: 934 (2.8%)
- Hungarian: 644 (1.9%)
- French: 482 (1.4%)
- Arab: 303 (0.9%)
- Scottish: 270 (0.8%)
- Greek: 243 (0.7%)
- Ukrainian: 242 (0.7%)
- Swedish: 209 (0.6%)
- Subsaharan African: 153 (0.5%)
- Czech: 151 (0.5%)
- Dutch: 145 (0.4%)
- Scotch-Irish: 145 (0.4%)
- Lithuanian: 126 (0.4%)
- Welsh: 73 (0.2%)
- Portuguese: 47 (0.1%)
- Norwegian: 46 (0.1%)
- Swiss: 38 (0.1%)
- Slovak: 32 (0.10%)
- Danish: 19 (0.06%)
Most common places of birth for foreign-born residents (%):
| Hallandale: | 12.8% (1,600) |
| Florida: | 3.7% (99,139) |
| Hallandale: | 9.2% (1,142) |
| Florida: | 24.1% (642,951) |
| Hallandale: | 6.9% (862) |
| Florida: | 0.3% (9,108) |
| Hallandale: | 5.8% (723) |
| Florida: | 0.9% (24,998) |
| Hallandale: | 5.5% (683) |
| Florida: | 5.9% (157,371) |
| Hallandale: | 4.6% (571) |
| Florida: | 2.0% (53,939) |
| Hallandale: | 4.2% (523) |
| Florida: | 6.8% (182,224) |
| Hallandale: | 3.9% (484) |
| Florida: | 2.4% (64,088) |
| Hallandale: | 3.3% (417) |
| Florida: | 5.3% (141,182) |
| Hallandale: | 3.1% (383) |
| Florida: | 1.2% (31,508) |
| Hallandale: | 3.0% (370) |
| Florida: | 0.4% (9,948) |
| Hallandale: | 2.8% (349) |
| Florida: | 0.5% (13,768) |
| Hallandale: | 2.2% (280) |
| Florida: | 1.7% (44,536) |
| Hallandale: | 1.8% (224) |
| Florida: | 1.0% (28,022) |
| Hallandale: | 1.6% (197) |
| Florida: | 2.5% (66,690) |
| Hallandale: | 1.6% (196) |
| Florida: | 1.8% (47,351) |
| Hallandale: | 1.5% (191) |
| Florida: | 1.4% (38,484) |
Place of birth for U.S.-born residents:
- This state: 6,416
- Other state: 14,795
- Northeast: 10,339
- Midwest: 2,024
- South: 2,156
- West: 276
56% of Hallandale residents lived in the same house 5 years ago.
Out of people who lived in different houses, 42% lived in this county.
Out of people who lived in different counties, 52% lived in Florida.
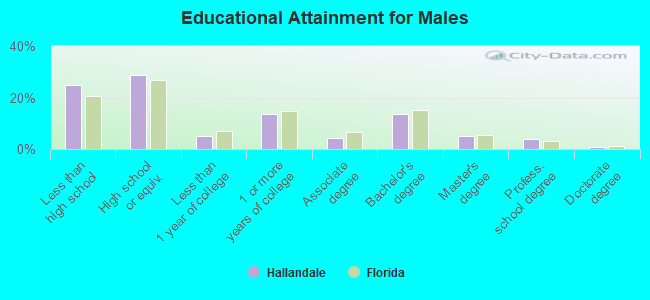
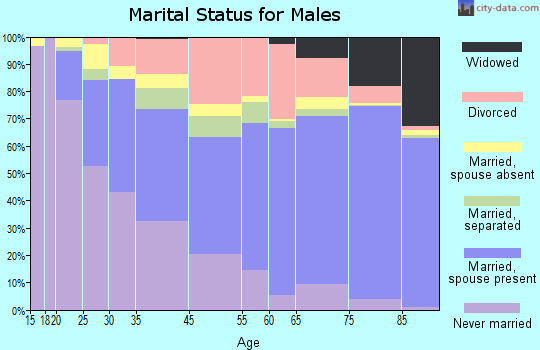
Education attainment for males 25 years and older:
- No schooling: 200
- Nursery to 4th grade: 57
- 5th and 6th grade: 269
- 7th and 8th grade: 618
- 9th grade: 316
- 10th grade: 514
- 11th grade: 529
- 12th grade, no diploma: 689
- High school graduate (or equivalency): 3,702
- Less than 1 year of college: 622
- Some college more than 1 year, no degree: 1,714
- Associate degree: 535
- Bachelor's degree: 1,756
- Master's degree: 648
- Professional school degree: 520
- Doctorate degree: 106
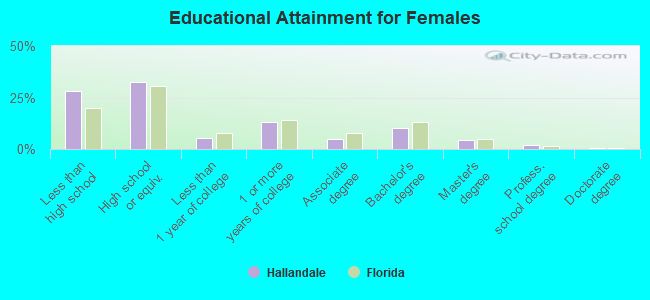
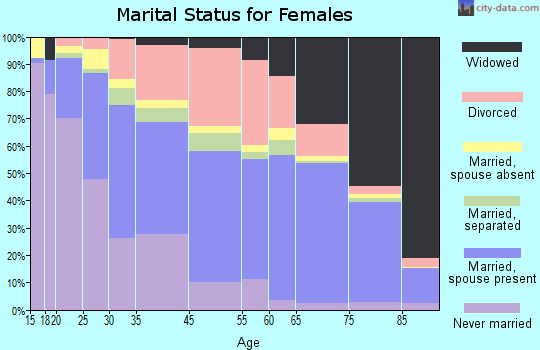
Education attainment for females 25 years and older:
- No schooling: 139
- Nursery to 4th grade: 52
- 5th and 6th grade: 354
- 7th and 8th grade: 877
- 9th grade: 465
- 10th grade: 762
- 11th grade: 498
- 12th grade, no diploma: 1,254
- High school graduate (or equivalency): 5,026
- Less than 1 year of college: 794
- Some college more than 1 year, no degree: 2,009
- Associate degree: 716
- Bachelor's degree: 1,569
- Master's degree: 661
- Professional school degree: 278
- Doctorate degree: 55
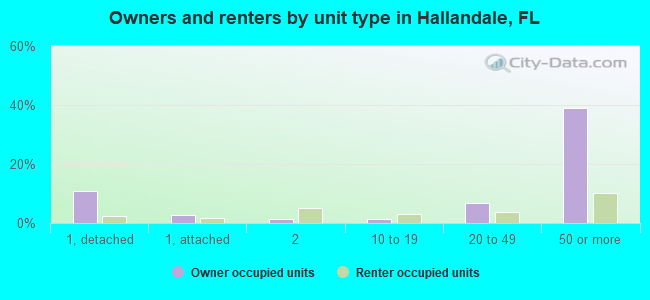
Housing units in structures:
- One, detached: 2,712
- One, attached: 856
- Two: 1,359
- 3 or 4: 941
- 5 to 9: 748
- 10 to 19: 1,100
- 20 to 49: 2,939
- 50 or more: 13,384
- Mobile homes: 1,018
- Boats, RVs, vans, etc.: 41
Median worth of mobile homes: $36,117
Housing units lacking complete kitchen facilities: 0.7%
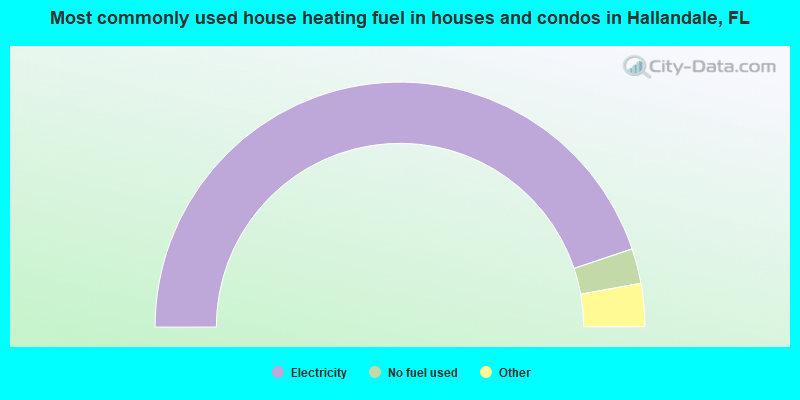
- 89.6%Electricity
- 4.6%No fuel used
- 3.8%Utility gas
- 1.2%Bottled, tank, or LP gas
- 0.6%Fuel oil, kerosene, etc.
- 0.2%Other fuel
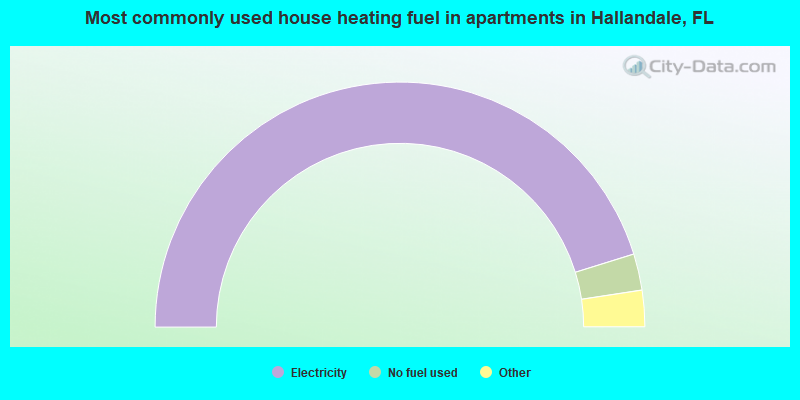
- 90.4%Electricity
- 4.8%No fuel used
- 2.6%Utility gas
- 1.7%Bottled, tank, or LP gas
- 0.5%Fuel oil, kerosene, etc.
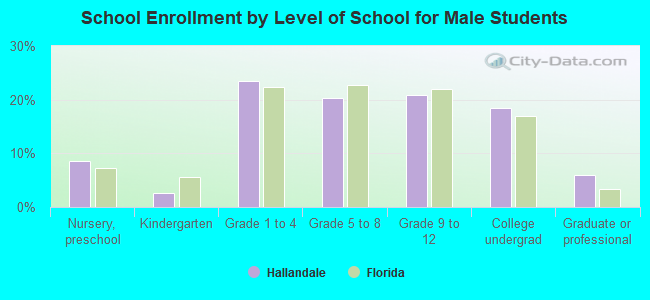
Private vs. public school enrollment:
| Here: | 16.4% |
| Florida: | 11.7% |
| Here: | 8.6% |
| Florida: | 9.7% |
| Here: | 22.2% |
| Florida: | 21.0% |