Work and Jobs in Hallandale, Florida (FL) Detailed Stats
Occupations, Industries, Unemployment, Workers, Commute

Recent posts about work in Hallandale, Florida on our local forum with over 2,400,000 registered users:

Latest news about work in Hallandale, FL collected exclusively by city-data.com from local newspapers, TV, and radio stations
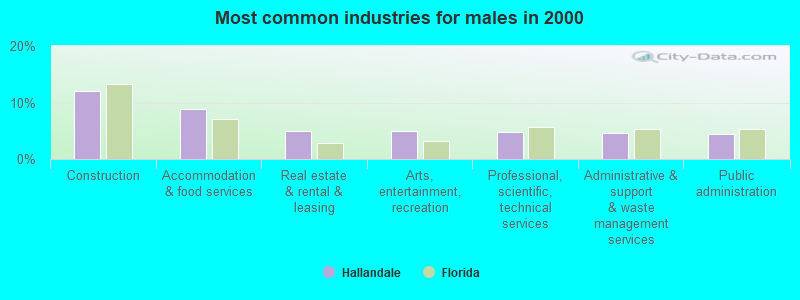
The most common industries in Hallandale are: Accommodation & food services (9.6% of civilian employees), Health care (7.6% of civilian employees), Construction (7.1% of civilian employees). 73.1% of workers are employees of private companies, which is 5.4% greater than the rate of 69.2% across the entire state of Florida.
Most common industries

Most common industries | |||
|---|---|---|---|
Industry | All | Males | Females |
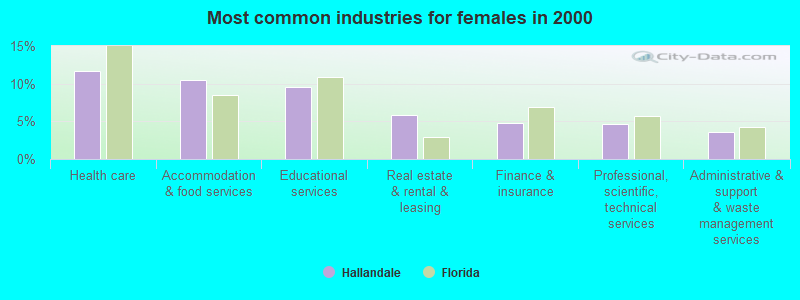
| Accommodation and food services | 9.6% (1,282) | 8.8% (608) | 10.5% (674) |
| Health care | 7.6% (1,019) | 3.9% (270) | 11.7% (749) |
| Construction | 7.1% (941) | 12.0% (835) | 1.7% (106) |
| Educational services | 6.7% (888) | 4.1% (281) | 9.5% (607) |
| Real estate and rental and leasing | 5.4% (717) | 4.9% (341) | 5.9% (376) |
| Professional, scientific, and technical services | 4.7% (628) | 4.8% (335) | 4.6% (293) |
| Finance and insurance | 4.1% (545) | 3.4% (237) | 4.8% (308) |
| Administrative and support and waste management services | 4.1% (544) | 4.6% (316) | 3.6% (228) |
| Public administration | 3.7% (491) | 4.3% (301) | 3.0% (190) |
| Food and beverage stores | 3.3% (434) | 3.1% (216) | 3.4% (218) |
| Arts, entertainment, and recreation | 3.1% (418) | 4.9% (339) | 1.2% (79) |
| Personal and laundry services | 2.8% (371) | 2.5% (176) | 3.1% (195) |
| Other transportation, and support activities, and couriers | 2.6% (348) | 3.2% (220) | 2.0% (128) |
| Department and other general merchandise stores | 2.2% (288) | 1.0% (71) | 3.4% (217) |
| Clothing and accessories, including shoe, stores | 2.0% (260) | 1.2% (82) | 2.8% (178) |
| Repair and maintenance | 1.8% (237) | 2.9% (200) | 0.6% (37) |
| Broadcasting and telecommunications | 1.7% (226) | 1.9% (130) | 1.5% (96) |
| Private households | 1.5% (196) | 0.3% (19) | 2.8% (177) |
| Social assistance | 1.4% (187) | 0.3% (24) | 2.6% (163) |
| Other direct selling establishments | 1.3% (170) | 1.2% (85) | 1.3% (85) |
| Air transportation | 1.2% (163) | 1.0% (71) | 1.4% (92) |
| Motor vehicle and parts dealers | 1.2% (157) | 2.0% (142) | 0.2% (15) |
| Truck transportation | 1.1% (150) | 1.9% (131) | 0.3% (19) |
| Used merchandise, gift, novelty, and souvenir, and other miscellaneous stores | 1.1% (143) | 0.6% (42) | 1.6% (101) |
| Miscellaneous manufacturing | 0.9% (118) | 1.0% (68) | 0.8% (50) |
| Sporting goods, camera, and hobby and toy stores | 0.8% (111) | 1.0% (68) | 0.7% (43) |
| Computer and electronic products | 0.8% (107) | 0.9% (65) | 0.7% (42) |
| Furniture and home furnishings, and household appliance stores | 0.8% (101) | 0.7% (48) | 0.8% (53) |
| Publishing, and motion picture and sound recording industries | 0.7% (99) | 1.1% (78) | 0.3% (21) |
| Radio, TV, and computer stores | 0.7% (98) | 1.1% (74) | 0.4% (24) |
| Miscellaneous nondurable goods merchant wholesalers | 0.7% (96) | 0.6% (39) | 0.9% (57) |
| Jewelry, luggage, and leather goods stores | 0.7% (91) | 0.4% (29) | 1.0% (62) |
| Miscellaneous durable goods merchant wholesalers | 0.7% (87) | 0.2% (12) | 1.2% (75) |
| Printing and related support activities | 0.6% (82) | 1.0% (71) | 0.2% (11) |
| Metal and metal products | 0.6% (80) | 0.8% (53) | 0.4% (27) |
| Professional and commercial equipment and supplies merchant wholesalers | 0.6% (78) | 0.8% (57) | 0.3% (21) |
| Groceries and related products merchant wholesalers | 0.6% (78) | 1.1% (73) | 0.1% (5) |
| U. S. Postal service | 0.6% (76) | 0.8% (58) | 0.3% (18) |
| Building material and garden equipment and supplies dealers | 0.5% (62) | 0.5% (37) | 0.4% (25) |
| Apparel, fabrics, and notions merchant wholesalers | 0.5% (62) | 0.2% (16) | 0.7% (46) |
| Water transportation | 0.4% (58) | 0.5% (38) | 0.3% (20) |
| Electronic shopping and mail-order houses | 0.4% (57) | 0.5% (37) | 0.3% (20) |
| Religious, grantmaking, civic, professional, and similar organizations | 0.4% (56) | 0.1% (10) | 0.7% (46) |
| Chemicals | 0.4% (55) | 0.8% (55) | 0.0% (0) |
| Machinery, equipment, and supplies merchant wholesalers | 0.4% (55) | 0.4% (29) | 0.4% (26) |
| Health and personal care, except drug, stores | 0.4% (54) | 0.5% (38) | 0.3% (16) |
| Motor vehicles, parts and supplies merchant wholesalers | 0.4% (52) | 0.3% (24) | 0.4% (28) |
| Plastics and rubber products | 0.4% (48) | 0.2% (15) | 0.5% (33) |
| Transportation equipment | 0.4% (47) | 0.5% (38) | 0.1% (9) |
| Drugs, sundries, and chemical and allied products merchant wholesalers | 0.3% (46) | 0.2% (15) | 0.5% (31) |
| Pharmacies and drug stores | 0.3% (46) | 0.1% (8) | 0.6% (38) |
| Furniture and home furnishing merchant wholesalers | 0.3% (46) | 0.1% (9) | 0.6% (37) |
| Food | 0.3% (40) | 0.3% (24) | 0.3% (16) |
| Textile mills and textile products | 0.3% (40) | 0.2% (15) | 0.4% (25) |
| Apparel | 0.2% (31) | 0.0% (0) | 0.5% (31) |
| Wood products | 0.2% (29) | 0.4% (29) | 0.0% (0) |
| Nonmetallic mineral products | 0.2% (28) | 0.4% (28) | 0.0% (0) |
| Paper | 0.2% (28) | 0.3% (19) | 0.1% (9) |
| Machinery | 0.2% (25) | 0.4% (25) | 0.0% (0) |
| Retail florists | 0.2% (23) | 0.2% (14) | 0.1% (9) |
| Office supplies and stationery stores | 0.2% (23) | 0.2% (15) | 0.1% (8) |
| Recyclable material merchant wholesalers | 0.2% (23) | 0.3% (23) | 0.0% (0) |
| Agriculture, forestry, fishing and hunting | 0.2% (23) | 0.2% (12) | 0.2% (11) |
| Furniture and related product manufacturing | 0.2% (21) | 0.1% (7) | 0.2% (14) |
| Lumber and other construction materials merchant wholesalers | 0.2% (20) | 0.3% (20) | 0.0% (0) |
| Beverage and tobacco products | 0.1% (18) | 0.2% (12) | 0.1% (6) |
| Electrical equipment, appliances, and components | 0.1% (18) | 0.3% (18) | 0.0% (0) |
| Gasoline stations | 0.1% (16) | 0.2% (16) | 0.0% (0) |
| Alcoholic beverages merchant wholesalers | 0.1% (14) | 0.1% (7) | 0.1% (7) |
| Warehousing and storage | 0.1% (8) | 0.1% (8) | 0.0% (0) |
Unemployment in Hallandale
- Unemployment by race in 2000
- Unemployment rate for White non-Hispanic residents
- 6.4%Males
- 6.2%Females
- Unemployment rate for Black residents
- 13.5%Males
- 8.5%Females
- Unemployment rate for Asian residents
- 6.9%Males
- Unemployment rate for other race residents
- 8.9%Females
- Unemployment rate for two or more race residents
- 7.1%Males
- Unemployment rate for Hispanic or Latino residents
- 4.6%Males
- 9.3%Females
Time leaving home to go to work

<5am:
| Hallandale: | 2.6% (331) |
| Florida: | 2.8% (195,491) |
5:30am:
| Hallandale: | 2.0% (259) |
| Florida: | 2.4% (162,873) |
6am:
| Hallandale: | 3.3% (423) |
| Florida: | 3.6% (247,678) |
6:30am:
| Hallandale: | 5.9% (765) |
| Florida: | 8.2% (569,201) |
7am:
| Hallandale: | 8.9% (1,159) |
| Florida: | 10.4% (720,998) |
7:30am:
| Hallandale: | 13.7% (1,777) |
| Florida: | 15.4% (1,063,673) |
8am:
| Hallandale: | 14.2% (1,837) |
| Florida: | 15.1% (1,046,414) |
8:30am:
| Hallandale: | 12.8% (1,659) |
| Florida: | 11.8% (812,057) |
9am:
| Hallandale: | 6.7% (874) |
| Florida: | 5.6% (388,700) |
10am:
| Hallandale: | 10.0% (1,291) |
| Florida: | 6.1% (419,450) |
11am:
| Hallandale: | 3.7% (483) |
| Florida: | 2.4% (167,860) |
12pm:
| Hallandale: | 1.8% (229) |
| Florida: | 1.1% (77,065) |
4pm:
| Hallandale: | 5.7% (740) |
| Florida: | 6.0% (413,569) |
>4pm:
| Hallandale: | 5.6% (724) |
| Florida: | 6.0% (418,050) |
Travel time to work
Daytime population change due to commuting: -1,197 (-3.5%)
Workers who live and work in this city: 2,202 (17.0%)
Workers who live and work in this city: 2,202 (17.0%)


Less than 5 minutes:
| Hallandale: | 0.8% (100) |
| Florida: | 2.3% (155,487) |
5 to 9 minutes:
| Hallandale: | 8.0% (1,041) |
| Florida: | 8.6% (595,769) |
10 to 14 minutes:
| Hallandale: | 14.6% (1,896) |
| Florida: | 13.3% (922,343) |
15 to 19 minutes:
| Hallandale: | 15.0% (1,938) |
| Florida: | 15.7% (1,085,636) |
20 to 24 minutes:
| Hallandale: | 12.6% (1,629) |
| Florida: | 15.1% (1,040,084) |
25 to 29 minutes:
| Hallandale: | 6.0% (784) |
| Florida: | 5.9% (404,902) |
30 to 34 minutes:
| Hallandale: | 16.2% (2,096) |
| Florida: | 15.6% (1,078,082) |
35 to 39 minutes:
| Hallandale: | 3.0% (385) |
| Florida: | 2.6% (182,138) |
40 to 44 minutes:
| Hallandale: | 3.8% (489) |
| Florida: | 3.4% (237,660) |
45 to 59 minutes:
| Hallandale: | 8.5% (1,105) |
| Florida: | 7.7% (534,237) |
60 to 89 minutes:
| Hallandale: | 5.9% (765) |
| Florida: | 4.4% (303,002) |
90 or more minutes:
| Hallandale: | 2.5% (323) |
| Florida: | 2.4% (163,739) |
Means of transportation to work

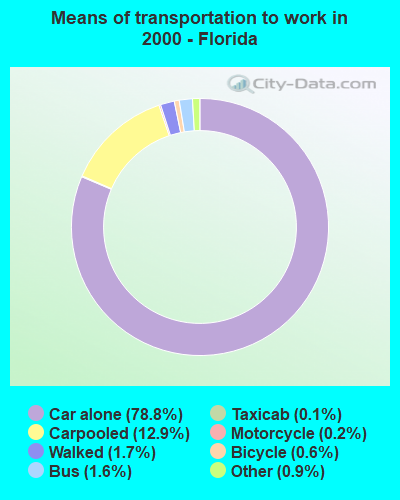
Drove car alone:
| Hallandale: | 76.6% (9,927) |
| Florida: | 78.8% (5,445,527) |
Carpooled:
| Hallandale: | 11.6% (1,502) |
| Florida: | 12.9% (893,766) |
Bus or trolley bus:
| Hallandale: | 4.1% (529) |
| Florida: | 1.6% (108,340) |
Taxicab:
| Hallandale: | 0.2% (22) |
| Florida: | 0.1% (8,708) |
Motorcycle:
| Hallandale: | 0.1% (17) |
| Florida: | 0.2% (14,967) |
Bicycle:
| Hallandale: | 0.4% (54) |
| Florida: | 0.6% (39,294) |
Walked:
| Hallandale: | 2.8% (357) |
| Florida: | 1.7% (118,386) |
Other means:
| Hallandale: | 1.1% (143) |
| Florida: | 0.9% (62,064) |
Private vehicle occupancy

Drove alone:
| Hallandale: | 86.9% (9,927) |
| Florida: | 85.9% (5,445,527) |
In 2 person carpool:
| Hallandale: | 10.3% (1,182) |
| Florida: | 11.0% (698,577) |
In 3 person carpool:
| Hallandale: | 2.0% (224) |
| Florida: | 1.9% (117,465) |
In 4 person carpool:
| Hallandale: | 0.6% (70) |
| Florida: | 0.7% (42,034) |
In 5-6 person carpool:
| Hallandale: | 0.2% (26) |
| Florida: | 0.3% (22,177) |
Class of workers
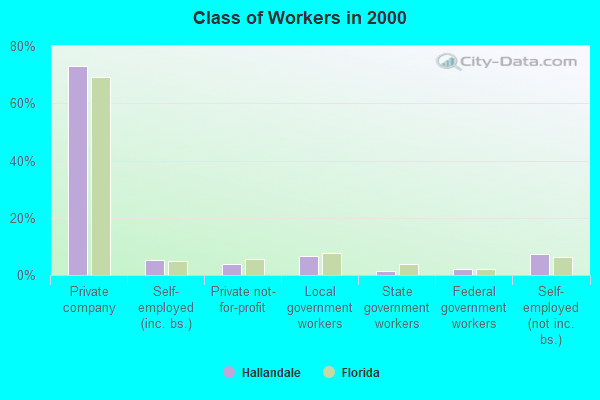
Employee of private company:
| Hallandale: | 73.1% (9,750) |
| Florida: | 69.2% (4,840,105) |
Self-employed in own incorporated business:
| Hallandale: | 5.3% (707) |
| Florida: | 4.9% (343,812) |
Private not-for-profit wage and salary workers:
| Hallandale: | 3.8% (512) |
| Florida: | 5.7% (395,397) |
Local government workers:
| Hallandale: | 6.6% (875) |
| Florida: | 7.7% (542,086) |
State government workers:
| Hallandale: | 1.5% (202) |
| Florida: | 3.7% (261,182) |
Federal government workers:
| Hallandale: | 2.0% (260) |
| Florida: | 2.2% (157,343) |
Self-employed workers in own not incorporated business:
| Hallandale: | 7.4% (985) |
| Florida: | 6.2% (435,619) |
Unpaid family workers:
| Hallandale: | 0.3% (38) |
| Florida: | 0.3% (19,503) |

Employee of private company - Males:
| Hallandale: | 73.6% (5,107) |
| Florida: | 70.4% (2,619,497) |
Self-employed in own incorporated business - Males:
| Hallandale: | 7.4% (512) |
| Florida: | 6.7% (249,173) |
Private not-for-profit wage and salary workers - Males:
| Hallandale: | 2.3% (160) |
| Florida: | 3.5% (131,238) |
Local government workers - Males:
| Hallandale: | 5.7% (396) |
| Florida: | 6.2% (229,948) |
State government workers - Males:
| Hallandale: | 1.2% (84) |
| Florida: | 3.0% (112,661) |
Federal government workers - Males:
| Hallandale: | 2.1% (149) |
| Florida: | 2.5% (92,242) |
Self-employed workers in own not incorporated business - Males:
| Hallandale: | 7.4% (511) |
| Florida: | 7.4% (276,378) |
Unpaid family workers - Males:
| Hallandale: | 0.3% (18) |
| Florida: | 0.2% (8,135) |

Employee of private company - Females:
| Hallandale: | 72.6% (4,643) |
| Florida: | 67.8% (2,220,608) |
Self-employed in own incorporated business - Females:
| Hallandale: | 3.1% (195) |
| Florida: | 2.9% (94,639) |
Private not-for-profit wage and salary workers - Females:
| Hallandale: | 5.5% (352) |
| Florida: | 8.1% (264,159) |
Local government workers - Females:
| Hallandale: | 7.5% (479) |
| Florida: | 9.5% (312,138) |
State government workers - Females:
| Hallandale: | 1.8% (118) |
| Florida: | 4.5% (148,521) |
Federal government workers - Females:
| Hallandale: | 1.7% (111) |
| Florida: | 2.0% (65,101) |
Self-employed workers in own not incorporated business - Females:
| Hallandale: | 7.4% (474) |
| Florida: | 4.9% (159,241) |
Unpaid family workers - Females:
| Hallandale: | 0.3% (20) |
| Florida: | 0.3% (11,368) |