Greater Newark, DE (Delaware) Houses and Residents
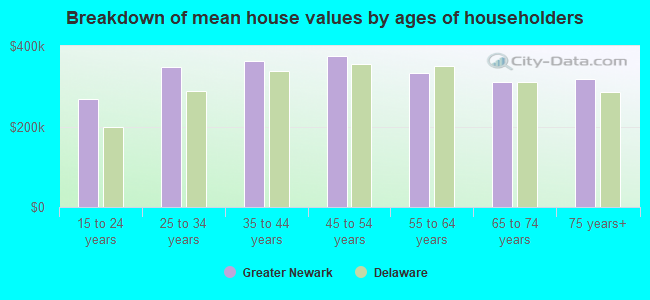
| Greater Newark: | $336,129 |
| Delaware: | $337,200 |
Total population: 70,573 (Urban population: 66,640, Rural population: 535 (all nonfarm))
Houses: 24,000 (23,140 occupied: 14,528 owner occupied, 8,612 renter occupied)
| % of renters here: | 37% |
| State: | 26% |
Housing density: 800 houses/condos per square mile
Median price asked for vacant for-sale houses and condos in 2022 in this county: $238,015.
Median contract rent in 2022: $1,217 (lower quartile is $1,006, upper quartile is $1,501)
Median rent asked for vacant for-rent units in 2022: $1,162
Median gross rent in Greater Newark, DE in 2022: $1,343
Housing units in Greater Newark with a mortgage: 10,798 (1,279 second mortgage, 1,637 home equity loan, 81 both second mortgage and home equity loan)
Houses without a mortgage: 2,728
Compare current foreclosures near Greater Newark, DE:
| Photo | Address | Area | Beds / Baths | Price | Details |
|---|---|---|---|---|---|

|
#1
N Norman Ave
Penns Grove, NJ 08069
|
882 sq. feet
|
1 baths 2 beds |
$74,900
|
show details |

|
#2
W Broadway
Salem, NJ 08079
|
2,869 sq. feet
|
2 baths 3 beds |
$90,900
|
show details |

|
#3
N Pine St
Wilmington, DE 19802
|
1,125 sq. feet
|
1 baths 3 beds |
$199,900
|
show details |

|
#4
Little John Cir
Avondale, PA 19311
|
2,668 sq. feet
|
2 baths 4 beds |
$389,391
|
show details |

|
#5
Barnsley Rd
Oxford, PA 19363
|
1,288 sq. feet
|
1 baths 3 beds |
$176,718
|
show details |

|
#6
S Guernsey Rd
West Grove, PA 19390
|
2,400 sq. feet
|
3 baths 6 beds |
$283,973
|
show details |

|
#7
Hazel Ave
Kennett Square, PA 19348
|
2,344 sq. feet
|
2 baths 3 beds |
$198,715
|
show details |

|
#8
Macduff Ct
Chadds Ford, PA 19317
|
1,796 sq. feet
|
2 baths 3 beds |
$215,884
|
show details |

|
#9
Media Rd
Oxford, PA 19363
|
1,155 sq. feet
|
1 baths 2 beds |
$211,938
|
show details |

|
#10
Township Rd
Lincoln University, PA 19352
|
1,596 sq. feet
|
1 baths 2 beds |
$273,125
|
show details |
| Photo | Address | Area | Beds / Baths | Price | Details |
|---|---|---|---|---|---|

|
#11
Birkdale Cir
Avondale, PA 19311
|
3,334 sq. feet
|
2 baths 4 beds |
$368,645
|
show details |

|
#12
Mimosa Cir
Kennett Square, PA 19348
|
2,024 sq. feet
|
2 baths 3 beds |
$500,493
|
show details |

|
#13
Conner Rd
Oxford, PA 19363
|
1,568 sq. feet
|
2 baths 3 beds |
$217,831
|
show details |

|
#14
Walnut Valley Rd
Chadds Ford, PA 19317
|
2,248 sq. feet
|
2 baths 3 beds |
$518,830
|
show details |

|
#15
Ewing Rd
Cochranville, PA 19330
|
3,110 sq. feet
|
1 baths 6 beds |
$471,404
|
show details |

|
#16
Flint Hill Rd
Landenberg, PA 19350
|
960 sq. feet
|
1 baths 2 beds |
$75,282
|
show details |

|
#17
Schoolview Ln
Oxford, PA 19363
|
3,504 sq. feet
|
2 baths 4 beds |
$346,389
|
show details |

|
#18
Quill Ct
Oxford, PA 19363
|
2,454 sq. feet
|
2 baths 3 beds |
$291,550
|
show details |

|
#19
Elkdale Rd
Lincoln University, PA 19352
|
1,895 sq. feet
|
1 baths 3 beds |
$58,117
|
show details |

|
#20
Briarcliff Cir
West Grove, PA 19390
|
3,423 sq. feet
|
2 baths 4 beds |
$337,610
|
show details |
| Photo | Address | Area | Beds / Baths | Price | Details |
|---|---|---|---|---|---|

|
#21
Crestview Rd
Landenberg, PA 19350
|
1,120 sq. feet
|
1 baths 3 beds |
$115,034
|
show details |

|
#22
Gap Newport Pike
Avondale, PA 19311
|
1,094 sq. feet
|
1 baths 3 beds |
$10,236
|
show details |

|
#23
Bonnie Marie Ln
Elkton, MD 21921
|
2,779 sq. feet
|
2 baths 4 beds |
show details | |

|
#24
Lavender Ct
Lincoln University, PA 19352
|
- sq. feet
|
3 baths 4 beds |
show details | |

|
#25
Seton Dr
Wilmington, DE 19809
|
2,100 sq. feet
|
3 baths 4 beds |
show details | |

|
#26
Taft Ave
Penns Grove, NJ 08069
|
1,030 sq. feet
|
1 baths 2 beds |
show details | |

|
#27
Saint Augustine Rd
Middletown, DE 19709
|
1,125 sq. feet
|
2 baths 3 beds |
show details | |

|
#28
Cove Rd
Penns Grove, NJ 08069
|
1,266 sq. feet
|
1 baths 3 beds |
show details | |

|
#29
Montgomery Rd
Wilmington, DE 19805
|
250 sq. feet
|
1 baths 4 beds |
show details | |

|
#30
S 4th St
Oxford, PA 19363
|
- sq. feet
|
2 baths 3 beds |
show details |
| Photo | Address | Area | Beds / Baths | Price | Details |
|---|---|---|---|---|---|

|
#31
Tarcote Ct
Newark, DE 19702
|
1,575 sq. feet
|
1 baths 3 beds |
show details | |

|
#32
Washington Ave
Wilmington, DE 19805
|
850 sq. feet
|
1 baths 3 beds |
show details | |

|
#33
Forrest Ave # 12
Wilmington, DE 19805
|
1,625 sq. feet
|
1 baths 4 beds |
show details | |

|
#34
Kirkwood St
Wilmington, DE 19801
|
1,375 sq. feet
|
1 baths 3 beds |
show details | |

|
#35
Odessa Way
Newark, DE 19711
|
2,699 sq. feet
|
2 baths 4 beds |
show details | |

|
#36
Jefferson Ave
New Castle, DE 19720
|
1,152 sq. feet
|
1 baths 3 beds |
show details | |

|
#37
Maple Ave
Pennsville, NJ 08070
|
1,143 sq. feet
|
1 baths 3 beds |
show details | |

|
#38
Stephenson Dr
Wilmington, DE 19808
|
- sq. feet
|
2 baths 5 beds |
show details | |

|
#39
Elkdale Rd
Lincoln University, PA 19352
|
1,895 sq. feet
|
1 baths 3 beds |
show details | |

|
#40
E Mccaulley Ct
Wilmington, DE 19801
|
1,900 sq. feet
|
1 baths 3 beds |
show details |
| Photo | Address | Area | Beds / Baths | Price | Details |
|---|---|---|---|---|---|

|
#41
Greybull Dr
Bear, DE 19701
|
2,075 sq. feet
|
2 baths 3 beds |
show details | |

|
#42
Barclay Dr
Pennsville, NJ 08070
|
1,698 sq. feet
|
1 baths 4 beds |
show details | |

|
#43
Rossini Ln
Middletown, DE 19709
|
- sq. feet
|
2 baths 3 beds |
show details | |

|
#44
Cabot Dr
Hockessin, DE 19707
|
2,300 sq. feet
|
2 baths 4 beds |
show details | |

|
#45
Sanford Rd
Pennsville, NJ 08070
|
1,188 sq. feet
|
1 baths 3 beds |
show details | |

|
#46
Rosewood Dr
Newark, DE 19713
|
1,225 sq. feet
|
1 baths 3 beds |
show details | |

|
#47
N Augustine St
Wilmington, DE 19804
|
1,550 sq. feet
|
2 baths 3 beds |
show details | |

|
#48
Rosemont Dr
Wilmington, DE 19804
|
1,350 sq. feet
|
1 baths 3 beds |
show details | |

|
#49
Blanca Ct
West Grove, PA 19390
|
4,300 sq. feet
|
2 baths 4 beds |
show details | |

|
Check over 1 million property listings on Foreclosure.com!
|
browse all offers | |||

Household type by relationship:
Households: 521,325- In family households: 432,579 (87,243 male householders, 47,500 female householders)
94,343 spouses, 154,234 children (144,377 natural, 3,150 adopted, 6,707 stepchildren), 13,869 grandchildren, 5,731 brothers or sisters, 5,248 parents, foster children, 7,594 other relatives, 13,545 non-relatives
- In nonfamily households: 88,746 (30,762 male householders (22,487 living alone)), 37,146 female householders (30,500 living alone)), 20,838 nonrelatives
- In group quarters: 17,154 (7,943 institutionalized population)
79,448 married couples with children.
31,255 single-parent households (6,358 men, 24,897 women).
88.0% of residents of Greater Newark speak English at home.
5.1% of residents speak Spanish at home (46% speak English very well, 20% speak English well, 21% speak English not well, 12% don't speak English at all).
3.6% of residents speak other Indo-European language at home (77% speak English very well, 18% speak English well, 5% speak English not well, 1% don't speak English at all).
2.7% of residents speak Asian or Pacific Island language at home (58% speak English very well, 24% speak English well, 12% speak English not well, 6% don't speak English at all).
0.6% of residents speak other language at home (70% speak English very well, 24% speak English well, 6% speak English not well).
Foreign born population: 11,651 (15.1%)
(44.0% of them are naturalized citizens)
| Here: | 7.2 |
| State: | 6.9 |
| Here: | 4.1 |
| State: | 4.4 |
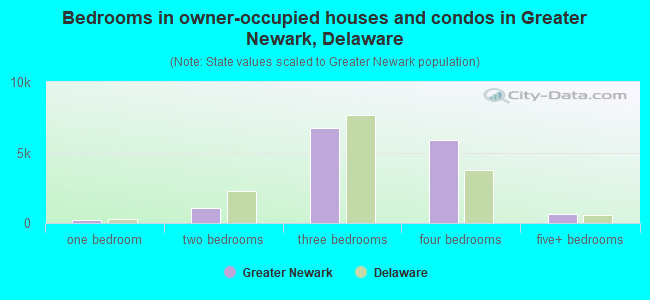
- Bedrooms in owner-occupied houses and condos in Greater Newark, Delaware
- 0no bedroom
- 2011 bedroom
- 1,0602 bedrooms
- 6,7463 bedrooms
- 5,8974 bedrooms
- 6245+ bedrooms
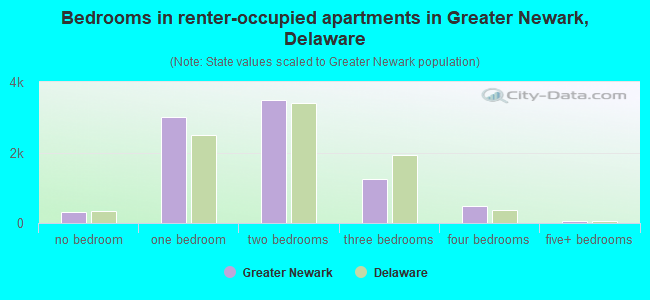
- Bedrooms in renter-occupied apartments in Greater Newark, Delaware
- 325no bedroom
- 3,0141 bedroom
- 3,4842 bedrooms
- 1,2563 bedrooms
- 4704 bedrooms
- 635+ bedrooms
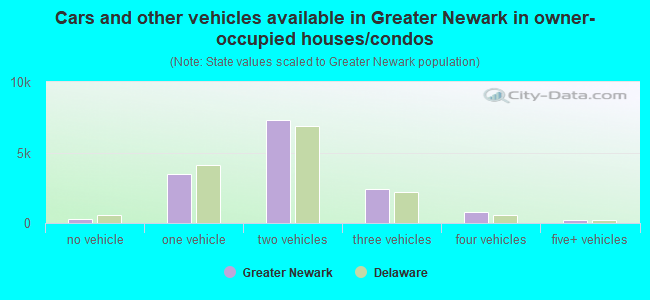
- Cars and other vehicles available in Greater Newark in owner-occupied houses/condos
- 299no vehicle
- 3,5081 vehicle
- 7,3322 vehicles
- 2,4413 vehicles
- 7574 vehicles
- 1915+ vehicles
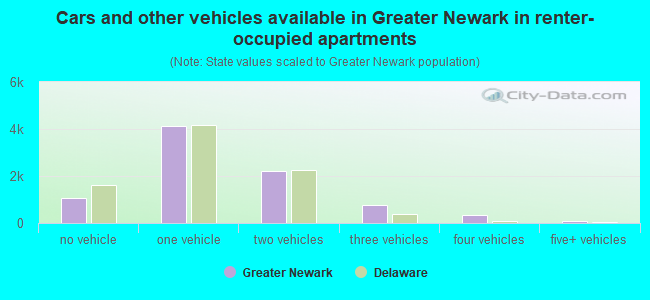
- Cars and other vehicles available in Greater Newark in renter-occupied apartments
- 1,067no vehicle
- 4,1361 vehicle
- 2,2162 vehicles
- 7733 vehicles
- 3504 vehicles
- 705+ vehicles
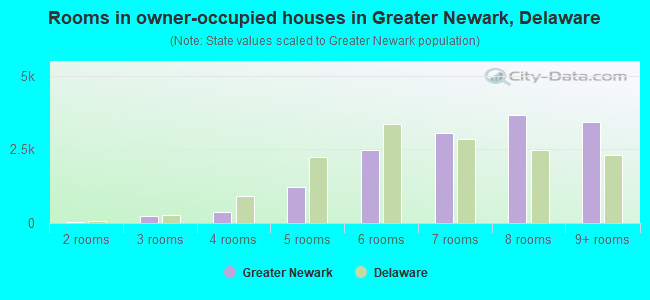
- Rooms in owner-occupied houses in Greater Newark, Delaware
- 01 room
- 212 rooms
- 2373 rooms
- 3824 rooms
- 1,2295 rooms
- 2,4976 rooms
- 3,0447 rooms
- 3,6718 rooms
- 3,4479+ rooms
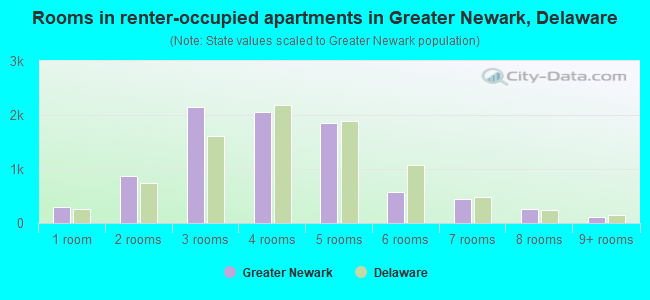
- Rooms in renter-occupied apartments in Greater Newark, Delaware
- 3011 room
- 8672 rooms
- 2,1533 rooms
- 2,0494 rooms
- 1,8545 rooms
- 5776 rooms
- 4457 rooms
- 2648 rooms
- 1029+ rooms
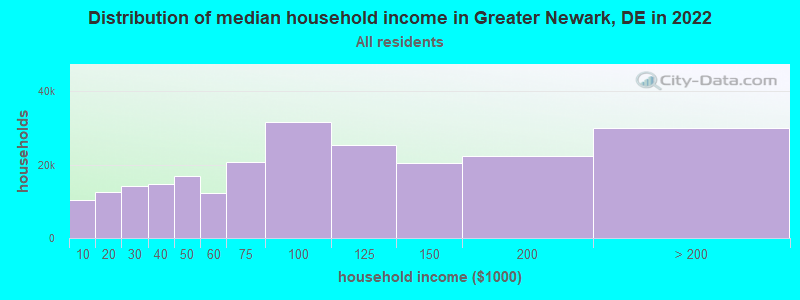
Greater Newark, DE household income distribution

- 10,307Less than $10,000
- 12,458$10,000 to $19,999
- 14,034$20,000 to $29,999
- 14,590$30,000 to $39,999
- 16,824$40,000 to $49,999
- 12,358$50,000 to $59,999
- 20,569$60,000 to $74,999
- 31,598$75,000 to $99,999
- 25,266$100,000 to $124,999
- 20,469$125,000 to $149,999
- 22,211$150,000 to $199,999
- 29,856$200,000 or more
Percentage of workers working in this county: 85.3%
Number of people working at home: 7,341 (17.8% of all workers)
Travel time to work (commute)
- Less than 5 minutes: 761
- 5 to 9 minutes: 3,792
- 10 to 14 minutes: 5,634
- 15 to 19 minutes: 5,800
- 20 to 24 minutes: 5,555
- 25 to 29 minutes: 2,419
- 30 to 34 minutes: 4,210
- 35 to 39 minutes: 759
- 40 to 44 minutes: 965
- 45 to 59 minutes: 1,571
- 60 to 89 minutes: 1,254
- 90 or more minutes: 554
Means of transportation to work:
- Drove a car alone: 26,052 (76.3%)
- Carpooled: 3,490 (10.2%)
- Bus or trolley bus: 855 (2.5%)
- Subway or elevated: 12 (0.0%)
- Railroad: 143 (0.4%)
- Motorcycle: 68 (0.2%)
- Bicycle: 250 (0.7%)
- Walked: 2,194 (6.4%)
- Other means: 210 (0.6%)
- Worked at home: 888 (2.6%)
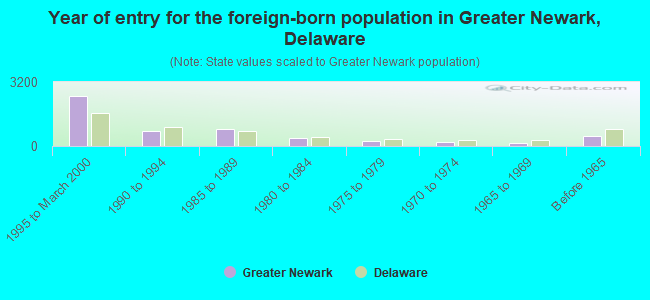
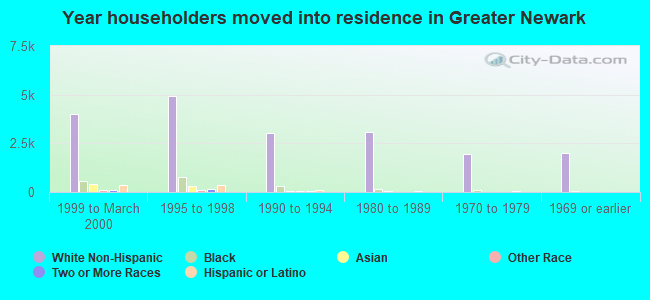
- Year of entry for the foreign-born population in Greater Newark, Delaware
- 2,4831995 to March 2000
- 7321990 to 1994
- 8341985 to 1989
- 4141980 to 1984
- 2321975 to 1979
- 2181970 to 1974
- 1341965 to 1969
- 499Before 1965
Most common places of birth for foreign-born residents (%):
| Greater Newark: | 23.9% (1,327) |
| Delaware: | 17.5% (7,846) |
| Greater Newark: | 13.8% (765) |
| Delaware: | 5.3% (2,392) |
| Greater Newark: | 6.6% (366) |
| Delaware: | 8.3% (3,736) |
| Greater Newark: | 4.6% (253) |
| Delaware: | 5.6% (2,521) |
| Greater Newark: | 4.4% (246) |
| Delaware: | 3.5% (1,577) |
| Greater Newark: | 2.8% (153) |
| Delaware: | 1.2% (517) |
| Greater Newark: | 2.7% (147) |
| Delaware: | 3.4% (1,544) |
| Greater Newark: | 2.5% (141) |
| Delaware: | 4.2% (1,901) |
| Greater Newark: | 2.2% (121) |
| Delaware: | 1.6% (720) |
| Greater Newark: | 2.0% (112) |
| Delaware: | 3.4% (1,507) |
| Greater Newark: | 1.8% (102) |
| Delaware: | 1.1% (477) |
| Greater Newark: | 1.8% (99) |
| Delaware: | 0.9% (408) |
| Greater Newark: | 1.7% (95) |
| Delaware: | 1.3% (598) |
| Greater Newark: | 1.7% (93) |
| Delaware: | 0.3% (125) |
| Greater Newark: | 1.6% (90) |
| Delaware: | 1.1% (502) |
| Greater Newark: | 1.5% (85) |
| Delaware: | 3.7% (1,682) |
Place of birth for U.S.-born residents:
- This state: 25,808
- Other state: 35,034
- Northeast: 21,721
- Midwest: 3,053
- South: 8,952
- West: 1,308
50% of Greater Newark residents lived in the same house 5 years ago.
Out of people who lived in different houses, 50% lived in this county.
Out of people who lived in different counties, 7% lived in Delaware.
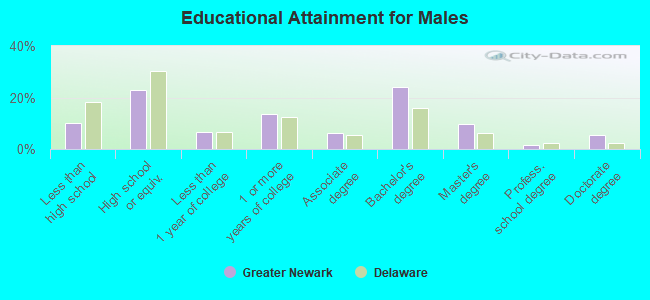
Education attainment for males 25 years and older:
- No schooling: 62
- Nursery to 4th grade: 38
- 5th and 6th grade: 167
- 7th and 8th grade: 256
- 9th grade: 237
- 10th grade: 283
- 11th grade: 353
- 12th grade, no diploma: 391
- High school graduate (or equivalency): 4,074
- Less than 1 year of college: 1,204
- Some college more than 1 year, no degree: 2,393
- Associate degree: 1,109
- Bachelor's degree: 4,282
- Master's degree: 1,715
- Professional school degree: 270
- Doctorate degree: 999
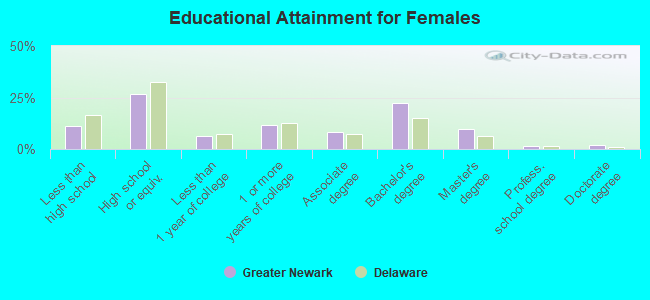
Education attainment for females 25 years and older:
- No schooling: 79
- Nursery to 4th grade: 20
- 5th and 6th grade: 151
- 7th and 8th grade: 364
- 9th grade: 261
- 10th grade: 402
- 11th grade: 379
- 12th grade, no diploma: 438
- High school graduate (or equivalency): 5,124
- Less than 1 year of college: 1,225
- Some college more than 1 year, no degree: 2,248
- Associate degree: 1,553
- Bachelor's degree: 4,256
- Master's degree: 1,852
- Professional school degree: 284
- Doctorate degree: 395
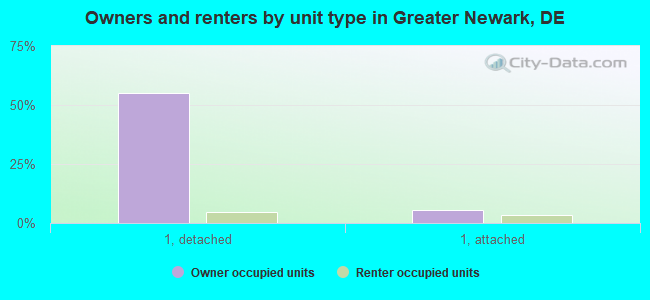
Housing units in structures:
- One, detached: 14,004
- One, attached: 2,215
- Two: 318
- 3 or 4: 745
- 5 to 9: 1,014
- 10 to 19: 3,774
- 20 to 49: 915
- 50 or more: 724
- Mobile homes: 291
Median worth of mobile homes: $36,545
Housing units lacking complete kitchen facilities: 0.3%
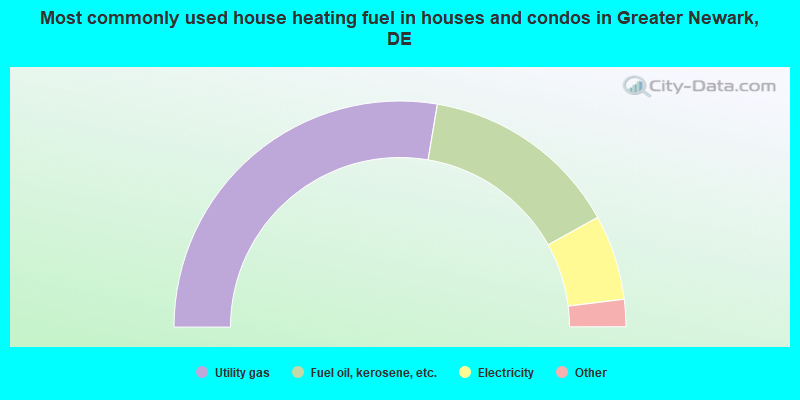
- 55.3%Utility gas
- 28.6%Fuel oil, kerosene, etc.
- 12.2%Electricity
- 3.7%Bottled, tank, or LP gas
- 0.1%Other fuel
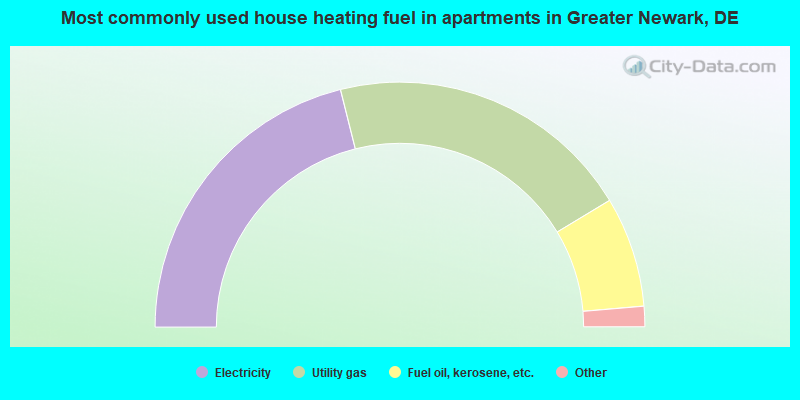
- 42.2%Electricity
- 40.5%Utility gas
- 14.6%Fuel oil, kerosene, etc.
- 2.0%Bottled, tank, or LP gas
- 0.6%Other fuel
- 0.2%No fuel used
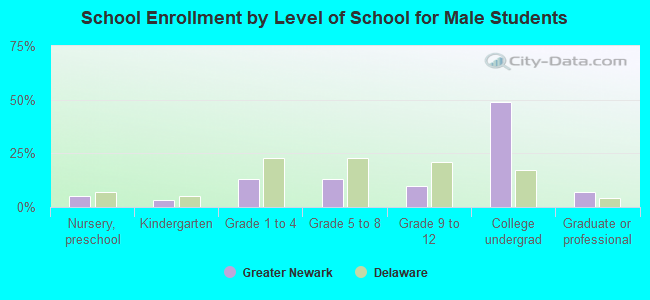
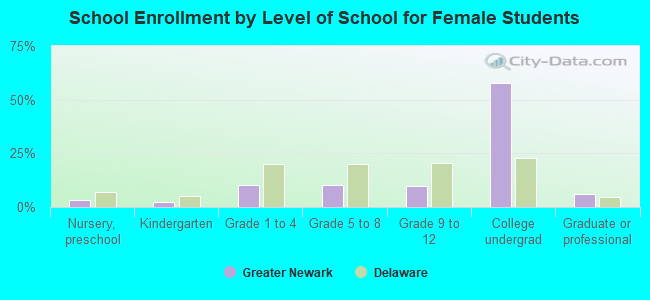
Private vs. public school enrollment:
| Here: | 24.2% |
| Delaware: | 17.8% |
| Here: | 20.2% |
| Delaware: | 14.0% |
| Here: | 14.3% |
| Delaware: | 21.4% |