Races in Greater Newark, Delaware (DE) Detailed Stats
Ancestries, Foreign-born residents, place of birth
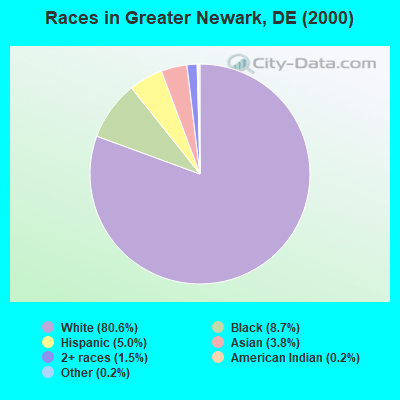
Race distribution in Greater Newark

- 54,06580.6%White alone
- 5,8448.7%Black alone
- 3,3885.0%Hispanic
- 2,5183.8%Asian alone
- 1,0351.5%Two or more races
- 1110.2%Other race alone
- 1200.2%American Indian alone
- 330.05%Native Hawaiian and Other
Pacific Islander alone
2000
2022
-
- 567,97372.5%White alone
- 148,43518.9%Black alone
- 37,2774.8%Hispanic
- 16,1102.1%Asian alone
- 10,2221.3%Two or more races
- 2,3240.3%American Indian alone
- 1,0250.1%Other race alone
- 2340.03%Native Hawaiian and Other
Pacific Islander alone

-
- 599,34758.9%White alone
- 220,01021.6%Black alone
- 105,30010.3%Hispanic
- 46,0164.5%Two or more races
- 41,3504.1%Asian alone
- 5,0970.5%Other race alone
- 1,2760.1%American Indian alone

Income and house value in Greater Newark
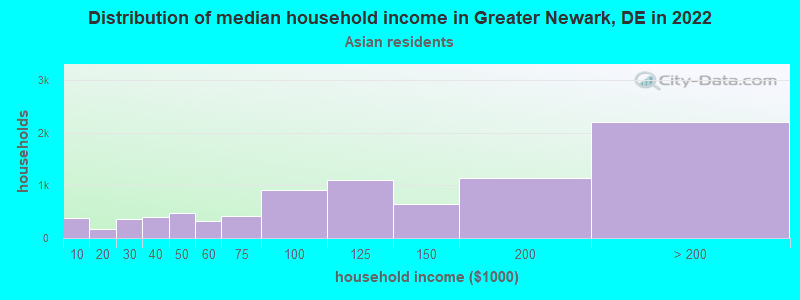
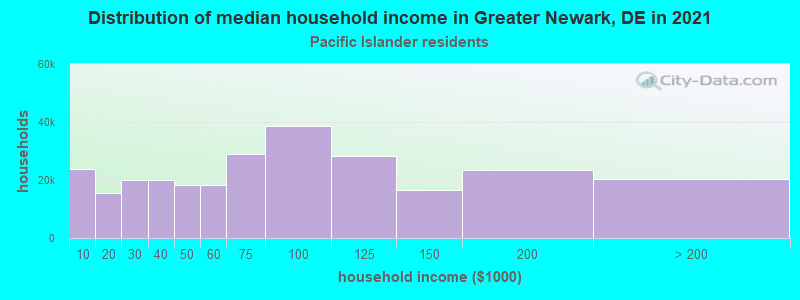
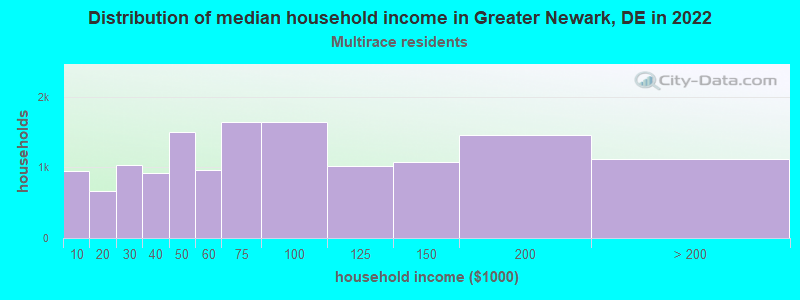
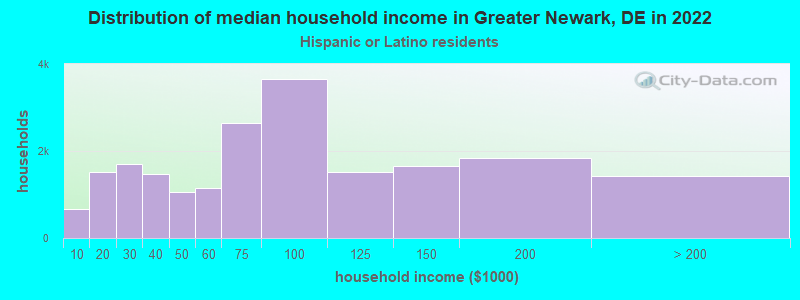
- Median household income in 2022
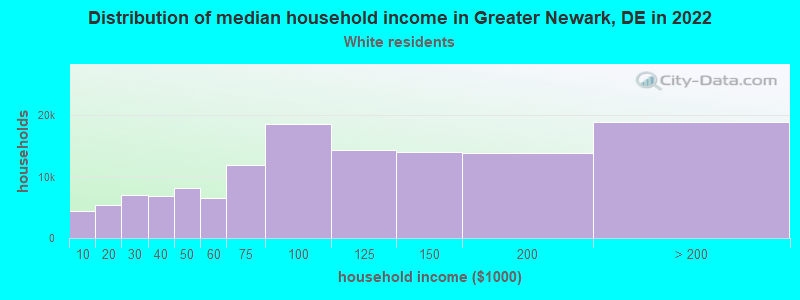
- $92,772White non-Hispanic householders
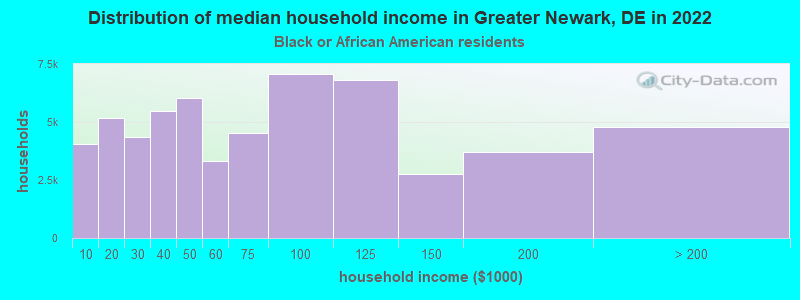
- $65,567Black householders
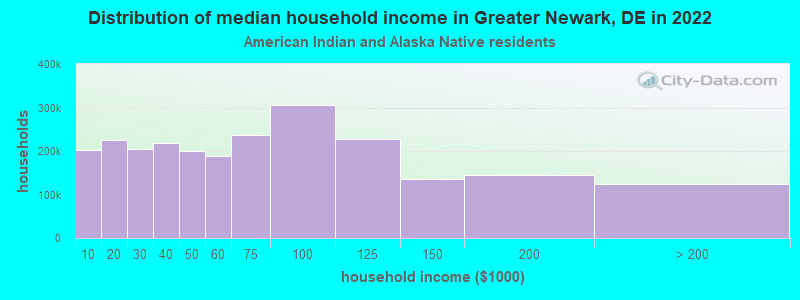
- $124,930American Indian and Alaska Native householders
- $75,789Asian householders
- $97,728Some other race householders
- $61,891Two or more races householders
- $81,300Hispanic or Latino race householders
- Median 2022 house value
- $340,610White Non-Hispanic householders
- $301,519Black or African American householders
- $560,214American Indian or Alaska Native householders
- $489,502Asian householders
- $342,353Native Hawaiian and other Pacific Islander householders
- $290,813Some other race householders
- $346,834Two or more races householders
- $293,303Hispanic or Latino householders
Household income for White non-Hispanic householders
Household income for Black householders
Household income for American Indian and Alaska Native householders
Household income for Asian householders
Household income for Native Hawaiian and other Pacific Islander householders
Household income for Two or more races householders
Household income for Hispanic or Latino race householders
Zip code: 19711