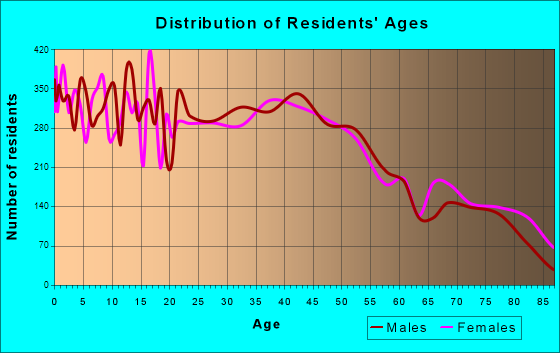
Grand Island, NE (Nebraska) Houses and Residents
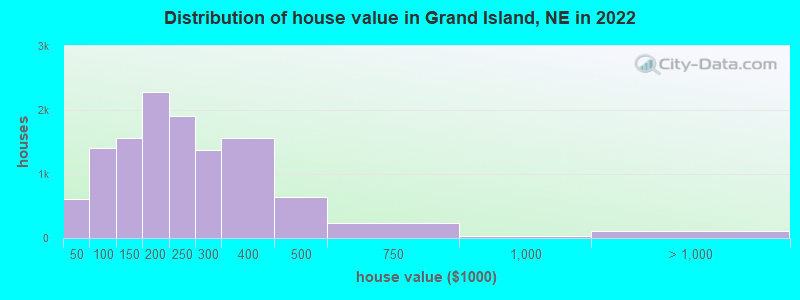
Estimated median house or condo value in 2022: $207,645 (it was $81,000 in 2000 )
Grand Island:
$207,645Nebraska:
$232,400
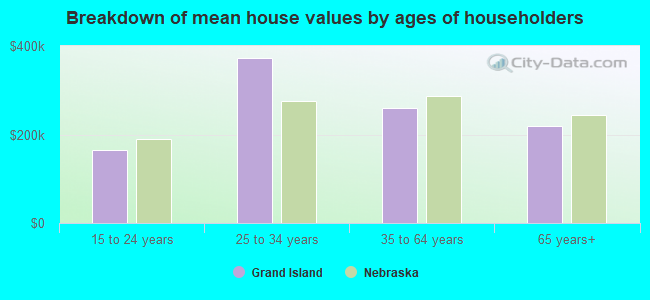
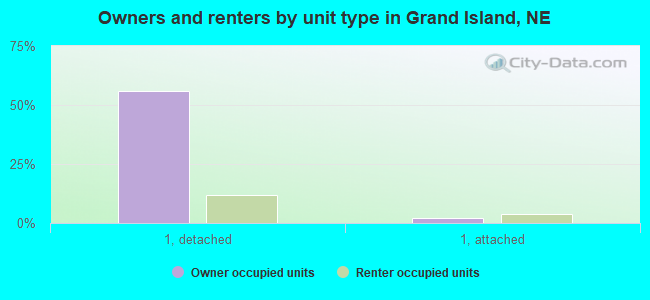
Lower value quartile - upper value quartile: $137,033 - $296,003Mean price in 2022: Detached houses: $215,047 Here:
$215,047State:
$274,677
Townhouses or other attached units: $238,512 Here:
$238,512State:
$245,619
In 2-unit structures: $285,887 Here:
$285,887State:
$168,724
In 5-or-more-unit structures: $122,901 Here:
$122,901State:
$476,911
Mobile homes: $21,858 Here:
$21,858State:
$67,339
Total population: 51,236 (Urban population: 42,585 (all inside urban clusters), Rural population: 234 (all nonfarm) )
Houses: 21,611 (20,640 occupied: 12,287 owner occupied, 8,674 renter occupied )
% of renters here:
41%State:
34%
Housing density: 1,007 houses/condos per square mile
Median price asked for vacant for-sale houses and condos in 2022: $142,915.
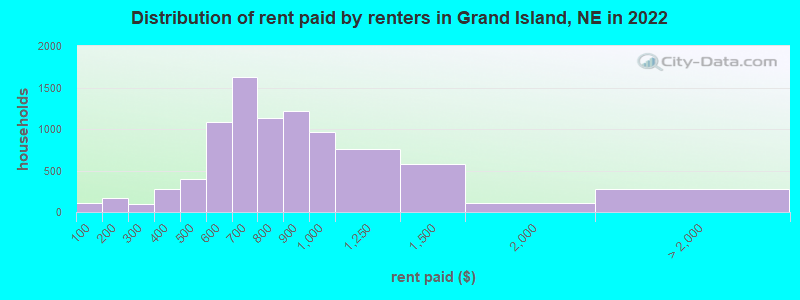
Median contract rent in 2022: $742 (lower quartile is $605, upper quartile is $931)
Median rent asked for vacant for-rent units in 2022: $924
Median gross rent in Grand Island, NE in 2022: $882
Housing units in Grand Island with a mortgage: 6,662 (503 second mortgage, 2 home equity loan, 420 both second mortgage and home equity loan )Houses without a mortgage: 59
Median household income for houses/condos with a mortgage: $95,417
Median household income for apartments without a mortgage: $60,662
Median monthly housing costs: $936
Data:
Median house or condo value ($)
Median house or condo value ($ change since 2000)
Median house or condo value ($) - White
Median house or condo value ($) - Black or African American
Median house or condo value ($) - Asian
Median house or condo value ($) - Hispanic or Latino
Median house or condo value ($) - American Indian and Alaska Native
Median house or condo value ($) - Multirace
Median house or condo value ($) - Other Race
Median price asked for mobile homes ($)
Household density (households per square mile)
Mean house or condo value by units in structure - 1, detached ($)
Mean house or condo value by units in structure - 1, attached ($)
Mean house or condo value by units in structure - 2 ($)
Mean house or condo value by units in structure by units in structure - 3 or 4 ($)
Mean house or condo value by units in structure - 5 or more ($)
Mean house or condo value by units in structure - Boat, RV, van, etc. ($)
Mean house or condo value by units in structure - Mobile home ($)
Median contract rent ($)
Median contract rent - Lower quartile ($)
Median contract rent - Upper quartile ($)
Median gross rent ($)
Urban houses (%)
Rural houses (%)
Houses occupied (%)
Houses occupied (% change since 2000)
Houses owner occupied (%)
Houses owner occupied (% change since 2000)
Houses renter occupied (%)
Houses renter occupied (% change since 2000)
Vacant housing units - For rent (%)
Vacant housing units - For rent (% change since 2000)
Vacant housing units - For sale only (%)
Vacant housing units - For sale only (% change since 2000)
Vacant housing units - Rented or sold, not occupied (%)
Vacant housing units - Rented or sold, not occupied (% change since 2000)
Vacant housing units - For seasonal, recreational, or occasional use (%)
Vacant housing units - For seasonal, recreational, or occasional use (% change since 2000)
Vacant housing units - For migrant workers (%)
Vacant housing units - For migrant workers (% change since 2000)
Vacant housing units - Other vacant (%)
Vacant housing units - Other vacant (% change since 2000)
Median monthly housing costs ($)
Median household income for houses/condos with a mortgage ($)
Median household income for houses/condos without a mortgage ($)
Median household income ($)
Median household income ($) - White
Median household income ($) - Black or African American
Median household income ($) - Asian
Median household income ($) - Hispanic or Latino
Median household income ($) - American Indian and Alaska Native
Median household income ($) - Multirace
Median household income ($) - Other Race
Mortgage status - with mortgage (%)
Mortgage status - with second mortgage (%)
Mortgage status - with home equity loan (%)
Mortgage status - with both second mortgage and home equity loan (%)
Mortgage status - without a mortgage (%)
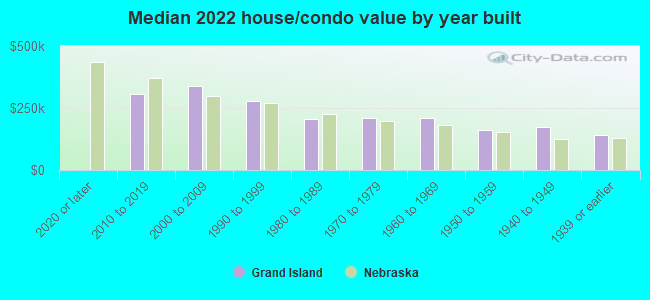
Median year house/condo built
Median year apartment built
Household type by relationship - Male householder living alone (%)
Household type by relationship - Male householder not living alone (%)
Household type by relationship - Female householder living alone (%)
Household type by relationship - Female householder not living alone (%)
Household type by relationship - Opposite-Sex spouse (%)
Household type by relationship - Same-Sex spouse (%)
Household type by relationship - Opposite-Sex unmarried partner (%)
Household type by relationship - Same-Sex unmarried partner (%)
Household type by relationship - In group quarters (%)
Size of family households - 2-person household (%)
Size of family households - 3-person household (%)
Size of family households - 4-person household (%)
Size of family households - 5-person household (%)
Size of family households - 6-person household (%)
Size of family households - 7-or-more-person household (%)
Size of nonfamily households - 1-person household (%)
Size of nonfamily households - 2-person household (%)
Size of nonfamily households - 3-person household (%)
Size of nonfamily households - 4-person household (%)
Size of nonfamily households - 5-person household (%)
Size of nonfamily households - 6-person household (%)
Size of nonfamily households - 7-or-moreperson household (%)
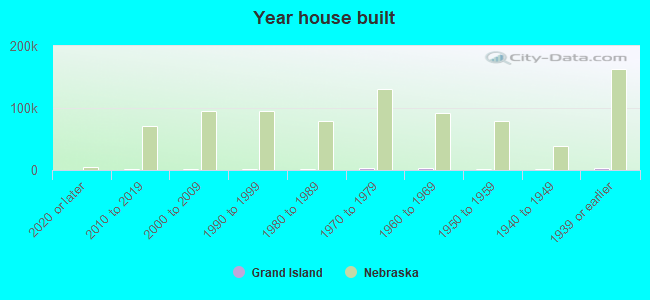
Year house built - Built 2010 or later (%)
Year house built - Built 2000 to 2009 (%)
Year house built - Built 1990 to 1999 (%)
Year house built - Built 1980 to 1989 (%)
Year house built - Built 1970 to 1979 (%)
Year house built - Built 1960 to 1969 (%)
Year house built - Built 1950 to 1959 (%)
Year house built - Built 1940 to 1949 (%)
Year house built - Built 1939 or earlier (%)
Median number of rooms in houses and condos
Median number of rooms in apartments
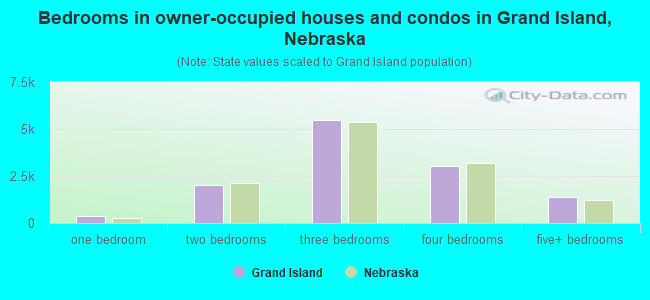
Median number of bedrooms in owner occupied houses
Mean number of bedrooms in owner occupied houses
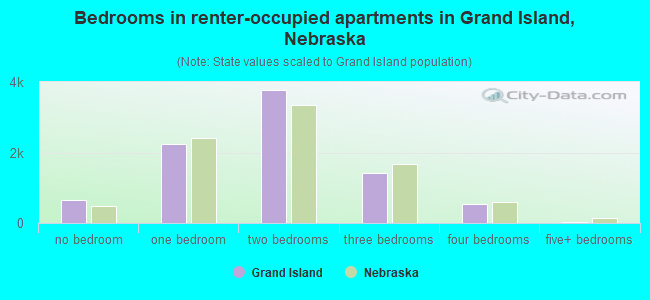
Median number of bedrooms in renter occupied houses
Mean number of bedrooms in renter occupied houses
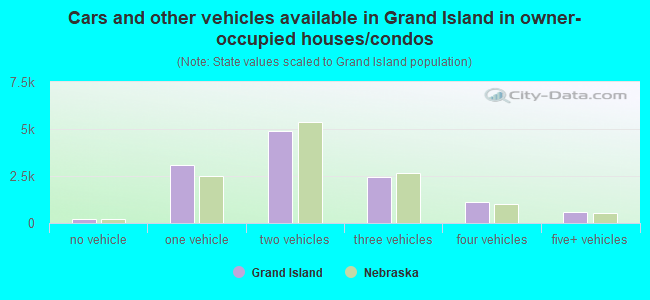
Median number of vehichles in owner occupied houses
Mean number of vehichles in owner occupied houses
Median number of vehichles in renter occupied houses
Mean number of vehichles in renter occupied houses
Rooms in owner-occupied houses - 1 room (%)
Rooms in owner-occupied houses - 2 rooms (%)
Rooms in owner-occupied houses - 3 rooms (%)
Rooms in owner-occupied houses - 4 rooms (%)
Rooms in owner-occupied houses - 5 rooms (%)
Rooms in owner-occupied houses - 6 rooms (%)
Rooms in owner-occupied houses - 7 rooms (%)
Rooms in owner-occupied houses - 8 rooms (%)
Rooms in owner-occupied houses - 9+ rooms (%)
Rooms in renter-occupied houses - 1 room (%)
Rooms in renter-occupied houses - 2 rooms (%)
Rooms in renter-occupied houses - 3 rooms (%)
Rooms in renter-occupied houses - 4 rooms (%)
Rooms in renter-occupied houses - 5 rooms (%)
Rooms in renter-occupied houses - 6 rooms (%)
Rooms in renter-occupied houses - 7 rooms (%)
Rooms in renter-occupied houses - 8 rooms (%)
Rooms in renter-occupied houses - 9+ rooms (%)
Bedrooms in owner-occupied houses - no bedrooms (%)
Bedrooms in owner-occupied houses - 1 bedroom (%)
Bedrooms in owner-occupied houses - 2 bedrooms (%)
Bedrooms in owner-occupied houses - 3 bedrooms (%)
Bedrooms in owner-occupied houses - 4 bedrooms (%)
Bedrooms in owner-occupied houses - 5+ bedrooms (%)
Bedrooms in renter-occupied houses - no bedrooms (%)
Bedrooms in renter-occupied houses - 1 bedroom (%)
Bedrooms in renter-occupied houses - 2 bedrooms (%)
Bedrooms in renter-occupied houses - 3 bedrooms (%)
Bedrooms in renter-occupied houses - 4 bedrooms (%)
Bedrooms in renter-occupied houses - 5+ bedrooms (%)
Vehicles available in owner-occupied houses - no vehicle available (%)
Vehicles available in owner-occupied houses - 1 vehicle available(%)
Vehicles available in owner-occupied houses - 2 Vehicles available (%)
Vehicles available in owner-occupied houses - 3 Vehicles available (%)
Vehicles available in owner-occupied houses - 4 Vehicles available (%)
Vehicles available in owner-occupied houses - 5+ Vehicles available (%)
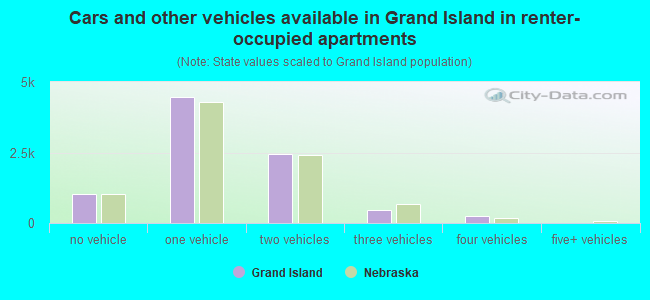
Vehicles available in renter-occupied houses - no vehicle available (%)
Vehicles available in renter-occupied houses - 1 vehicle available (%)
Vehicles available in renter-occupied houses - 2 Vehicles available (%)
Vehicles available in renter-occupied houses - 3 Vehicles available (%)
Vehicles available in renter-occupied houses - 4 Vehicles available (%)
Vehicles available in renter-occupied houses - 5+ Vehicles available (%)
Housing units in structures - 1, detached (%)
Housing units in structures - 1, attached (%)
Housing units in structures - 2 (%)
Housing units in structures - 3 or 4 (%)
Housing units in structures - 5 to 9 (%)
Housing units in structures - 10 to 19 (%)
Housing units in structures - 20 to 49 (%)
Housing units in structures - 50 or more (%)
Housing units in structures - Mobile home (%)
Housing units in structures - Boat, RV, van, etc. (%)
Housing units in structures - Owners - 1, detached (%)
Housing units in structures - Owners - 1, attached (%)
Housing units in structures - Owners - 2 (%)
Housing units in structures - Owners - 3 or 4 (%)
Housing units in structures - Owners - 5 to 9 (%)
Housing units in structures - Owners - 10 to 19 (%)
Housing units in structures - Owners - 20 to 49 (%)
Housing units in structures - Owners - 50 or more (%)
Housing units in structures - Owners - Mobile home (%)
Housing units in structures - Owners - Boat, RV, van, etc. (%)
Housing units in structures - Renters - 1, detached (%)
Housing units in structures - Renters - 1, attached (%)
Housing units in structures - Renters - 2 (%)
Housing units in structures - Renters - 3 or 4 (%)
Housing units in structures - Renters - 5 to 9 (%)
Housing units in structures - Renters - 10 to 19 (%)
Housing units in structures - Renters - 20 to 49 (%)
Housing units in structures - Renters - 50 or more (%)
Housing units in structures - Renters - Mobile home (%)
Housing units in structures - Renters - Boat, RV, van, etc. (%)
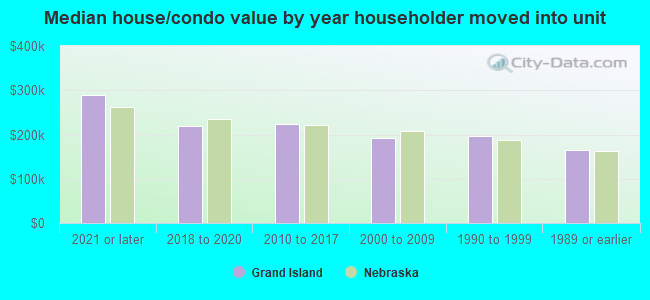
House/condo owner moved in on average (years ago)
Renter moved in on average (years ago)
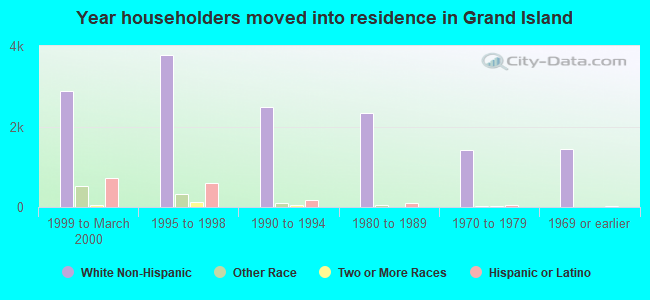
Year householder moved into unit - Moved in 1999 to March 2000 (%)
Year householder moved into unit - Moved in 1999 to March 2000 (%) - White
Year householder moved into unit - Moved in 1999 to March 2000 (%) - Black or African American
Year householder moved into unit - Moved in 1999 to March 2000 (%) - Asian
Year householder moved into unit - Moved in 1999 to March 2000 (%) - Hispanic or Latino
Year householder moved into unit - Moved in 1999 to March 2000 (%) - American Indian and Alaska Native
Year householder moved into unit - Moved in 1999 to March 2000 (%) - Multirace
Year householder moved into unit - Moved in 1999 to March 2000 (%) - Other Race
Year householder moved into unit - Moved in 1995 to 1998 (%)
Year householder moved into unit - Moved in 1995 to 1998 (%) - White
Year householder moved into unit - Moved in 1995 to 1998 (%) - Black or African American
Year householder moved into unit - Moved in 1995 to 1998 (%) - Asian
Year householder moved into unit - Moved in 1995 to 1998 (%) - Hispanic or Latino
Year householder moved into unit - Moved in 1995 to 1998 (%) - American Indian and Alaska Native
Year householder moved into unit - Moved in 1995 to 1998 (%) - Multirace
Year householder moved into unit - Moved in 1995 to 1998 (%) - Other Race
Year householder moved into unit - Moved in 1990 to 1994 (%)
Year householder moved into unit - Moved in 1990 to 1994 (%) - White
Year householder moved into unit - Moved in 1990 to 1994 (%) - Black or African American
Year householder moved into unit - Moved in 1990 to 1994 (%) - Asian
Year householder moved into unit - Moved in 1990 to 1994 (%) - Hispanic or Latino
Year householder moved into unit - Moved in 1990 to 1994 (%) - American Indian and Alaska Native
Year householder moved into unit - Moved in 1990 to 1994 (%) - Multirace
Year householder moved into unit - Moved in 1990 to 1994 (%) - Other Race
Year householder moved into unit - Moved in 1980 to 1989 (%)
Year householder moved into unit - Moved in 1980 to 1989 (%) - White
Year householder moved into unit - Moved in 1980 to 1989 (%) - Black or African American
Year householder moved into unit - Moved in 1980 to 1989 (%) - Asian
Year householder moved into unit - Moved in 1980 to 1989 (%) - Hispanic or Latino
Year householder moved into unit - Moved in 1980 to 1989 (%) - American Indian and Alaska Native
Year householder moved into unit - Moved in 1980 to 1989 (%) - Multirace
Year householder moved into unit - Moved in 1980 to 1989 (%) - Other Race
Year householder moved into unit - Moved in 1970 to 1979 (%)
Year householder moved into unit - Moved in 1970 to 1979 (%) - White
Year householder moved into unit - Moved in 1970 to 1979 (%) - Black or African American
Year householder moved into unit - Moved in 1970 to 1979 (%) - Asian
Year householder moved into unit - Moved in 1970 to 1979 (%) - Hispanic or Latino
Year householder moved into unit - Moved in 1970 to 1979 (%) - American Indian and Alaska Native
Year householder moved into unit - Moved in 1970 to 1979 (%) - Multirace
Year householder moved into unit - Moved in 1970 to 1979 (%) - Other Race
Year householder moved into unit - Moved in 1969 or earlier (%)
Year householder moved into unit - Moved in 1969 or earlier (%) - White
Year householder moved into unit - Moved in 1969 or earlier (%) - Black or African American
Year householder moved into unit - Moved in 1969 or earlier (%) - Asian
Year householder moved into unit - Moved in 1969 or earlier (%) - Hispanic or Latino
Year householder moved into unit - Moved in 1969 or earlier (%) - American Indian and Alaska Native
Year householder moved into unit - Moved in 1969 or earlier (%) - Multirace
Year householder moved into unit - Moved in 1969 or earlier (%) - Other Race
Housing units lacking complete plumbing facilities (%)
Housing units lacking complete kitchen facilities (%)
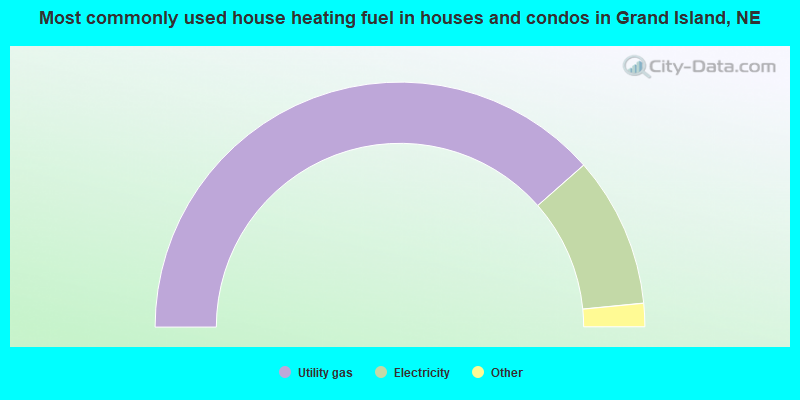
House heating fuel used in houses and condos - Utility gas (%)
House heating fuel used in houses and condos - Bottled, tank, or LP gas (%)
House heating fuel used in houses and condos - Electricity (%)
House heating fuel used in houses and condos - Fuel oil, kerosene, etc. (%)
House heating fuel used in houses and condos - Coal or coke (%)
House heating fuel used in houses and condos - Wood (%)
House heating fuel used in houses and condos - Solar energy (%)
House heating fuel used in houses and condos - Other fuel (%)
House heating fuel used in houses and condos - No fuel used (%)
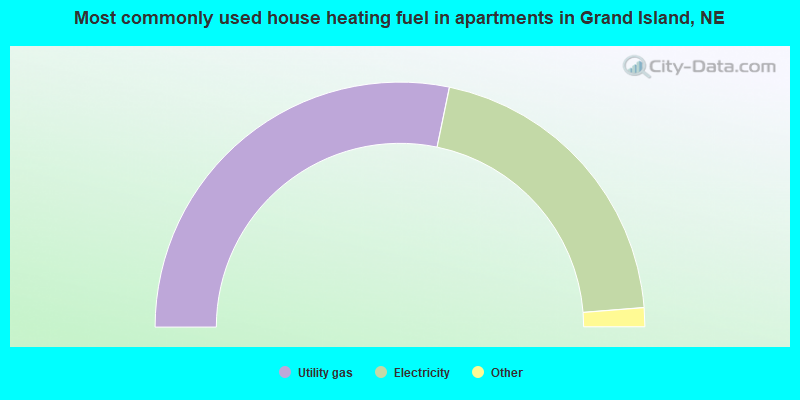
House heating fuel used in apartments - Utility gas (%)
House heating fuel used in apartments - Bottled, tank, or LP gas (%)
House heating fuel used in apartments - Electricity (%)
House heating fuel used in apartments - Fuel oil, kerosene, etc. (%)
House heating fuel used in apartments - Coal or coke (%)
House heating fuel used in apartments - Wood (%)
House heating fuel used in apartments - Solar energy (%)
House heating fuel used in apartments - Other fuel (%)
House heating fuel used in apartments - No fuel used (%)
Median year house/condo built: 1972Median year apartment built: 1979Household type by relationship:
Households: 53,064
Male householders: 9,814 (2,812 living alone ), Female householders: 10,541 (3,331 living alone )9,043 spouses (8,989 opposite-sex spouses ), 1,956 unmarried partners , (1,936 opposite-sex unmarried partners ), 16,981 children (16,040 natural , 208 adopted , 732 stepchildren ), 900 grandchildren , 503 brothers or sisters , 384 parents , 14 foster children , 550 other relatives , 1,490 non-relatives In group quarters: 883
Size of family households: 5,182 2-persons , 3,023 3-persons , 3,030 4-persons , 1,197 5-persons , 422 6-persons , 400 7-or-more-persons .
Size of nonfamily households: 6,484 1-person , 963 2-persons , 210 3-persons , 18 4-persons , 16 5-persons , 18 6-persons .
7,995 married couples with children. single-parent households (1,225 men , 4,388 women ).
72.5% of residents of Grand Island speak English at home. of residents speak Spanish at home (49% speak English very well , 14% speak English well , 18% speak English not well , 18% don't speak English at all ).of residents speak other Indo-European language at home (53% speak English very well , 47% speak English well ).of residents speak Asian or Pacific Island language at home (58% speak English very well , 20% speak English well , 10% speak English not well , 12% don't speak English at all ).of residents speak other language at home (23% speak English very well , 27% speak English well , 37% speak English not well , 13% don't speak English at all ).
Foreign born population: 8,680 (16.4%)of them are naturalized citizens )
Median number of rooms in houses and condos:
Median number of rooms in apartments
Owner-occupied Renter-occupied
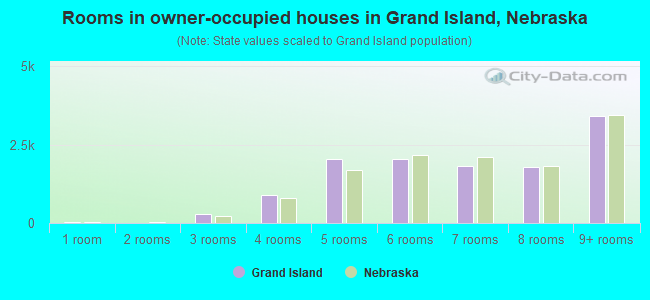
Rooms in owner-occupied houses in Grand Island, Nebraska
19 1 room 7 2 rooms 297 3 rooms 898 4 rooms 2,032 5 rooms 2,027 6 rooms 1,814 7 rooms 1,778 8 rooms 3,416 9+ rooms
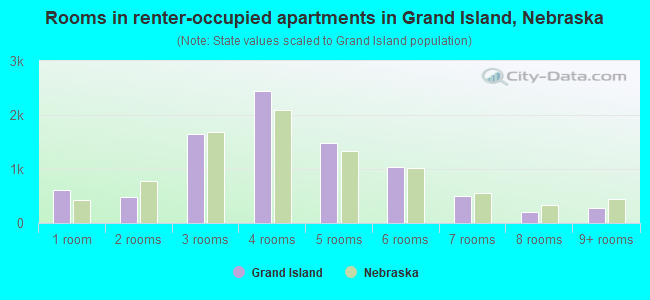
Rooms in renter-occupied apartments in Grand Island, Nebraska
604 1 room 482 2 rooms 1,653 3 rooms 2,442 4 rooms 1,481 5 rooms 1,040 6 rooms 493 7 rooms 201 8 rooms 277 9+ rooms
Grand Island, NE household income distribution 1,283 Less than $10,0001,780 $10,000 to $19,9991,845 $20,000 to $29,9991,828 $30,000 to $39,9992,127 $40,000 to $49,9992,099 $50,000 to $59,9992,317 $60,000 to $74,9992,635 $75,000 to $99,9992,169 $100,000 to $124,999952 $125,000 to $149,9991,074 $150,000 to $199,999937 $200,000 or more
Home value of owner - occupied houses in 2022 in Grand Island, NE 142 Less than $10,000136 $10,000 to $14,99948 $15,000 to $19,99934 $20,000 to $24,99960 $25,000 to $29,99949 $30,000 to $34,99966 $35,000 to $39,99976 $40,000 to $49,999195 $50,000 to $59,999164 $60,000 to $69,999269 $70,000 to $79,999436 $80,000 to $89,999264 $90,000 to $99,999860 $100,000 to $124,999696 $125,000 to $149,9991,151 $150,000 to $174,9991,127 $175,000 to $199,9991,909 $200,000 to $249,9991,382 $250,000 to $299,9991,563 $300,000 to $399,999647 $400,000 to $499,999238 $500,000 to $749,99938 $750,000 to $999,99924 $1,000,000 to $1,499,99987 $2,000,000 or moreRent paid by renters in 2022 in Grand Island, NE 114 Less than $100105 $100 to $14961 $150 to $19961 $200 to $24937 $250 to $299186 $300 to $34990 $350 to $39997 $400 to $449302 $450 to $499570 $500 to $549514 $550 to $599832 $600 to $649792 $650 to $699689 $700 to $749443 $750 to $7991,214 $800 to $899958 $900 to $999764 $1,000 to $1,249584 $1,250 to $1,499111 $1,500 to $1,99925 $3,000 to $3,4992 $3,500 or more246 No cash rent
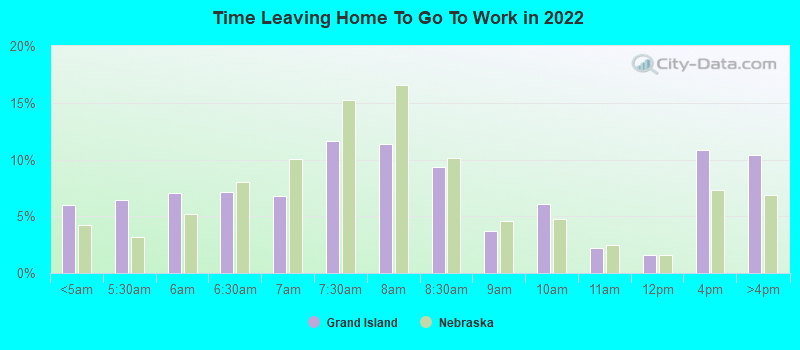
Percentage of workers working in this county: 90.3%Number of people working at home: 775 (3.0% of all workers )
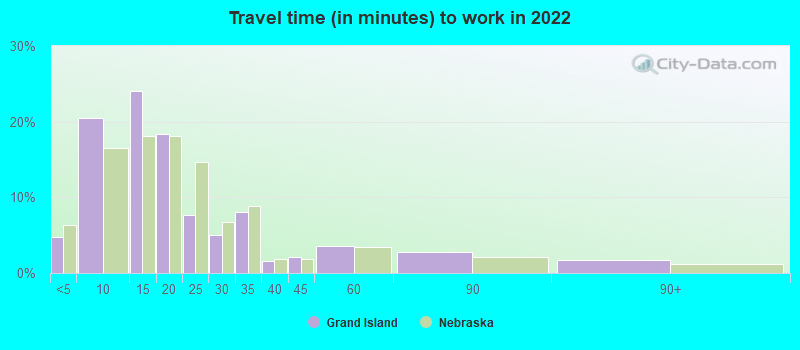
Travel time to work (commute)
Less than 5 minutes: 1,3835 to 9 minutes: 5,93610 to 14 minutes: 6,88215 to 19 minutes: 4,66820 to 24 minutes: 1,59925 to 29 minutes: 80230 to 34 minutes: 98035 to 39 minutes: 20340 to 44 minutes: 32045 to 59 minutes: 56760 to 89 minutes: 61390 or more minutes: 571
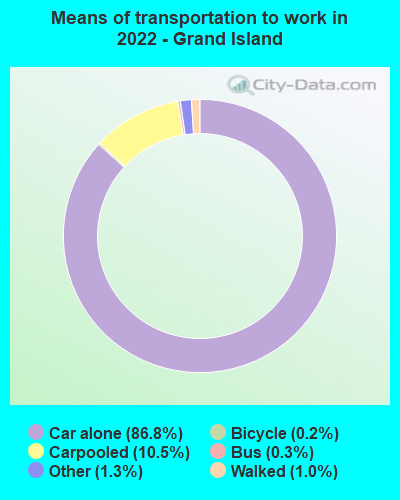
Means of transportation to work:
Drove a car alone: 25,516 (83.0%)Carpooled: 3,217 (10.5%)Bus : 63 (0.2%)Taxi: 398 (1.3%)Bicycle: 40 (0.1%)Walked: 285 (0.9%)Worked at home: 775 (2.5%)
Unemployment by race in 2022
Unemployment rate for White non-Hispanic residents 0.9% Males1.9% FemalesUnemployment rate for Black residents 35.5% Males13.9% FemalesUnemployment rate for American Indian and Alaska Native residents 7.8% FemalesUnemployment rate for other race residents 2.1% Males2.0% FemalesUnemployment rate for two or more race residents 2.4% FemalesUnemployment rate for Hispanic or Latino residents 1.2% Males2.7% Females
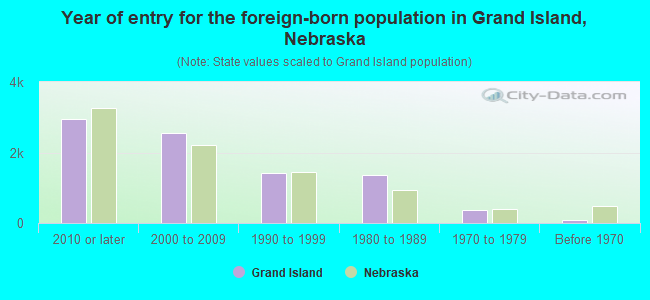
Year of entry for the foreign-born population in Grand Island, Nebraska
2,940 2010 or later 2,567 2000 to 2009 1,418 1990 to 1999 1,359 1980 to 1989 364 1970 to 1979 88 Before 1970
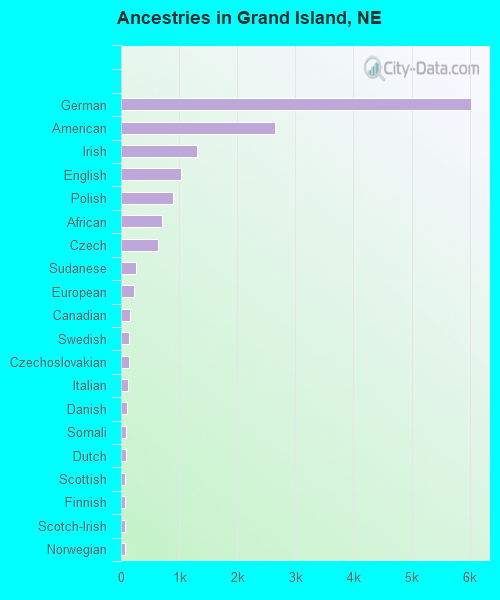
First ancestries reported:
German: 6,032 (19.9%)
American: 2,650 (8.7%)
Irish: 1,300 (4.3%)
English: 1,038 (3.4%)
Polish: 900 (3.0%)
African: 700 (2.3%)
Czech: 645 (2.1%)
Sudanese: 255 (0.8%)
European: 217 (0.7%)
Canadian: 155 (0.5%)
Swedish: 138 (0.5%)
Czechoslovakian: 132 (0.4%)
Italian: 116 (0.4%)
Danish: 106 (0.3%)
Somali: 84 (0.3%)
Dutch: 82 (0.3%)
Scottish: 75 (0.2%)
Finnish: 71 (0.2%)
Scotch-Irish: 70 (0.2%)
Norwegian: 61 (0.2%)
Eastern European: 40 (0.1%)
French: 33 (0.1%)
Welsh: 26 (0.09%)
Portuguese: 19 (0.06%)
French Canadian: 17 (0.06%)
Ethiopian: 13 (0.04%)
Scandinavian: 12 (0.04%)
Swiss: 12 (0.04%)
Northern European: 11 (0.04%)
Greek: 8 (0.03%)
Celtic: 7 (0.02%)
Lebanese: 6 (0.02%)
Romanian: 6 (0.02%)
British: 4 (0.01%) Most common places of birth for foreign-born residents (%): Mexico Grand Island:
31.9% (2,907)Nebraska:
31.7% (46,610)
Guatemala Grand Island:
26.6% (2,429)Nebraska:
7.2% (10,604)
Cuba Grand Island:
12.1% (1,101)Nebraska:
2.4% (3,517)
El Salvador Grand Island:
8.1% (741)Nebraska:
3.7% (5,421)
Sudan Grand Island:
3.7% (338)Nebraska:
1.7% (2,482)
Venezuela Grand Island:
3.4% (307)Nebraska:
0.7% (1,086)
Africa, n.e.c. Grand Island:
2.8% (253)Nebraska:
1.0% (1,420)
Place of birth for U.S.-born residents:
This state: 33,617Other state: 10,194Northeast: 717Midwest: 3,474South: 1,959West: 4,158 80.1% of Grand Island residents lived in the same house 1 years ago.
Out of people who lived in different houses, 37.8% lived in this county.
Out of people who lived in different counties, 65.7% lived in Nebraska.
Grand Island:
80.1%State average:
87.4%
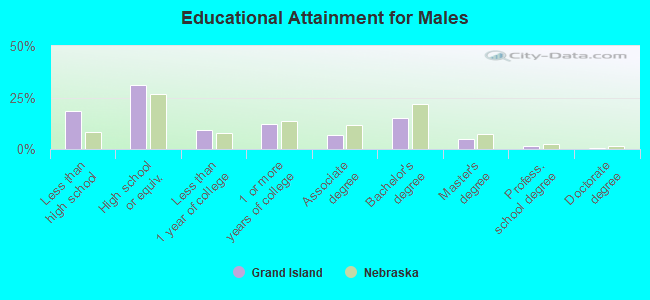
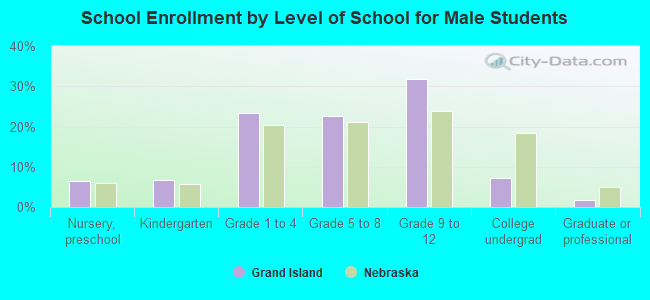
Education attainment for males 25 years and older:
No schooling: 875Nursery to 4th grade: 95th and 6th grade: 3407th and 8th grade: 3839th grade: 20610th grade: 54211th grade: 39712th grade, no diploma: 352High school graduate (or equivalency): 5,182Less than 1 year of college: 1,527Some college more than 1 year, no degree: 2,034Associate degree: 1,167Bachelor's degree: 2,499Master's degree: 776Professional school degree: 262Doctorate degree: 103
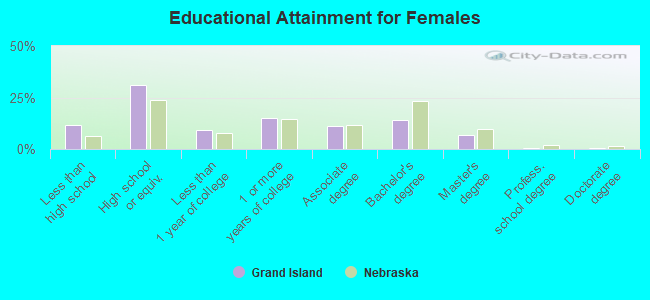
Education attainment for females 25 years and older:
No schooling: 629Nursery to 4th grade: 825th and 6th grade: 2077th and 8th grade: 1779th grade: 15710th grade: 20111th grade: 15412th grade, no diploma: 319High school graduate (or equivalency): 5,127Less than 1 year of college: 1,528Some college more than 1 year, no degree: 2,528Associate degree: 1,824Bachelor's degree: 2,348Master's degree: 1,125Professional school degree: 114Doctorate degree: 92
Housing units in structures:
One, detached: 13,553One, attached: 1,140Two: 7663 or 4: 1,5265 to 9: 1,07010 to 19: 82720 to 49: 62350 or more: 1,115Mobile homes: 988Median worth of mobile homes: $38,975
Housing units lacking complete plumbing facilities in 2022: 0.5%Housing units lacking complete kitchen facilities in 2022: 3.8%House/condo owner moved in on average 11 years ago
Renter moved in on average 3 years ago
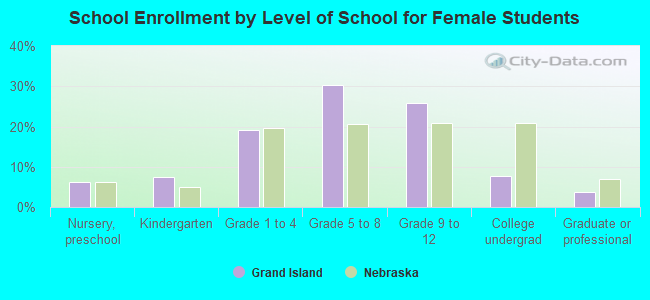
Private vs. public school enrollment:
Students in private schools in grades 1 to 8 (elementary and middle school): 262 Students in private schools in grades 9 to 12 (high school): 392 Students in private undergraduate colleges: 121