Races in Grand Island, Nebraska (NE) Detailed Stats
Data:
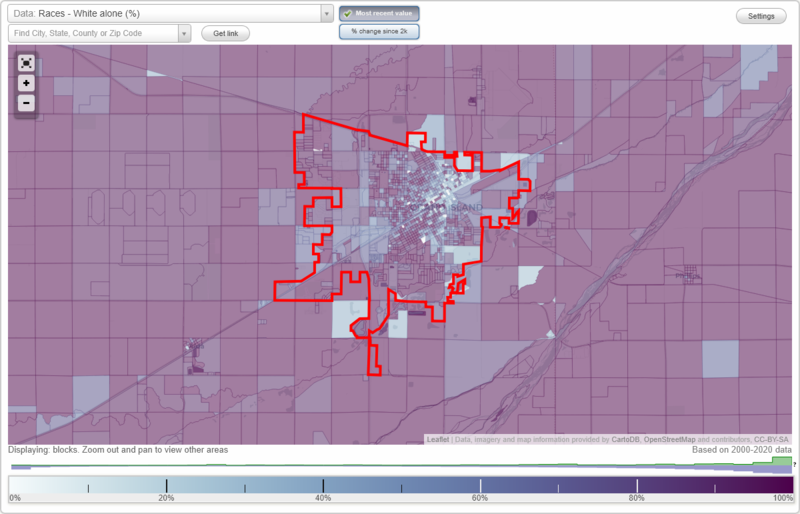
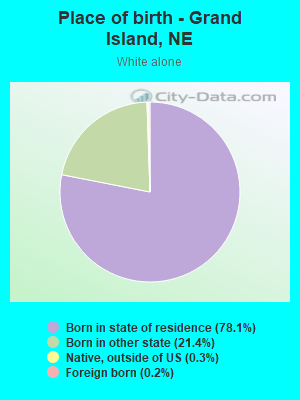
Races - White alone (%)
Races - White alone (% change since 2000)
Races - Black alone (%)
Races - Black alone (% change since 2000)
Races - American Indian alone (%)
Races - American Indian alone (% change since 2000)
Races - Asian alone (%)
Races - Asian alone (% change since 2000)
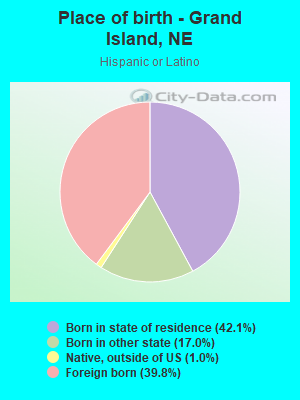
Races - Hispanic (%)
Races - Hispanic (% change since 2000)
Races - Native Hawaiian and Other Pacific Islander alone (%)
Races - Native Hawaiian and Other Pacific Islander alone (% change since 2000)
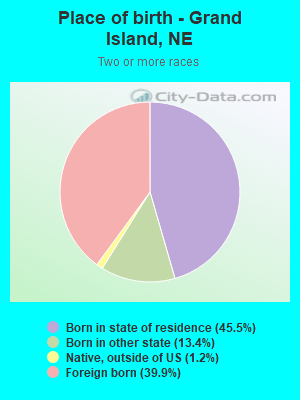
Races - Two or more races(%)
Races - Two or more races(% change since 2000)
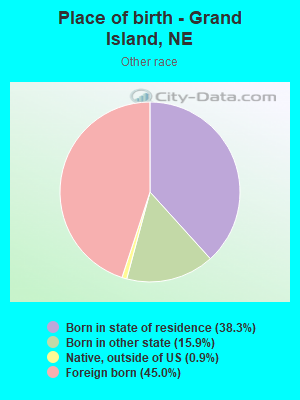
Races - Other race alone (%)
Races - Other race alone (% change since 2000)
Racial diversity
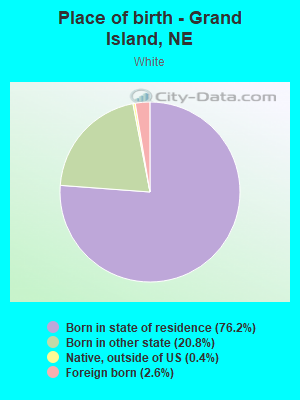
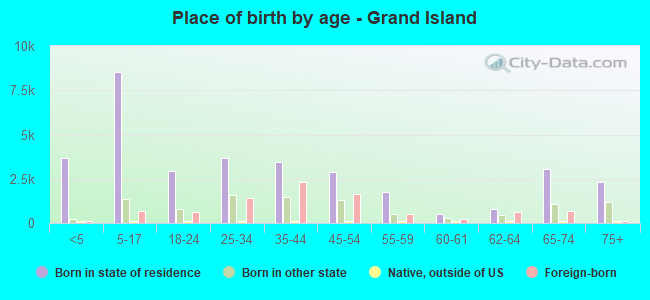
Place of birth - Born in state of residence (%)
Place of birth - Born in state of residence (%) - White
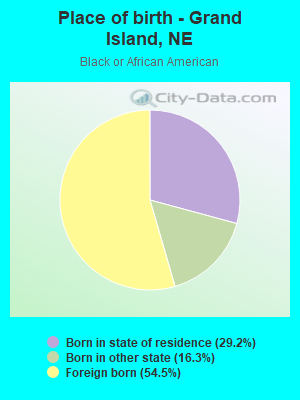
Place of birth - Born in state of residence (%) - Black or African American
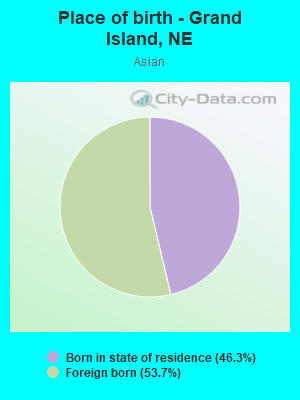
Place of birth - Born in state of residence (%) - Asian
Place of birth - Born in state of residence (%) - Hispanic or Latino
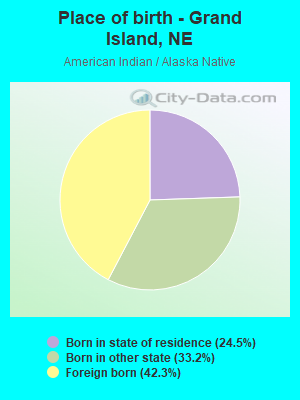
Place of birth - Born in state of residence (%) - American Indian and Alaska Native
Place of birth - Born in state of residence (%) - Multirace
Place of birth - Born in state of residence (%) - Other Race
Place of birth - Born in other state (%)
Place of birth - Born in other state (%) - White
Place of birth - Born in other state (%) - Black or African American
Place of birth - Born in other state (%) - Asian
Place of birth - Born in other state (%) - Hispanic or Latino
Place of birth - Born in other state (%) - American Indian and Alaska Native
Place of birth - Born in other state (%) - Multirace
Place of birth - Born in other state (%) - Other Race
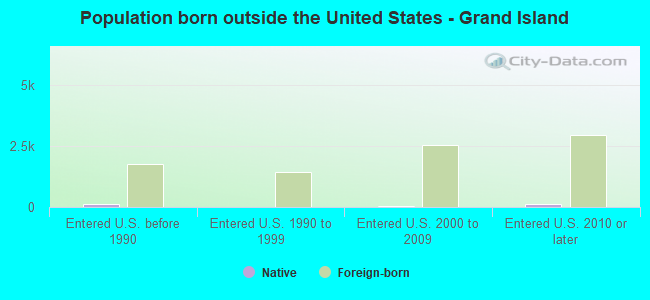
Place of birth - Native, outside of US (%)
Place of birth - Native, outside of US (%) - White
Place of birth - Native, outside of US (%) - Black or African American
Place of birth - Native, outside of US (%) - Asian
Place of birth - Native, outside of US (%) - Hispanic or Latino
Place of birth - Native, outside of US (%) - American Indian and Alaska Native
Place of birth - Native, outside of US (%) - Multirace
Place of birth - Native, outside of US (%) - Other Race
Place of birth - Foreign born (%)
Place of birth - Foreign born (%) - White
Place of birth - Foreign born (%) - Black or African American
Place of birth - Foreign born (%) - Asian
Place of birth - Foreign born (%) - Hispanic or Latino
Place of birth - Foreign born (%) - American Indian and Alaska Native
Place of birth - Foreign born (%) - Multirace
Place of birth - Foreign born (%) - Other Race
Residents speaking English at home (%)
Residents speaking English at home - Born in the United States (%)
Residents speaking English at home - Native, born elsewhere (%)
Residents speaking English at home - Foreign born (%)
Residents speaking Spanish at home (%)
Residents speaking Spanish at home - Born in the United States (%)
Residents speaking Spanish at home - Native, born elsewhere (%)
Residents speaking Spanish at home - Foreign born (%)
Residents speaking other language at home (%)
Residents speaking other language at home - Born in the United States (%)
Residents speaking other language at home - Native, born elsewhere (%)
Residents speaking other language at home - Foreign born (%)
Marital status - Never married (%)
Marital status - Now married (%)
Marital status - Separated (%)
Marital status - Widowed (%)
Marital status - Divorced (%)
Ancestries Reported - Arab (%)
Ancestries Reported - Czech (%)
Ancestries Reported - Danish (%)
Ancestries Reported - Dutch (%)
Ancestries Reported - English (%)
Ancestries Reported - French (%)
Ancestries Reported - French Canadian (%)
Ancestries Reported - German (%)
Ancestries Reported - Greek (%)
Ancestries Reported - Hungarian (%)
Ancestries Reported - Irish (%)
Ancestries Reported - Italian (%)
Ancestries Reported - Lithuanian (%)
Ancestries Reported - Norwegian (%)
Ancestries Reported - Polish (%)
Ancestries Reported - Portuguese (%)
Ancestries Reported - Russian (%)
Ancestries Reported - Scotch-Irish (%)
Ancestries Reported - Scottish (%)
Ancestries Reported - Slovak (%)
Ancestries Reported - Subsaharan African (%)
Ancestries Reported - Swedish (%)
Ancestries Reported - Swiss (%)
Ancestries Reported - Ukrainian (%)
Ancestries Reported - United States (%)
Ancestries Reported - Welsh (%)
Ancestries Reported - West Indian (%)
Ancestries Reported - Other (%)
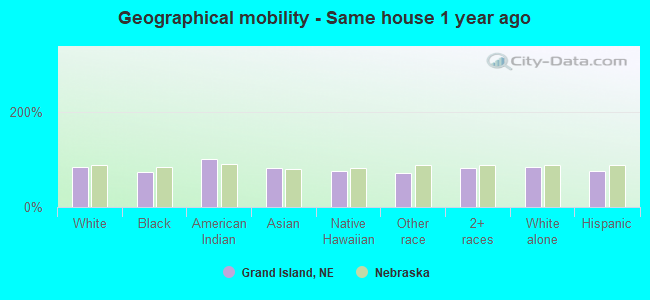
Geographical mobility - Same house 1 year ago (%)
Geographical mobility - Same house 1 year ago (%) - White
Geographical mobility - Same house 1 year ago (%) - Black or African American
Geographical mobility - Same house 1 year ago (%) - Asian
Geographical mobility - Same house 1 year ago (%) - Hispanic or Latino
Geographical mobility - Same house 1 year ago (%) - American Indian and Alaska Native
Geographical mobility - Same house 1 year ago (%) - Multirace
Geographical mobility - Same house 1 year ago (%) - Other Race
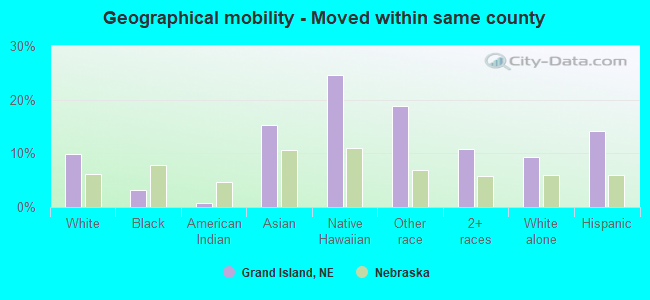
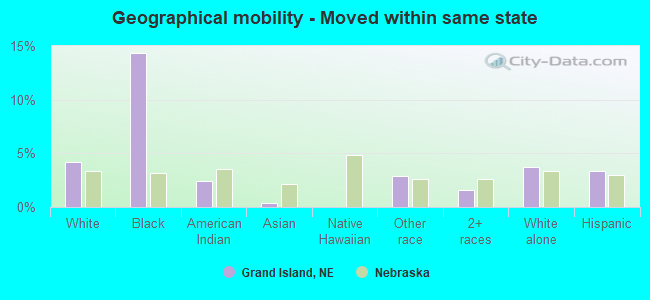
Geographical mobility - Moved within same county (%)
Geographical mobility - Moved within same county (%) - White
Geographical mobility - Moved within same county (%) - Black or African American
Geographical mobility - Moved within same county (%) - Asian
Geographical mobility - Moved within same county (%) - Hispanic or Latino
Geographical mobility - Moved within same county (%) - American Indian and Alaska Native
Geographical mobility - Moved within same county (%) - Multirace
Geographical mobility - Moved within same county (%) - Other Race
Geographical mobility - Moved from different county within same state (%)
Geographical mobility - Moved from different county within same state (%) - White
Geographical mobility - Moved from different county within same state (%) - Black or African American
Geographical mobility - Moved from different county within same state (%) - Asian
Geographical mobility - Moved from different county within same state (%) - Hispanic or Latino
Geographical mobility - Moved from different county within same state (%) - American Indian and Alaska Native
Geographical mobility - Moved from different county within same state (%) - Multirace
Geographical mobility - Moved from different county within same state (%) - Other Race
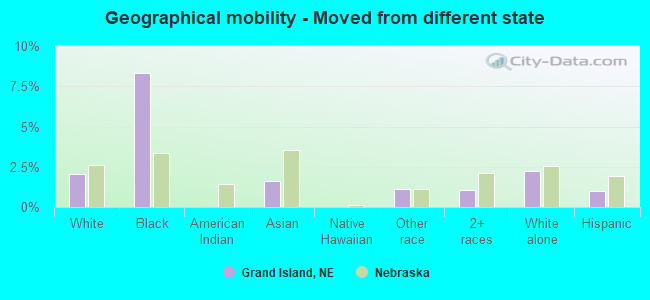
Geographical mobility - Moved from different state (%)
Geographical mobility - Moved from different state (%) - White
Geographical mobility - Moved from different state (%) - Black or African American
Geographical mobility - Moved from different state (%) - Asian
Geographical mobility - Moved from different state (%) - Hispanic or Latino
Geographical mobility - Moved from different state (%) - American Indian and Alaska Native
Geographical mobility - Moved from different state (%) - Multirace
Geographical mobility - Moved from different state (%) - Other Race
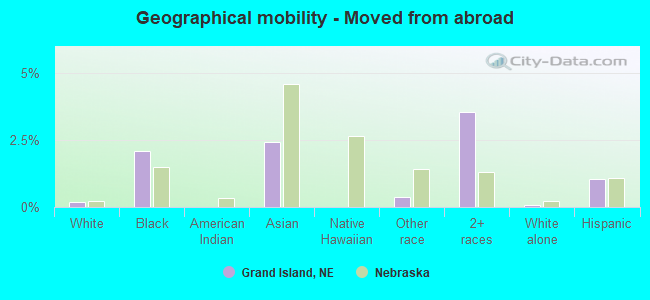
Geographical mobility - Moved from abroad (%)
Geographical mobility - Moved from abroad (%) - White
Geographical mobility - Moved from abroad (%) - Black or African American
Geographical mobility - Moved from abroad (%) - Asian
Geographical mobility - Moved from abroad (%) - Hispanic or Latino
Geographical mobility - Moved from abroad (%) - American Indian and Alaska Native
Geographical mobility - Moved from abroad (%) - Multirace
Geographical mobility - Moved from abroad (%) - Other Race
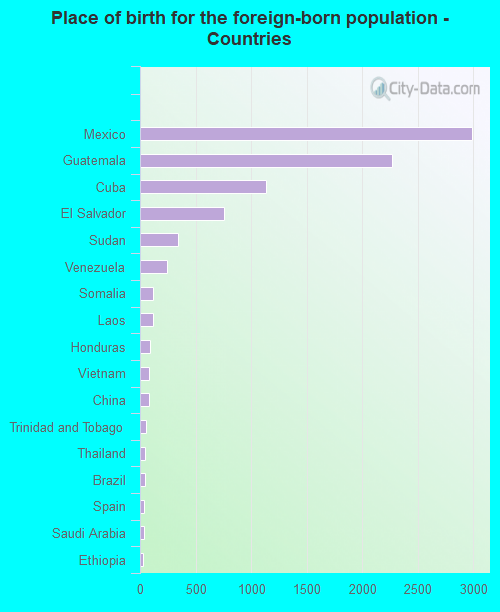
Place of birth for the foreign-born population - Ireland (%)
Place of birth for the foreign-born population - Denmark (%)
Place of birth for the foreign-born population - Norway (%)
Place of birth for the foreign-born population - Sweden (%)
Place of birth for the foreign-born population - United Kingdom (%)
Place of birth for the foreign-born population - England (%)
Place of birth for the foreign-born population - Scotland (%)
Place of birth for the foreign-born population - Other Northern Europe (%)
Place of birth for the foreign-born population - Austria (%)
Place of birth for the foreign-born population - Belgium (%)
Place of birth for the foreign-born population - France (%)
Place of birth for the foreign-born population - Germany (%)
Place of birth for the foreign-born population - Netherlands (%)
Place of birth for the foreign-born population - Switzerland (%)
Place of birth for the foreign-born population - Other Western Europe (%)
Place of birth for the foreign-born population - Greece (%)
Place of birth for the foreign-born population - Italy (%)
Place of birth for the foreign-born population - Portugal (%)
Place of birth for the foreign-born population - Spain (%)
Place of birth for the foreign-born population - Other Southern Europe (%)
Place of birth for the foreign-born population - Albania (%)
Place of birth for the foreign-born population - Belarus (%)
Place of birth for the foreign-born population - Bosnia and Herzegovina (%)
Place of birth for the foreign-born population - Bulgaria (%)
Place of birth for the foreign-born population - Croatia (%)
Place of birth for the foreign-born population - Czechoslovakia (%)
Place of birth for the foreign-born population - Hungary (%)
Place of birth for the foreign-born population - Latvia (%)
Place of birth for the foreign-born population - Lithuania (%)
Place of birth for the foreign-born population - North Macedonia (Macedonia) (%)
Place of birth for the foreign-born population - Moldova (%)
Place of birth for the foreign-born population - Poland (%)
Place of birth for the foreign-born population - Romania (%)
Place of birth for the foreign-born population - Russia (%)
Place of birth for the foreign-born population - Serbia (%)
Place of birth for the foreign-born population - Ukraine (%)
Place of birth for the foreign-born population - Other Eastern Europe (%)
Place of birth for the foreign-born population - China (%)
Place of birth for the foreign-born population - Hong Kong (%)
Place of birth for the foreign-born population - Taiwan (%)
Place of birth for the foreign-born population - Japan (%)
Place of birth for the foreign-born population - Korea (%)
Place of birth for the foreign-born population - Other Eastern Asia (%)
Place of birth for the foreign-born population - Afghanistan (%)
Place of birth for the foreign-born population - Bangladesh (%)
Place of birth for the foreign-born population - India (%)
Place of birth for the foreign-born population - Iran (%)
Place of birth for the foreign-born population - Kazakhstan (%)
Place of birth for the foreign-born population - Nepal (%)
Place of birth for the foreign-born population - Pakistan (%)
Place of birth for the foreign-born population - Sri Lanka (%)
Place of birth for the foreign-born population - Uzbekistan (%)
Place of birth for the foreign-born population - Other South Central Asia (%)
Place of birth for the foreign-born population - Burma (%)
Place of birth for the foreign-born population - Cambodia (%)
Place of birth for the foreign-born population - Indonesia (%)
Place of birth for the foreign-born population - Laos (%)
Place of birth for the foreign-born population - Malaysia (%)
Place of birth for the foreign-born population - Philippines (%)
Place of birth for the foreign-born population - Singapore (%)
Place of birth for the foreign-born population - Thailand (%)
Place of birth for the foreign-born population - Vietnam (%)
Place of birth for the foreign-born population - Other South Eastern Asia (%)
Place of birth for the foreign-born population - Armenia (%)
Place of birth for the foreign-born population - Iraq (%)
Place of birth for the foreign-born population - Israel (%)
Place of birth for the foreign-born population - Jordan (%)
Place of birth for the foreign-born population - Kuwait (%)
Place of birth for the foreign-born population - Lebanon (%)
Place of birth for the foreign-born population - Saudi Arabia (%)
Place of birth for the foreign-born population - Syria (%)
Place of birth for the foreign-born population - Turkey (%)
Place of birth for the foreign-born population - Yemen (%)
Place of birth for the foreign-born population - Other Western Asia (%)
Place of birth for the foreign-born population - Eritrea (%)
Place of birth for the foreign-born population - Ethiopia (%)
Place of birth for the foreign-born population - Kenya (%)
Place of birth for the foreign-born population - Somalia (%)
Place of birth for the foreign-born population - Uganda (%)
Place of birth for the foreign-born population - Zimbabwe (%)
Place of birth for the foreign-born population - Other Eastern Africa (%)
Place of birth for the foreign-born population - Cameroon (%)
Place of birth for the foreign-born population - Congo (%)
Place of birth for the foreign-born population - Democratic Republic of Congo (Zaire) (%)
Place of birth for the foreign-born population - Other Middle Africa (%)
Place of birth for the foreign-born population - Egypt (%)
Place of birth for the foreign-born population - Morocco (%)
Place of birth for the foreign-born population - Sudan (%)
Place of birth for the foreign-born population - Other Northern Africa (%)
Place of birth for the foreign-born population - South Africa (%)
Place of birth for the foreign-born population - Other Southern Africa (%)
Place of birth for the foreign-born population - Cabo Verde (%)
Place of birth for the foreign-born population - Ghana (%)
Place of birth for the foreign-born population - Liberia (%)
Place of birth for the foreign-born population - Nigeria (%)
Place of birth for the foreign-born population - Senegal (%)
Place of birth for the foreign-born population - Sierra Leone (%)
Place of birth for the foreign-born population - Other Western Africa (%)
Place of birth for the foreign-born population - Australia (%)
Place of birth for the foreign-born population - New Zealand (%)
Place of birth for the foreign-born population - Fiji (%)
Place of birth for the foreign-born population - Micronesia (%)
Place of birth for the foreign-born population - Bahamas (%)
Place of birth for the foreign-born population - Barbados (%)
Place of birth for the foreign-born population - Cuba (%)
Place of birth for the foreign-born population - Dominica (%)
Place of birth for the foreign-born population - Dominican Republic (%)
Place of birth for the foreign-born population - Grenada (%)
Place of birth for the foreign-born population - Haiti (%)
Place of birth for the foreign-born population - Jamaica (%)
Place of birth for the foreign-born population - St. Vincent and the Grenadines (%)
Place of birth for the foreign-born population - Trinidad and Tobago (%)
Place of birth for the foreign-born population - West Indies (%)
Place of birth for the foreign-born population - Other Caribbean (%)
Place of birth for the foreign-born population - Belize (%)
Place of birth for the foreign-born population - Costa Rica (%)
Place of birth for the foreign-born population - El Salvador (%)
Place of birth for the foreign-born population - Guatemala (%)
Place of birth for the foreign-born population - Honduras (%)
Place of birth for the foreign-born population - Mexico (%)
Place of birth for the foreign-born population - Nicaragua (%)
Place of birth for the foreign-born population - Panama (%)
Place of birth for the foreign-born population - Other Central America (%)
Place of birth for the foreign-born population - Argentina (%)
Place of birth for the foreign-born population - Bolivia (%)
Place of birth for the foreign-born population - Brazil (%)
Place of birth for the foreign-born population - Chile (%)
Place of birth for the foreign-born population - Colombia (%)
Place of birth for the foreign-born population - Ecuador (%)
Place of birth for the foreign-born population - Guyana (%)
Place of birth for the foreign-born population - Peru (%)
Place of birth for the foreign-born population - Uruguay (%)
Place of birth for the foreign-born population - Venezuela (%)
Place of birth for the foreign-born population - Other South America (%)
Place of birth for the foreign-born population - Canada (%)
Place of birth for the foreign-born population - Other Northern America (%)
Place of birth for the foreign-born population - Other (%)
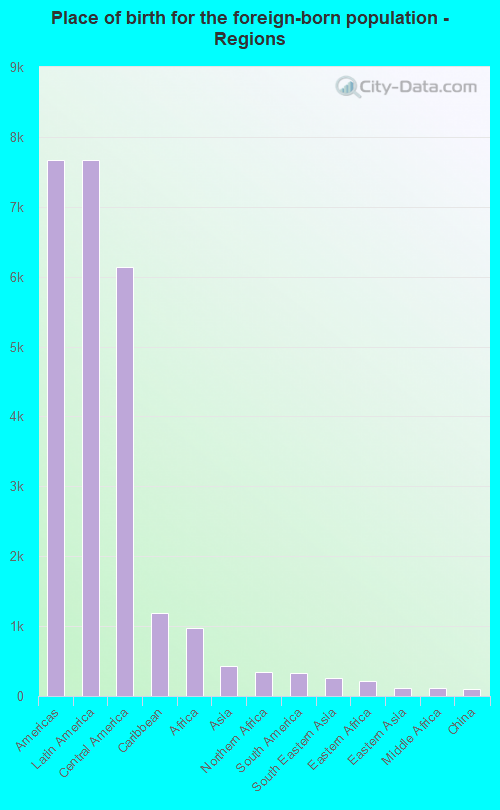
According to 2022 data, the most numerous races in Grand Island, NE are White alone (30,878 residents), Hispanic (18,822 residents), and Black alone (1,817 residents). 72.4% of Grand Island residents speak English at home. 17.2% of Grand Island, NE residents are foreign-born (14.2% born in Latin America, 1.8% born in Africa), which is 59.3% greater than the foreign-born rate of 7.0% across the entire state of Nebraska.
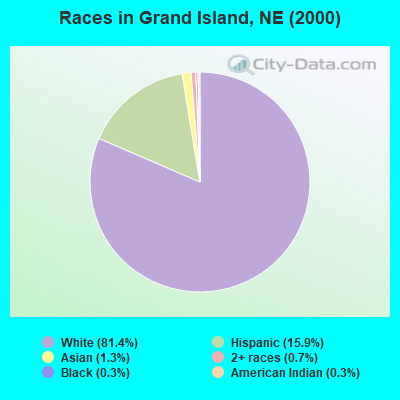
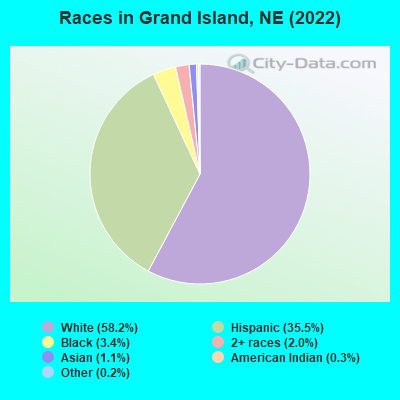
Race distribution in Grand Island
2000 2022
1,494,494 87.3% White alone 94,425 5.5% Hispanic 67,537 3.9% Black alone 21,677 1.3% Asian alone 17,696 1.0% Two or more races 13,460 0.8% American Indian alone 1,327 0.08% Other race alone 647 0.04% Native Hawaiian and Other
1,492,005 75.8% White alone 241,898 12.3% Hispanic 89,520 4.5% Black alone 76,499 3.9% Two or more races 49,261 2.5% Asian alone 10,249 0.5% American Indian alone 7,425 0.4% Other race alone 1,066 0.05% Native Hawaiian and Other
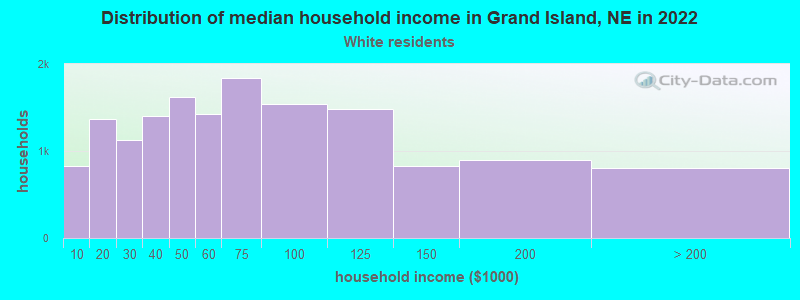
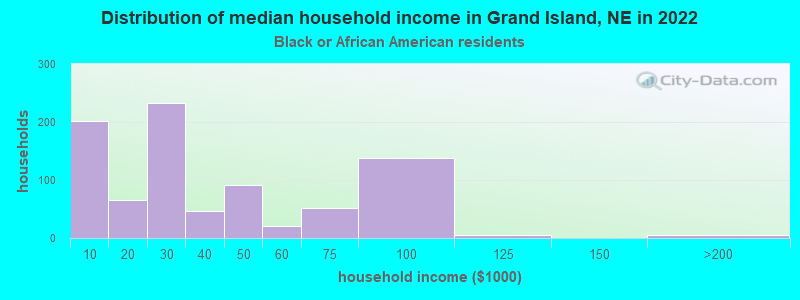
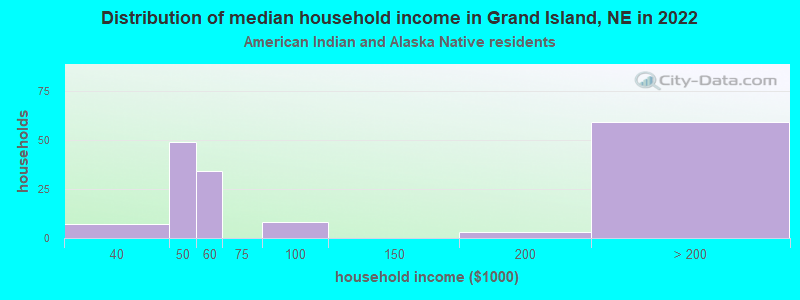
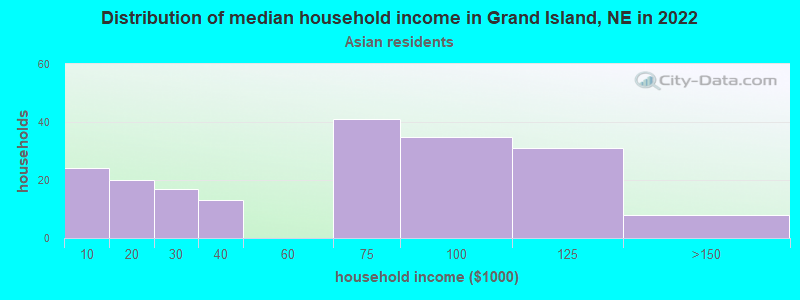
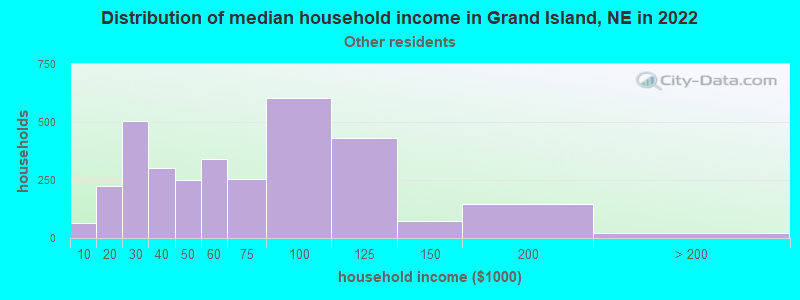
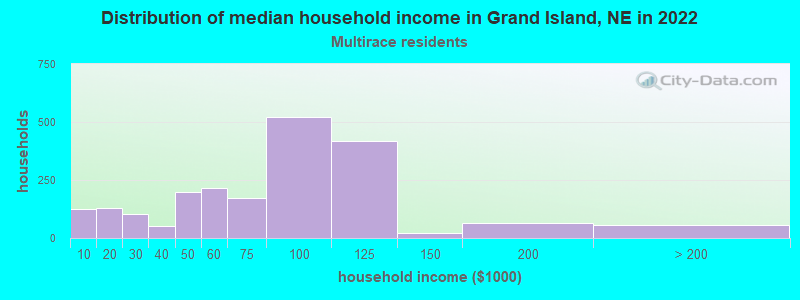
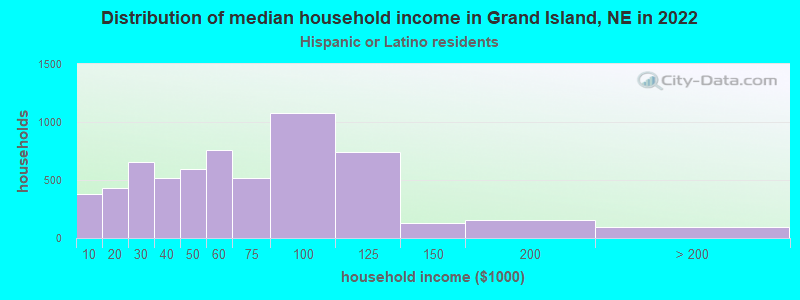
Income and house value in Grand Island Median household income in 2022 $62,617 White non-Hispanic householders$24,770 Black householders$53,887 Some other race householders$73,270 Two or more races householders$55,606 Hispanic or Latino race householdersMedian 2022 house value $215,848 White Non-Hispanic householders$32,044 Black or African American householders$224,308 American Indian or Alaska Native householders $188,418 Asian householders$192,264 Native Hawaiian and other Pacific Islander householders$160,220 Some other race householders$163,296 Two or more races householders$158,425 Hispanic or Latino householders
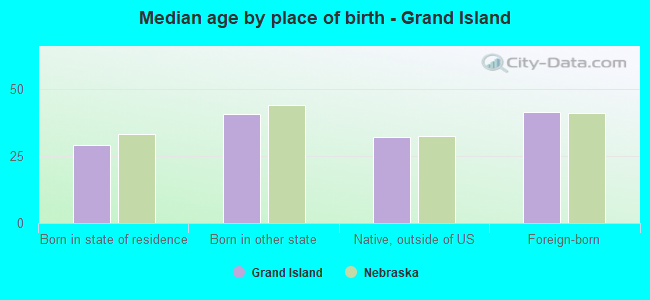
Median age by race in Grand Island
40.3 Median age for White residents38.7 41.3 32.8 Median age for Black or African American residents26.7 33.2 37.3 Median age for American Indian / Alaska Native residents35.0 36.6 32.5 Median age for Asian residents25.1 37.8 15.6 Median age for Native Hawaiian / Pacific Islander residents14.7 -689,223,057.0 24.0 Median age for Other race residents24.7 23.8 34.5 Median age for Two or more races residents32.8 35.9 42.8 Median age for White alone residents41.3 44.4 25.4 Median age for Hispanic or Latino residents25.3 24.7
Owner/renter occupied households by race in Grand Island
House owners and renters - White residents 9,447 62.6% Owner occupied5,640 37.4% Renter occupiedHouse owners and renters - Black or African American residents 130 15.1% Owner occupied729 84.9% Renter occupiedHouse owners and renters - American Indian / Alaska Native residents 89 42.3% Owner occupied121 57.7% Renter occupiedHouse owners and renters - Asian residents 148 77.0% Owner occupied44 23.0% Renter occupiedHouse owners and renters - Native Hawaiian / Pacific Islander residents 10 100.0% Owner occupiedHouse owners and renters - Other race residents 1,533 44.3% Owner occupied1,930 55.7% Renter occupiedHouse owners and renters - Two or more races residents 1,294 62.3% Owner occupied784 37.7% Renter occupiedHouse owners and renters - White alone residents 8,963 64.7% Owner occupied4,881 35.3% Renter occupiedHouse owners and renters - Hispanic or Latino residents 2,813 46.1% Owner occupied3,285 53.9% Renter occupied
Language usage in Grand Island
English speakers - Total 72.4% of residents of Grand Island speak English at home.
23.5% of residents speak Spanish at home 5,885 50.9% Speak English very well5,678 49.1% Speak English less than very well3.0% of residents speak other language at home 577 38.7% Speak English very well915 61.3% Speak English less than very well
English speakers - Born in the United States 78.4% of residents of Grand Island speak English at home.
19.1% of residents speak Spanish at home 1,654 86.8% Speak English very well251 13.2% Speak English less than very well0.9% of residents speak other language at home 90 100.0% Speak English very well
English speakers - Native, born elsewhere 58.4% of residents of Grand Island speak English at home.
41.2% of residents speak Spanish at home 58 43.9% Speak English very well74 56.1% Speak English less than very well
English speakers - Foreign-born 5.2% of residents of Grand Island speak English at home.
82.2% of residents speak Spanish at home 2,054 28.9% Speak English very well5,049 71.1% Speak English less than very well13.0% of residents speak other language at home 235 20.9% Speak English very well887 79.1% Speak English less than very well
White (Caucasian) - Speak only English Native:
96.1% (30,567)Foreign-born:
9.7% (89)
White (Caucasian) - Speak another language Native:
3.4% (1,090)Foreign-born:
84.9% (779)
Black or African American - Speak only English Native:
90.4% (726)Foreign-born:
3.9% (42)
Black or African American - Speak another language Native:
10.4% (84)Foreign-born:
91.4% (988)
American Indian / Alaska Native - Speak another language Native:
49.3% (178)Foreign-born:
100.0% (266)
Asian - Speak only English Native:
33.9% (98)Foreign-born:
22.2% (81)
Asian - Speak another language Native:
62.5% (181)Foreign-born:
77.1% (282)
Native Hawaiian / Pacific Islander - Speak another language Native:
94.6% (168)Foreign-born:
100.0% (9)
Other race - Speak only English Native:
43.3% (1,892)Foreign-born:
4.1% (196)
Other race - Speak another language Native:
55.2% (2,416)Foreign-born:
96.4% (4,609)
Two or more races - Speak only English Native:
59.4% (1,950)Foreign-born:
2.3% (55)
Two or more races - Speak another language Native:
39.9% (1,311)Foreign-born:
99.6% (2,403)
White alone - Speak only English Native:
98.5% (28,829)Foreign-born:
88.1% (60)
Hispanic or Latino - Speak only English Native:
51.9% (4,759)Foreign-born:
3.5% (258)
Hispanic or Latino - Speak another language Native:
45.9% (4,208)Foreign-born:
96.7% (7,156)
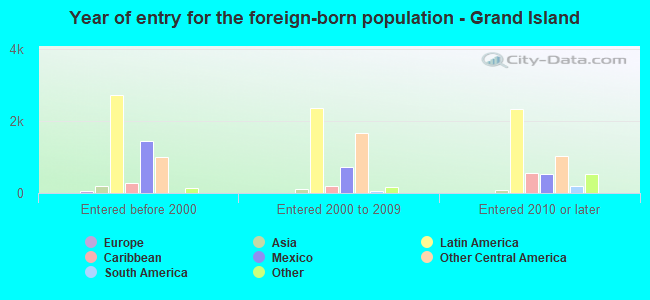
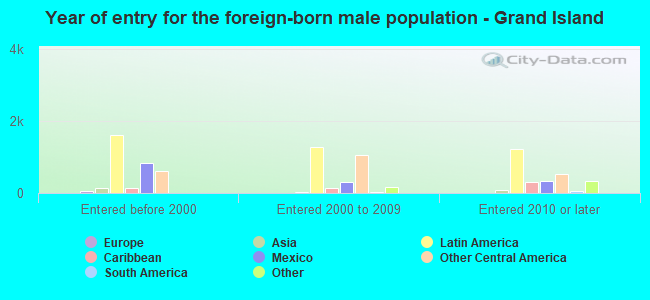
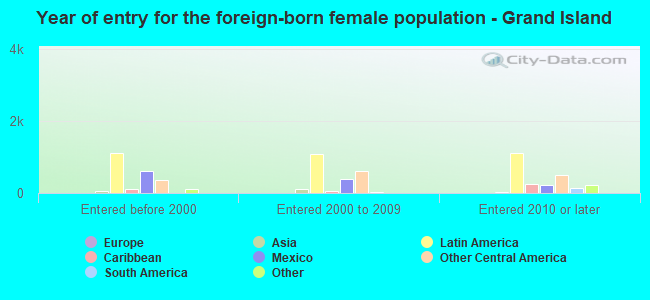
Foreign-born residents in Grand Island 9,124 residents are foreign born (14.2% Latin America , 1.8% Africa ).
This city:
17.2%Nebraska:
7.5%
Marital status for residents in Grand Island Marital status - White (Caucasian) population 15 years and over
Males 30.2% Never married52.8% Now married0.6% Separated3.8% Widowed12.6% DivorcedFemales 25.6% Never married47.7% Now married1.6% Separated10.8% Widowed14.3% DivorcedWomen who gave birth in the past 12 months Now married:
65.3% (571)Unmarried:
34.7% (304)
Women who did not give birth in the past 12 months Now married:
44.4% (2,944)Unmarried:
55.6% (3,688)
Marital status - Black or African American population 15 years and over
Males 41.6% Never married40.2% Now married0.2% Separated0.0% Widowed18.0% DivorcedFemales 38.4% Never married30.8% Now married2.2% Separated0.0% Widowed28.6% DivorcedWomen who gave birth in the past 12 months Now married:
0.0% (0)Unmarried:
100.0% (30)
Women who did not give birth in the past 12 months Now married:
34.9% (174)Unmarried:
65.1% (324)
Marital status - American Indian / Alaska Native population 15 years and over
Males 30.3% Never married56.7% Now married0.0% Separated0.0% Widowed13.0% DivorcedFemales 19.7% Never married51.0% Now married0.0% Separated0.0% Widowed29.3% DivorcedWomen who did not give birth in the past 12 months Now married:
32.1% (30)Unmarried:
67.9% (64)
Marital status - Asian population 15 years and over
Males 59.5% Never married34.1% Now married0.0% Separated0.0% Widowed6.4% DivorcedFemales 14.9% Never married81.5% Now married0.0% Separated0.8% Widowed2.8% DivorcedWomen who did not give birth in the past 12 months Now married:
71.2% (113)Unmarried:
28.8% (46)
Marital status - Native Hawaiian / Pacific Islander population 15 years and over
Males 0.0% Never married83.3% Now married0.0% Separated0.0% Widowed16.7% DivorcedFemales 0.0% Never married63.3% Now married0.0% Separated0.0% Widowed36.7% DivorcedWomen who did not give birth in the past 12 months Now married:
63.3% (20)Unmarried:
36.7% (12)
Marital status - Other race population 15 years and over
Males 45.6% Never married44.4% Now married0.8% Separated1.3% Widowed7.8% DivorcedFemales 52.5% Never married36.2% Now married3.5% Separated1.2% Widowed6.5% DivorcedWomen who gave birth in the past 12 months Now married:
48.2% (194)Unmarried:
51.8% (209)
Women who did not give birth in the past 12 months Now married:
33.4% (841)Unmarried:
66.6% (1,678)
Marital status - Two or more races population 15 years and over
Males 51.0% Never married37.1% Now married1.3% Separated3.6% Widowed7.0% DivorcedFemales 36.8% Never married48.4% Now married3.7% Separated0.0% Widowed11.1% DivorcedWomen who gave birth in the past 12 months Now married:
36.3% (65)Unmarried:
63.7% (114)
Women who did not give birth in the past 12 months Now married:
38.5% (386)Unmarried:
61.5% (618)
Marital status - White alone, not Hispanic / Latino population 15 years and over
Males 28.2% Never married53.7% Now married0.6% Separated4.1% Widowed13.3% DivorcedFemales 24.4% Never married48.2% Now married1.1% Separated11.5% Widowed14.9% DivorcedWomen who gave birth in the past 12 months Now married:
73.6% (445)Unmarried:
26.4% (160)
Women who did not give birth in the past 12 months Now married:
44.1% (2,624)Unmarried:
55.9% (3,330)
Marital status - Hispanic or Latino population 15 years and over
Males 45.7% Never married44.4% Now married0.5% Separated1.7% Widowed7.7% DivorcedFemales 43.9% Never married42.9% Now married3.9% Separated1.7% Widowed7.5% DivorcedWomen who gave birth in the past 12 months Now married:
41.9% (308)Unmarried:
58.1% (427)
Women who did not give birth in the past 12 months Now married:
40.7% (1,580)Unmarried:
59.3% (2,305)
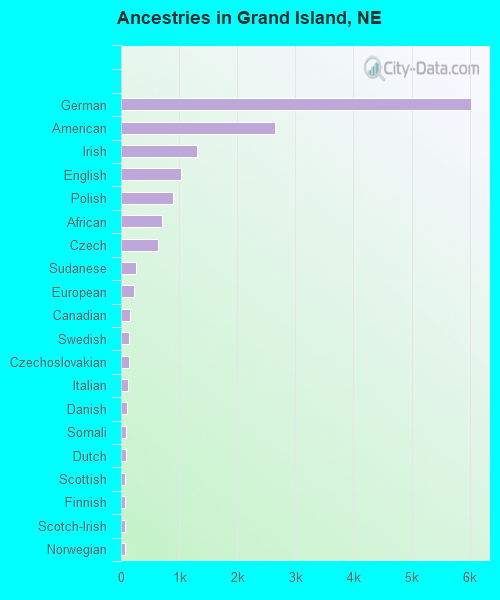
Ancestries in Grand Island
6,032 19.9% German2,650 8.7% American1,300 4.3% Irish1,038 3.4% English900 3.0% Polish700 2.3% African645 2.1% Czech255 0.8% Sudanese217 0.7% European155 0.5% Canadian138 0.5% Swedish132 0.4% Czechoslovakian116 0.4% Italian106 0.3% Danish84 0.3% Somali82 0.3% Dutch75 0.2% Scottish71 0.2% Finnish70 0.2% Scotch-Irish61 0.2% Norwegian40 0.1% Eastern European33 0.1% French26 0.09% Welsh19 0.06% Portuguese17 0.06% French Canadian13 0.04% Ethiopian12 0.04% Scandinavian12 0.04% Swiss11 0.04% Northern European8 0.03% Greek7 0.02% Celtic6 0.02% Lebanese6 0.02% Romanian4 0.01% British
Geographical mobility in Grand Island Same house 1 year ago 28,543 82.7% White (Caucasian)1,528 73.4% Black or African American546 100.0% American Indian / Alaska Native583 80.7% Asian138 74.8% Native Hawaiian / Pacific Islander7,526 71.2% Other race4,835 81.5% Two or more races25,710 83.9% White alone, not Hispanic / Latino13,817 75.7% Hispanic or LatinoMoved within same county 3,435 9.9% White / Caucasian65 3.1% Black or African American4 0.8% American Indian / Alaska Native110 15.2% Asian45 24.6% Native Hawaiian / Pacific Islander1,992 18.9% Other race642 10.8% Two or more races2,856 9.3% White alone, not Hispanic / Latino2,586 14.2% Hispanic or LatinoMoved within same state 1,435 4.2% White / Caucasian299 14.4% Black or African American13 2.4% American Indian / Alaska Native3 0.4% Asian301 2.8% Other race97 1.6% Two or more races1,131 3.7% White alone, not Hispanic / Latino608 3.3% Hispanic or LatinoMoved from different state 705 2.0% White / Caucasian174 8.3% Black or African American12 1.6% Asian117 1.1% Other race61 1.0% Two or more races686 2.2% White alone, not Hispanic / Latino177 1.0% Hispanic or LatinoMoved from abroad 68 0.2% White44 2.1% Black or African American18 2.4% Asian38 0.4% Other race211 3.6% Two or more races27 0.1% White alone, not Hispanic / Latino193 1.1% Hispanic or Latino
Children Nativity (place of birth) in Grand Island
Children under 6 years - Living with two parents Both parents native 1,588 99.1% Native15 0.9% Foreign-bornBoth parents foreign-born 597 95.7% Native27 4.3% Foreign-bornOne native, one foreign-born parent 299 100.0% NativeChildren under 6 years - Living with one parent Native parent 1,045 100.0% NativeForeign-born parent 740 100.0% NativeChildren 6 to 17 years - Living with two parents Both parents native 3,656 99.6% Native16 0.4% Foreign-bornBoth parents foreign-born 1,153 81.5% Native262 18.5% Foreign-bornOne native, one foreign-born parent 492 100.0% NativeChildren 6 to 17 years - Living with one parent Native parent 2,255 100.0% NativeForeign-born parent 1,353 58.6% Native954 41.4% Foreign-born
Grandparents responsible for own grandchildren in Grand Island
Grandparents (30 to 59 years) White / Caucasian 30 72.6% Responsible for grandchildren11 27.4% Not responsible for grandchildrenBlack or African American 68 100.0% Responsible for grandchildrenOther race 97 100.0% Not responsible for grandchildrenTwo or more races 20 100.0% Not responsible for grandchildrenWhite alone, not Hispanic / Latino 29 81.9% Responsible for grandchildren7 18.1% Not responsible for grandchildrenHispanic or Latino 88 100.0% Not responsible for grandchildrenGrandparents (60 years and over) White / Caucasian 36 31.2% Responsible for grandchildren80 68.8% Not responsible for grandchildrenBlack or African American 21 100.0% Not responsible for grandchildrenOther race 72 100.0% Not responsible for grandchildrenTwo or more races 92 100.0% Not responsible for grandchildrenWhite alone, not Hispanic / Latino 37 30.4% Responsible for grandchildren84 69.6% Not responsible for grandchildrenHispanic or Latino 137 100.0% Not responsible for grandchildren