Housing density: 256 houses/condos per square mile
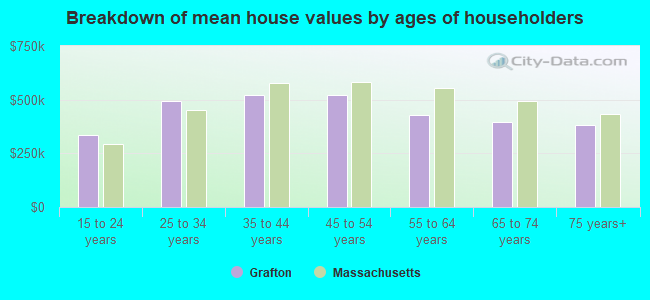
Median price asked for vacant for-sale houses and condos in 2022 in this county: $182,682.
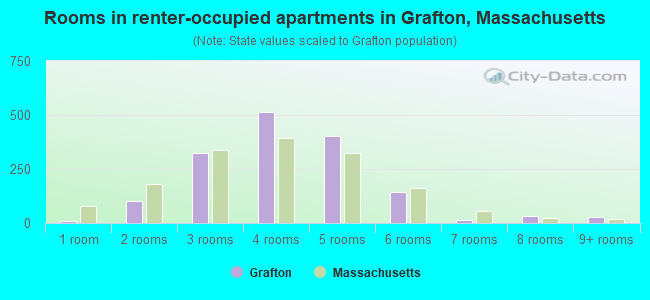
Median contract rent in 2022: $1,246 (lower quartile is $974, upper quartile is $1,637)
Median rent asked for vacant for-rent units in 2022: $1,721
Median gross rent in Grafton, MA in 2022: $1,425
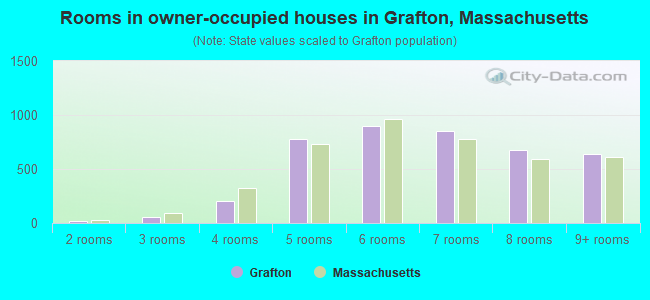
Housing units in Grafton with a mortgage: 2,732 (151 second mortgage, 457 home equity loan, 0 both second mortgage and home equity loan) Houses without a mortgage: 826
In family households: 644,137 (138,415 male householders, 64,187 female householders)
151,406 spouses, 234,038 children (220,335 natural, 5,096 adopted, 8,607 stepchildren), 11,080 grandchildren, 6,742 brothers or sisters, 7,870 parents, foster children, 7,297 other relatives, 18,119 non-relatives
In nonfamily households: 127,370 (47,312 male householders (35,337 living alone)), 53,166 female householders (44,100 living alone)), 26,892 nonrelatives
In group quarters: 27,045 (11,315 institutionalized population)
135,695 married couples with children.
42,745 single-parent households (8,218 men, 34,527 women).
93.1% of residents of Grafton speak English at home.
1.9% of residents speak Spanish at home (62% speak English very well, 29% speak English well, 9% speak English not well).
3.2% of residents speak other Indo-European language at home (74% speak English very well, 21% speak English well, 4% speak English not well).
1.2% of residents speak Asian or Pacific Island language at home (64% speak English very well, 13% speak English well, 12% speak English not well, 10% don't speak English at all).
0.6% of residents speak other language at home (63% speak English very well, 28% speak English well, 9% speak English not well).
Foreign born population: 1,315 (7.7%)
(65.0% of them are naturalized citizens)
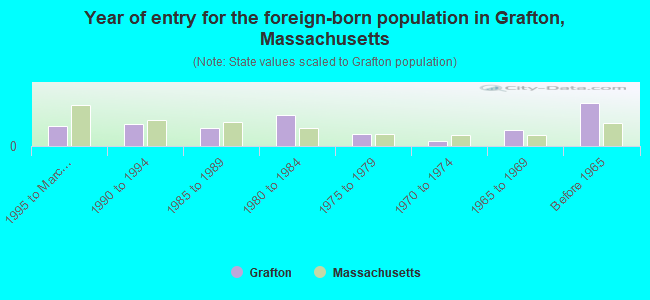
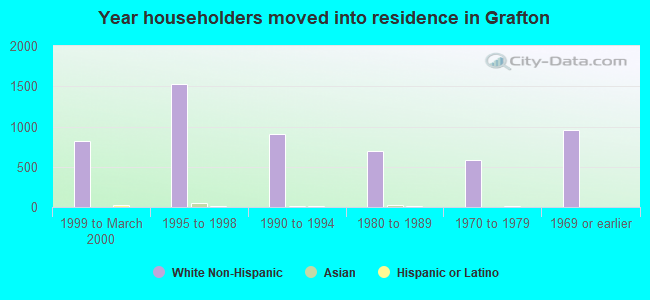
Year of entry for the foreign-born population in Grafton, Massachusetts
761995 to March 2000
871990 to 1994
711985 to 1989
1201980 to 1984
461975 to 1979
191970 to 1974
611965 to 1969
166Before 1965
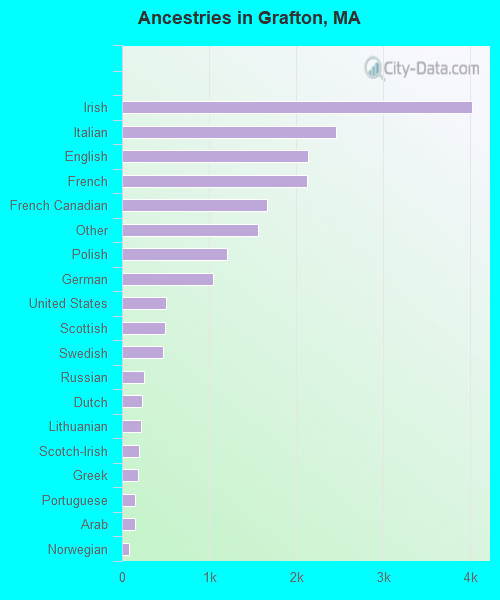
First ancestries reported:
Irish: 4,014 (20.8%)
Italian: 2,459 (12.7%)
English: 2,141 (11.1%)
French: 2,129 (11.0%)
French Canadian: 1,662 (8.6%)
Other: 1,566 (8.1%)
Polish: 1,211 (6.3%)
German: 1,045 (5.4%)
United States: 511 (2.6%)
Scottish: 491 (2.5%)
Swedish: 468 (2.4%)
Russian: 247 (1.3%)
Dutch: 235 (1.2%)
Lithuanian: 217 (1.1%)
Scotch-Irish: 194 (1.0%)
Greek: 189 (1.0%)
Portuguese: 146 (0.8%)
Arab: 144 (0.7%)
Norwegian: 80 (0.4%)
Welsh: 28 (0.1%)
Danish: 26 (0.1%)
Subsaharan African: 23 (0.1%)
Hungarian: 20 (0.1%)
Swiss: 16 (0.08%)
Ukrainian: 16 (0.08%)
West Indian: 12 (0.06%)
Czech: 5 (0.03%)
Most common places of birth for foreign-born residents (%):
Canada
Grafton:
24.0% (155)
Massachusetts:
5.2% (40,247)
China, excluding Hong Kong and Taiwan
Grafton:
10.2% (66)
Massachusetts:
5.1% (39,255)
Korea
Grafton:
6.3% (41)
Massachusetts:
1.7% (13,456)
Germany
Grafton:
5.6% (36)
Massachusetts:
1.9% (14,883)
Ireland
Grafton:
4.3% (28)
Massachusetts:
2.3% (17,987)
Portugal
Grafton:
4.2% (27)
Massachusetts:
8.6% (66,627)
Peru
Grafton:
3.9% (25)
Massachusetts:
0.5% (3,834)
Vietnam
Grafton:
3.7% (24)
Massachusetts:
3.9% (30,457)
Italy
Grafton:
3.6% (23)
Massachusetts:
3.7% (28,319)
Syria
Grafton:
3.3% (21)
Massachusetts:
0.3% (2,084)
United Kingdom
Grafton:
3.1% (20)
Massachusetts:
3.3% (25,403)
Other Eastern Europe
Grafton:
3.1% (20)
Massachusetts:
1.6% (12,350)
Hong Kong
Grafton:
2.8% (18)
Massachusetts:
1.0% (7,937)
Egypt
Grafton:
2.5% (16)
Massachusetts:
0.4% (2,726)
Ecuador
Grafton:
2.2% (14)
Massachusetts:
0.4% (3,066)
Guatemala
Grafton:
1.9% (12)
Massachusetts:
1.7% (12,868)
Cuba
Grafton:
1.7% (11)
Massachusetts:
0.5% (3,868)
Colombia
Grafton:
1.5% (10)
Massachusetts:
2.0% (15,286)
Place of birth for U.S.-born residents:
This state: 11,331
Other state: 2,833
Northeast: 1,887
Midwest: 272
South: 383
West: 291
58% of Grafton residents lived in the same house 5 years ago. Out of people who lived in different houses, 57% lived in this county. Out of people who lived in different counties, 59% lived in Massachusetts.
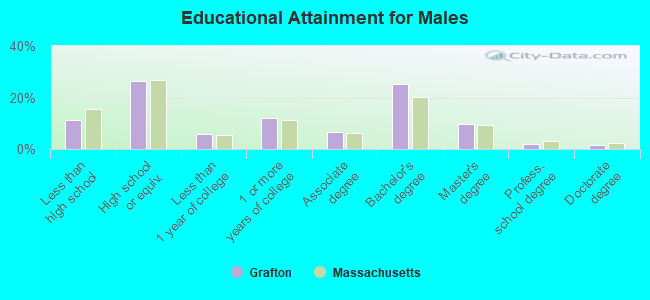
Education attainment for males 25 years and older:
No schooling: 26
Nursery to 4th grade: 0
5th and 6th grade: 6
7th and 8th grade: 71
9th grade: 72
10th grade: 87
11th grade: 149
12th grade, no diploma: 127
High school graduate (or equivalency): 1,253
Less than 1 year of college: 272
Some college more than 1 year, no degree: 567
Associate degree: 310
Bachelor's degree: 1,189
Master's degree: 455
Professional school degree: 87
Doctorate degree: 67
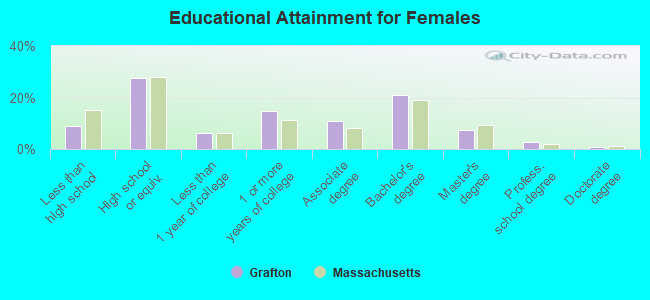
Education attainment for females 25 years and older:
No schooling: 34
Nursery to 4th grade: 0
5th and 6th grade: 16
7th and 8th grade: 91
9th grade: 69
10th grade: 84
11th grade: 82
12th grade, no diploma: 101
High school graduate (or equivalency): 1,454
Less than 1 year of college: 333
Some college more than 1 year, no degree: 773
Associate degree: 574
Bachelor's degree: 1,112
Master's degree: 398
Professional school degree: 147
Doctorate degree: 34
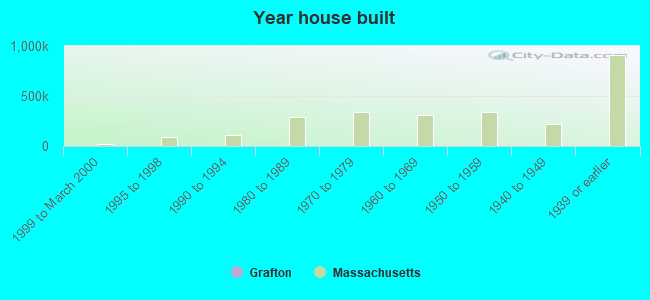
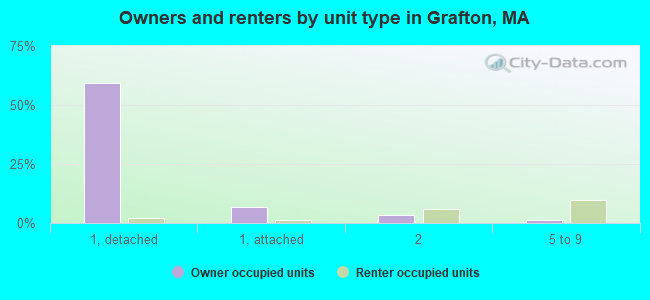
Housing units in structures:
One, detached: 3,535
One, attached: 453
Two: 579
3 or 4: 433
5 to 9: 649
10 to 19: 107
20 to 49: 58
50 or more: 8
Mobile homes: 6
Median worth of mobile homes: $213,895
Housing units lacking complete plumbing facilities: 0.4%
Housing units lacking complete kitchen facilities: 0.2%