Glen Avon, CA (California) Houses and Residents
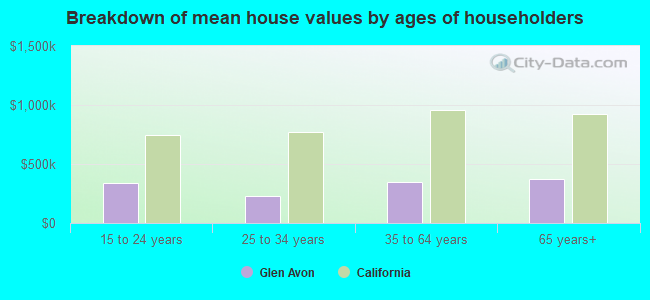
| Glen Avon: | $492,866 |
| California: | $715,900 |
Total population: 20,199 (Urban population: 14,177, Rural population: 665 (29 farm, 636 nonfarm))
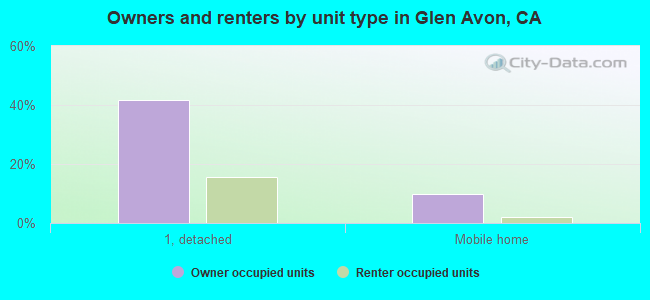
Houses: 6,980 (6,349 occupied: 3,601 owner occupied, 2,882 renter occupied)
| % of renters here: | 44% |
| State: | 44% |
Housing density: 946 houses/condos per square mile
Median price asked for vacant for-sale houses and condos in 2011_5yr: $267,379.
Median contract rent in 2022: $1,468 (lower quartile is $1,156, upper quartile is $1,696)
Median rent asked for vacant for-rent units in 2022: $2,496
Median gross rent in Glen Avon, CA in 2022: $1,586
Housing units in Glen Avon with a mortgage: 2,470 (54 second mortgage, 117 home equity loan, 27 both second mortgage and home equity loan)
Houses without a mortgage: 812
Median household income for houses/condos with a mortgage: $85,511
Median household income for apartments without a mortgage: $77,679
Median monthly housing costs: $1,591
Compare current foreclosures near Glen Avon, CA:
| Photo | Address | Area | Beds / Baths | Price | Details |
|---|---|---|---|---|---|

|
#1
Vellanto Way
Moreno Valley, CA 92553
|
1,316 sq. feet
|
2 baths 3 beds |
$480,000
|
show details |

|
#2
Duchess Dr
Riverside, CA 92509
|
1,392 sq. feet
|
2 baths 4 beds |
$420,000
|
show details |

|
#3
Victoria St
Rancho Cucamonga, CA 91701
|
3,412 sq. feet
|
2 baths 4 beds |
$951,600
|
show details |

|
#4
Apple Court
Upland, CA 91786
|
1,655 sq. feet
|
2 baths 2 beds |
show details | |

|
#5
Celebration St
Chino, CA 91708
|
1,644 sq. feet
|
2 baths 3 beds |
show details | |

|
#6
Skyview Cir
Pomona, CA 91766
|
2,060 sq. feet
|
3 baths 4 beds |
show details | |

|
#7
Tangelo Ave
Fontana, CA 92335
|
1,648 sq. feet
|
3 baths 4 beds |
show details | |

|
#8
W Calle Celeste Dr
Rialto, CA 92377
|
2,240 sq. feet
|
2 baths 4 beds |
show details | |

|
#9
Bessant St
San Bernardino, CA 92404
|
1,500 sq. feet
|
2 baths 3 beds |
show details | |

|
#10
N Stoddard Ave
San Bernardino, CA 92407
|
1,068 sq. feet
|
1 baths 2 beds |
show details |
| Photo | Address | Area | Beds / Baths | Price | Details |
|---|---|---|---|---|---|

|
#11
E Salida Privado
Ontario, CA 91761
|
- sq. feet
|
2 baths 2 beds |
show details | |

|
#12
Independence Way
Corona, CA 92882
|
2,040 sq. feet
|
2 baths 4 beds |
show details | |

|
#13
Locust St
Chino, CA 91710
|
2,611 sq. feet
|
3 baths 3 beds |
show details | |

|
#14
Gunsmoke Rd
Norco, CA 92860
|
3,895 sq. feet
|
3 baths 6 beds |
show details | |

|
#15
E Mesa Dr
Rialto, CA 92376
|
1,868 sq. feet
|
2 baths 4 beds |
show details | |

|
#16
Parkwell Ct
Riverside, CA 92505
|
3,257 sq. feet
|
3 baths 5 beds |
show details | |

|
#17
Lake Vista Rd
Moreno Valley, CA 92557
|
2,284 sq. feet
|
3 baths 4 beds |
show details | |

|
#18
Valencia Ave
Fontana, CA 92335
|
984 sq. feet
|
1 baths 3 beds |
show details | |

|
#19
W 4th St
Ontario, CA 91762
|
1,248 sq. feet
|
2 baths 3 beds |
show details | |

|
#20
Echo Ct
San Bernardino, CA 92404
|
1,746 sq. feet
|
2 baths 3 beds |
show details |
| Photo | Address | Area | Beds / Baths | Price | Details |
|---|---|---|---|---|---|

|
#21
Camino San Benito Dr
Riverside, CA 92503
|
1,235 sq. feet
|
2 baths 3 beds |
show details | |

|
#22
Grove Dr
Riverside, CA 92503
|
3,269 sq. feet
|
4 baths 4 beds |
show details | |

|
#23
Acorn Glen Pl
Ontario, CA 91761
|
1,596 sq. feet
|
2 baths 4 beds |
show details | |

|
#24
Meadow View Dr
Pomona, CA 91766
|
1,538 sq. feet
|
2 baths 4 beds |
show details | |

|
#25
S Buena Vista Ave
Corona, CA 92882
|
3,099 sq. feet
|
2 baths 4 beds |
show details | |

|
#26
Temescal Ave
Norco, CA 92860
|
2,020 sq. feet
|
2 baths 3 beds |
show details | |

|
#27
Huntsman Pl
Fontana, CA 92336
|
3,216 sq. feet
|
4 baths 5 beds |
show details | |

|
#28
W Wilson St
Pomona, CA 91768
|
576 sq. feet
|
1 baths 1 beds |
show details | |

|
#29
S Towne Ave
Pomona, CA 91766
|
1,980 sq. feet
|
3 baths 3 beds |
show details | |

|
#30
Citrus Ave # 125
Fontana, CA 92336
|
2,051 sq. feet
|
2 baths 3 beds |
show details |
| Photo | Address | Area | Beds / Baths | Price | Details |
|---|---|---|---|---|---|

|
#31
Hunter Rd
Chino Hills, CA 91709
|
2,360 sq. feet
|
2 baths 3 beds |
show details | |

|
#32
Date St
Fontana, CA 92335
|
1,188 sq. feet
|
1 baths 3 beds |
show details | |

|
#33
Flora St
Montclair, CA 91763
|
1,145 sq. feet
|
2 baths 4 beds |
show details | |

|
#34
Tate St
Pomona, CA 91767
|
1,656 sq. feet
|
1 baths 3 beds |
show details | |

|
#35
Foxglen Loop
Ontario, CA 91761
|
1,760 sq. feet
|
3 baths 4 beds |
show details | |

|
#36
E Hawthorne St
Ontario, CA 91764
|
1,475 sq. feet
|
2 baths 3 beds |
show details | |

|
#37
Turning Leaf Pl
Rancho Cucamonga, CA 91701
|
2,252 sq. feet
|
2 baths 3 beds |
show details | |

|
#38
Mount Elena Cir
Corona, CA 92882
|
2,715 sq. feet
|
2 baths 5 beds |
show details | |

|
#39
Oleander Ave
Fontana, CA 92335
|
1,218 sq. feet
|
2 baths 3 beds |
show details | |

|
#40
Belvedere Way
Corona, CA 92882
|
2,113 sq. feet
|
3 baths 4 beds |
show details |
| Photo | Address | Area | Beds / Baths | Price | Details |
|---|---|---|---|---|---|

|
#41
Via Regallo Dr
Rancho Cucamonga, CA 91739
|
3,712 sq. feet
|
4 baths 4 beds |
show details | |

|
#42
N F St
San Bernardino, CA 92405
|
- sq. feet
|
2 baths 3 beds |
show details | |

|
#43
N Chason Way
San Bernardino, CA 92407
|
2,844 sq. feet
|
3 baths 5 beds |
show details | |

|
#44
N Allen St
San Bernardino, CA 92408
|
981 sq. feet
|
2 baths 3 beds |
show details | |

|
#45
N Towne Ave
Pomona, CA 91767
|
2,177 sq. feet
|
2 baths 5 beds |
show details | |

|
#46
Ceres Ave
Fontana, CA 92335
|
1,248 sq. feet
|
1 baths 3 beds |
show details | |

|
#47
Mountain View Ave
Riverside, CA 92504
|
1,107 sq. feet
|
1 baths 3 beds |
show details | |

|
#48
N Mountain View Ave
San Bernardino, CA 92405
|
1,008 sq. feet
|
1 baths 2 beds |
show details | |

|
#49
Mcguire Rd
Perris, CA 92570
|
6,347 sq. feet
|
4 baths 5 beds |
show details | |

|
Check over 1 million property listings on Foreclosure.com!
|
browse all offers | |||

 | Highgrove, CA's future and gentrification??? (56 replies) |
| BELLTOWN, California - Please Tell Me All About This Area (14 replies) |
| Best/worst places of the San Bernardino area? (100 replies) |
| Why did you move or going to move to Inland Empire ? (42 replies) |
| Better part of Eastvale (4 replies) |
| Any Info About CORONA? (16 replies) |
Median year apartment built: 1971
Household type by relationship:
Households: 23,795- In family households: 21,277 (2,672 male householders, 1,812 female householders)
3,211 spouses, 8,459 children (7,895 natural, 346 adopted, 218 stepchildren), 1,366 grandchildren, 1,004 brothers or sisters, 601 parents, 168 foster children, 886 other relatives, 1,261 non-relatives
- In nonfamily households: 2,393 (766 male householders (618 living alone)), 1,156 female householders (967 living alone)), 470 nonrelatives
- In group quarters: 124
Size of family households: 814 2-persons, 1,135 3-persons, 599 4-persons, 727 5-persons, 442 6-persons, 654 7-or-more-persons.
Size of nonfamily households: 1,563 1-person, 320 2-persons, 35 3-persons, 16 4-persons.
3,547 married couples with children.
987 single-parent households (526 men, 461 women).
43.5% of residents of Glen Avon speak English at home.
54.4% of residents speak Spanish at home (61% speak English very well, 20% speak English well, 14% speak English not well, 5% don't speak English at all).
0.5% of residents speak other Indo-European language at home (63% speak English very well, 37% speak English well).
1.4% of residents speak Asian or Pacific Island language at home (56% speak English very well, 33% speak English well, 11% speak English not well).
0.3% of residents speak other language at home (100% speak English not well).
Foreign born population: 6,681 (29.1%)
(32.9% of them are naturalized citizens)
| Here: | 5.7 |
| State: | 6.0 |
| Here: | 4.0 |
| State: | 3.9 |
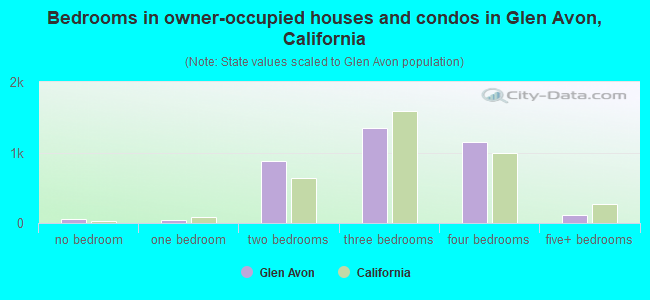
- Bedrooms in owner-occupied houses and condos in Glen Avon, California
- 62no bedroom
- 441 bedroom
- 8822 bedrooms
- 1,3543 bedrooms
- 1,1454 bedrooms
- 1145+ bedrooms
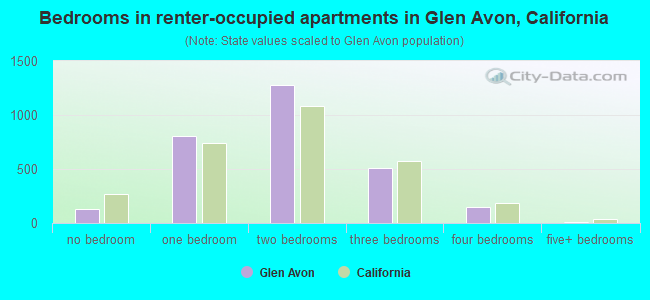
- Bedrooms in renter-occupied apartments in Glen Avon, California
- 133no bedroom
- 8021 bedroom
- 1,2802 bedrooms
- 5133 bedrooms
- 1454 bedrooms
- 105+ bedrooms
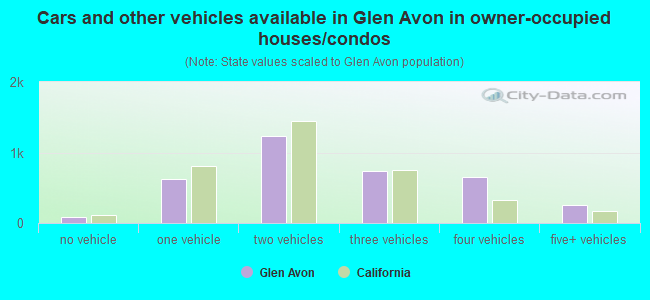
- Cars and other vehicles available in Glen Avon in owner-occupied houses/condos
- 84no vehicle
- 6301 vehicle
- 1,2272 vehicles
- 7443 vehicles
- 6594 vehicles
- 2585+ vehicles
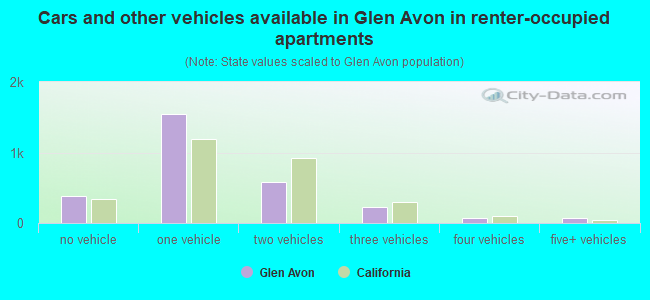
- Cars and other vehicles available in Glen Avon in renter-occupied apartments
- 381no vehicle
- 1,5481 vehicle
- 5792 vehicles
- 2273 vehicles
- 714 vehicles
- 775+ vehicles
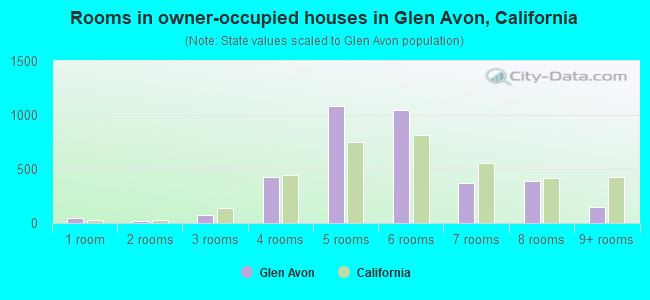
- Rooms in owner-occupied houses in Glen Avon, California
- 461 room
- 162 rooms
- 773 rooms
- 4294 rooms
- 1,0845 rooms
- 1,0426 rooms
- 3697 rooms
- 3938 rooms
- 1469+ rooms
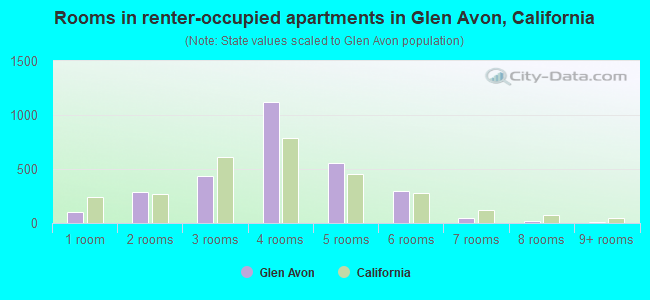
- Rooms in renter-occupied apartments in Glen Avon, California
- 1041 room
- 2902 rooms
- 4353 rooms
- 1,1234 rooms
- 5605 rooms
- 2956 rooms
- 497 rooms
- 168 rooms
- 109+ rooms
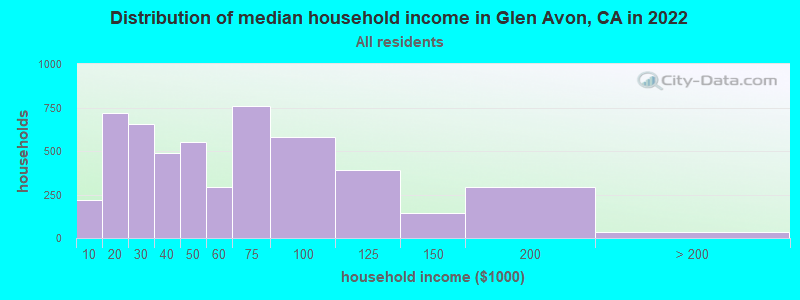
Glen Avon, CA household income distribution

- 218Less than $10,000
- 721$10,000 to $19,999
- 654$20,000 to $29,999
- 488$30,000 to $39,999
- 550$40,000 to $49,999
- 294$50,000 to $59,999
- 757$60,000 to $74,999
- 579$75,000 to $99,999
- 389$100,000 to $124,999
- 142$125,000 to $149,999
- 295$150,000 to $199,999
- 33$200,000 or more
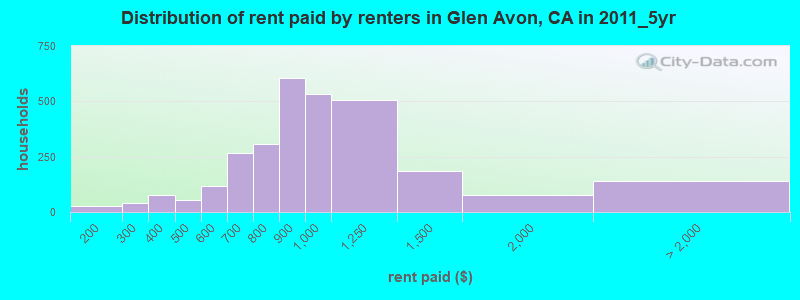
Rent paid by renters in 2011_5yr in Glen Avon, CA
-
- 26$150 to $199
- 23$200 to $249
- 19$250 to $299
- 28$300 to $349
- 48$350 to $399
- 53$400 to $449
- 53$500 to $549
- 63$550 to $599
- 39$600 to $649
- 226$650 to $699
- 247$700 to $749
- 57$750 to $799
- 603$800 to $899
- 531$900 to $999
- 505$1,000 to $1,249
- 187$1,250 to $1,499
- 78$1,500 to $1,999
- 92$2,000 or more
- 48No cash rent
Percentage of workers working in this county: 44.8%
Number of people working at home: 639 (7.4% of all workers)
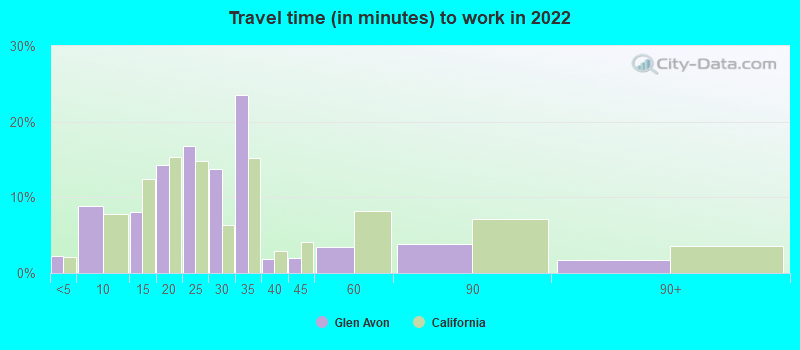
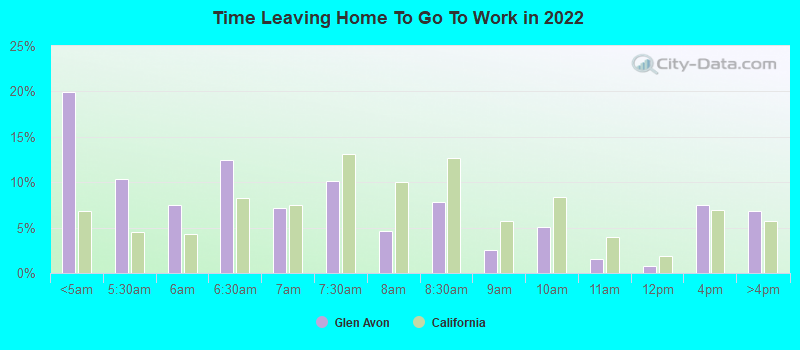
Travel time to work (commute)
- Less than 5 minutes: 104
- 5 to 9 minutes: 506
- 10 to 14 minutes: 859
- 15 to 19 minutes: 1,027
- 20 to 24 minutes: 1,407
- 25 to 29 minutes: 892
- 30 to 34 minutes: 1,015
- 35 to 39 minutes: 471
- 40 to 44 minutes: 180
- 45 to 59 minutes: 824
- 60 to 89 minutes: 777
- 90 or more minutes: 428

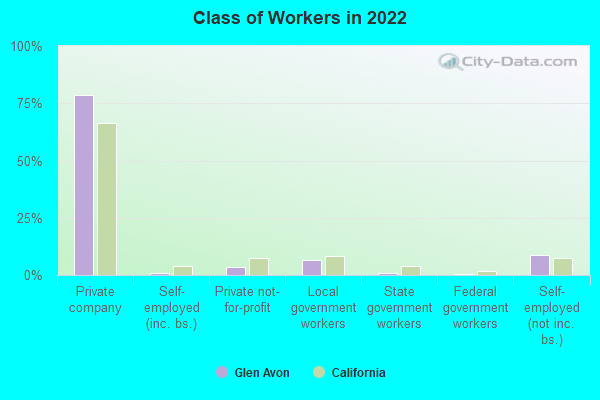
Means of transportation to work:
- Drove a car alone: 4,223 (72.6%)
- Carpooled: 704 (12.1%)
- Bus or trolley bus: 15 (0.3%)
- Taxi: 73 (1.3%)
- Bicycle: 24 (0.4%)
- Walked: 50 (0.9%)
- Worked at home: 639 (11.0%)
- Unemployment by race in 2022
- Unemployment rate for White non-Hispanic residents
- 12.6%Males
- 8.8%Females
- Unemployment rate for Black residents
- 3.9%Males
- 15.5%Females
- Unemployment rate for Asian residents
- 2.9%Males
- Unemployment rate for other race residents
- 6.2%Males
- 26.6%Females
- Unemployment rate for two or more race residents
- 100.0%Males
- 26.8%Females
- Unemployment rate for Hispanic or Latino residents
- 7.8%Males
- 17.2%Females
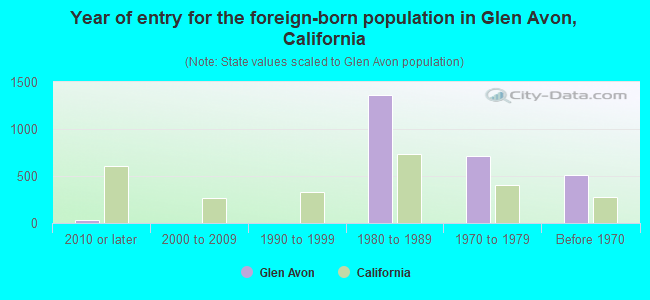
- Year of entry for the foreign-born population in Glen Avon, California
- 312010 or later
- 02000 to 2009
- 01990 to 1999
- 1,3631980 to 1989
- 7131970 to 1979
- 511Before 1970
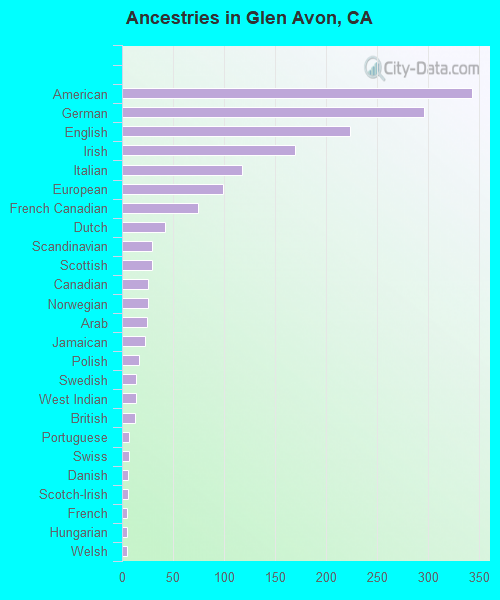
First ancestries reported:
- American: 343 (2.4%)
- German: 296 (2.1%)
- English: 224 (1.6%)
- Irish: 170 (1.2%)
- Italian: 118 (0.8%)
- European: 99 (0.7%)
- French Canadian: 75 (0.5%)
- Dutch: 42 (0.3%)
- Scandinavian: 29 (0.2%)
- Scottish: 29 (0.2%)
- Canadian: 26 (0.2%)
- Norwegian: 26 (0.2%)
- Arab: 25 (0.2%)
- Jamaican: 23 (0.2%)
- Polish: 17 (0.1%)
- Swedish: 14 (0.10%)
- West Indian: 14 (0.10%)
- British: 13 (0.09%)
- Portuguese: 7 (0.05%)
- Swiss: 7 (0.05%)
- Danish: 6 (0.04%)
- Scotch-Irish: 6 (0.04%)
- French: 5 (0.04%)
- Hungarian: 5 (0.04%)
- Welsh: 5 (0.04%)
- Slovak: 4 (0.03%)
Most common places of birth for foreign-born residents (%):
| Glen Avon: | 85.5% (5,088) |
| California: | 100.0% (-1) |
| Glen Avon: | 3.4% (202) |
| California: | 100.0% (-1) |
| Glen Avon: | 2.8% (166) |
| California: | 100.0% (-1) |
Place of birth for U.S.-born residents:
- This state: 13,939
- Other state: 2,234
- Northeast: 255
- Midwest: 831
- South: 691
- West: 459
87.7% of Glen Avon residents lived in the same house 1 years ago.
Out of people who lived in different houses, 26.1% lived in this county.
Out of people who lived in different counties, 88.4% lived in California.
| Glen Avon: | 87.7% |
| State average: | 88.9% |
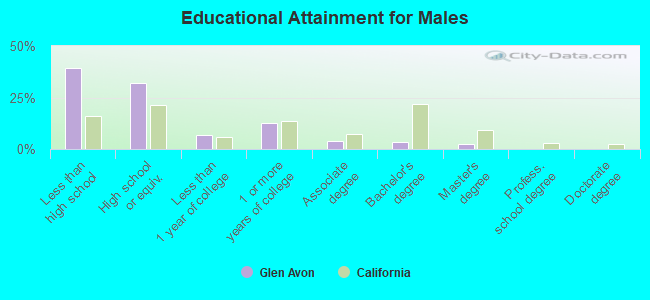
Education attainment for males 25 years and older:
- No schooling: 363
- Nursery to 4th grade: 104
- 5th and 6th grade: 598
- 7th and 8th grade: 238
- 9th grade: 257
- 10th grade: 250
- 11th grade: 211
- 12th grade, no diploma: 567
- High school graduate (or equivalency): 2,106
- Less than 1 year of college: 435
- Some college more than 1 year, no degree: 829
- Associate degree: 247
- Bachelor's degree: 230
- Master's degree: 161
- Professional school degree: 14
- Doctorate degree: 0
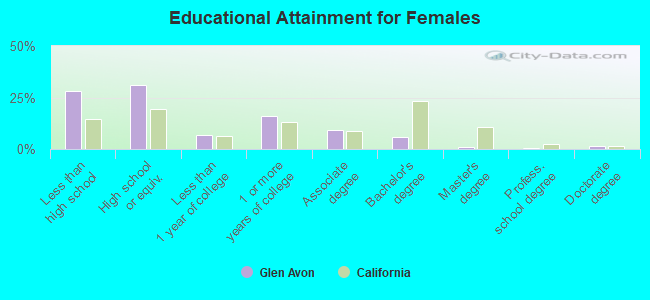
Education attainment for females 25 years and older:
- No schooling: 247
- Nursery to 4th grade: 201
- 5th and 6th grade: 419
- 7th and 8th grade: 168
- 9th grade: 146
- 10th grade: 87
- 11th grade: 189
- 12th grade, no diploma: 330
- High school graduate (or equivalency): 1,978
- Less than 1 year of college: 431
- Some college more than 1 year, no degree: 1,011
- Associate degree: 588
- Bachelor's degree: 356
- Master's degree: 57
- Professional school degree: 42
- Doctorate degree: 83
Housing units in structures:
- One, detached: 3,991
- One, attached: 190
- Two: 83
- 3 or 4: 66
- 5 to 9: 317
- 10 to 19: 882
- 20 to 49: 199
- 50 or more: 333
- Mobile homes: 875
- Boats, RVs, vans, etc.: 41
Median worth of mobile homes: $76,489
Housing units lacking complete kitchen facilities in 2022: 5.7%
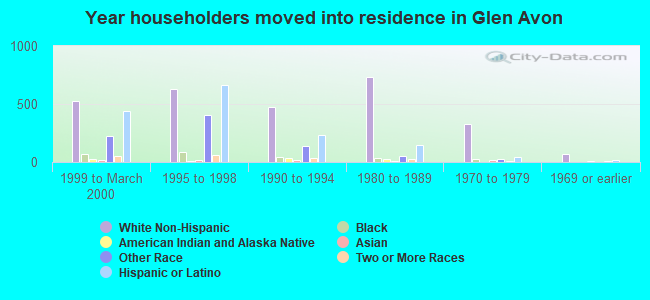
House/condo owner moved in on average 12 years ago
Renter moved in on average 6 years ago
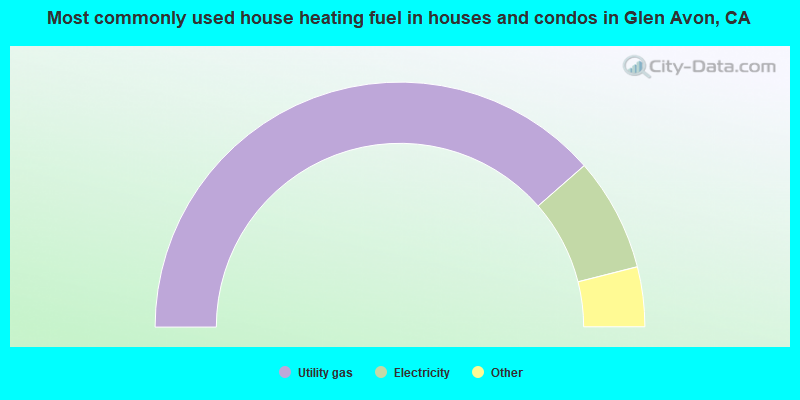
- 77.1%Utility gas
- 15.0%Electricity
- 3.0%Wood
- 2.5%Bottled, tank, or LP gas
- 1.8%No fuel used
- 0.6%Other fuel
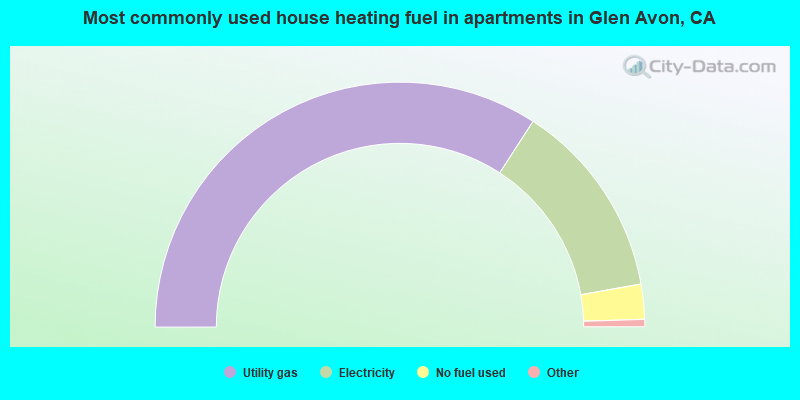
- 68.3%Utility gas
- 26.1%Electricity
- 4.6%No fuel used
- 0.5%Bottled, tank, or LP gas
- 0.4%Wood
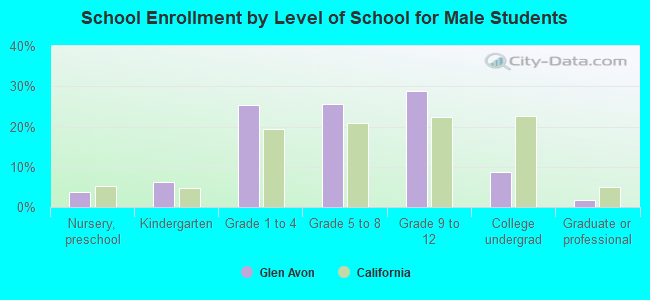
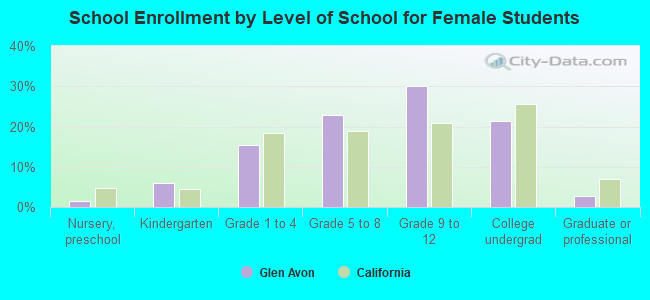
Private vs. public school enrollment:
| Here: | 4.3% |
| California: | 10.5% |
| Here: | 3.4% |
| California: | 8.5% |
| Here: | 14.4% |
| California: | 15.9% |